| Param | Original file | Final file |
|---|---|---|
| Filename | modeM0/AS1P01_123T01_9000000024_00234cztM0_level2.evt | modeM0/AS1P01_123T01_9000000024_00234cztM0_level2_quad_clean.evt |
| Size (bytes) | 878,397,120 | 82,094,400 |
| Size | 837.7 MB | 78.3 MB |
| Events in quadrant A | 6,242,667 | 522,581 |
| Events in quadrant B | 6,651,896 | 525,063 |
| Events in quadrant C | 5,868,860 | 543,671 |
| Events in quadrant D | 7,466,998 | 503,417 |
| Mode SS | |||
|---|---|---|---|
| Quadrant | BADHDUFLAG | Total packets | Discarded packets |
| A | 0 | 116 | 0 |
| B | 0 | 116 | 0 |
| C | 0 | 116 | 0 |
| D | 0 | 116 | 0 |
| Mode M9 | |||
|---|---|---|---|
| Quadrant | BADHDUFLAG | Total packets | Discarded packets |
| A | 0 | 18 | 0 |
| B | 0 | 18 | 0 |
| C | 0 | 18 | 0 |
| D | 0 | 19 | 0 |
| Mode M0 | |||
|---|---|---|---|
| Quadrant | BADHDUFLAG | Total packets | Discarded packets |
| A | 0 | 22535 | 3 |
| B | 0 | 23704 | 2 |
| C | 0 | 21454 | 2 |
| D | 0 | 26189 | 2 |
| Quadrant | Total seconds | Saturated seconds | Saturation percentage |
|---|---|---|---|
| A | 5585 | 5 | 0.089526% |
| B | 5585 | 13 | 0.232766% |
| C | 5585 | 3 | 0.053715% |
| D | 5585 | 230 | 4.118174% |
Noise dominated data is calculated using 1-second bins in cleaned event files. If a bin has >2000 counts, and if more than 50% of those come from <1% of pixels, then it is considered to be noise-dominated and hence unusable.
| Quadrant | # 1 sec bins | Bins with >0 counts | Bins with >2000 counts | High rate bins dominated by noise | Noise dominated (total time) | Noise dominated (detector-on time) | Marked lightcurve |
|---|---|---|---|---|---|---|---|
| A | 7320 | 5586 | 80 | 80 | 1.09% | 1.43% | 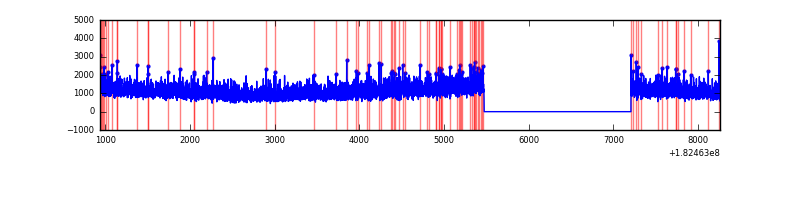 |
| B | 7320 | 5586 | 114 | 114 | 1.56% | 2.04% | 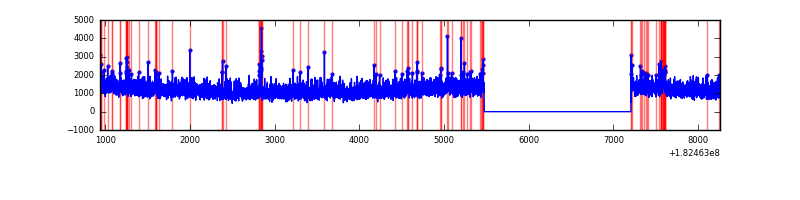 |
| C | 7320 | 5586 | 35 | 35 | 0.48% | 0.63% | 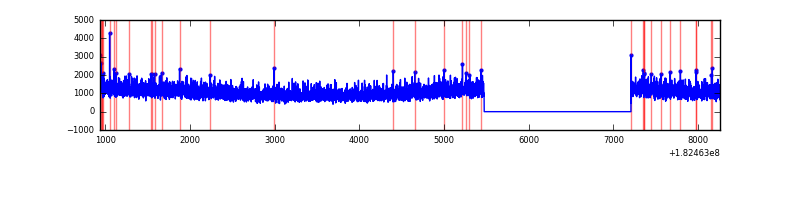 |
| D | 7320 | 5586 | 630 | 630 | 8.61% | 11.28% | 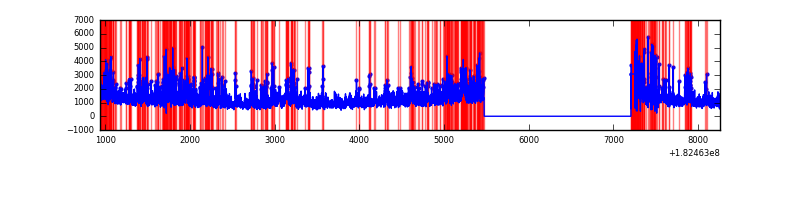 |
Top three noisy pixels from each quadrant. If the there are fewer than three noisy pixels in the level2.evt file, extra rows are filled as -1
| Pixel properties | Quadrant properties | ||||||
|---|---|---|---|---|---|---|---|
| Quadrant | DetID | PixID | Counts | Sigma | Mean | Median | Sigma |
| A | 15 | 250 | 11615 | 28.15 | 1605 | 1583 | 356.3 |
| A | 12 | 189 | 7027 | 15.28 | 1605 | 1583 | 356.3 |
| A | 13 | 239 | 6222 | 13.02 | 1605 | 1583 | 356.3 |
| B | 5 | 46 | 220279 | 580.46 | 1628 | 1638 | 376.7 |
| B | 7 | 220 | 58610 | 151.25 | 1628 | 1638 | 376.7 |
| B | 0 | 85 | 39255 | 99.87 | 1628 | 1638 | 376.7 |
| C | 5 | 251 | 7374 | 14.13 | 1488 | 1541 | 412.7 |
| C | 5 | 175 | 6474 | 11.95 | 1488 | 1541 | 412.7 |
| C | 10 | 69 | 6082 | 11.0 | 1488 | 1541 | 412.7 |
| D | 1 | 4 | 1485357 | 3521.55 | 1451 | 1476 | 421.4 |
| D | 2 | 85 | 138629 | 325.49 | 1451 | 1476 | 421.4 |
| D | 10 | 154 | 61511 | 142.48 | 1451 | 1476 | 421.4 |
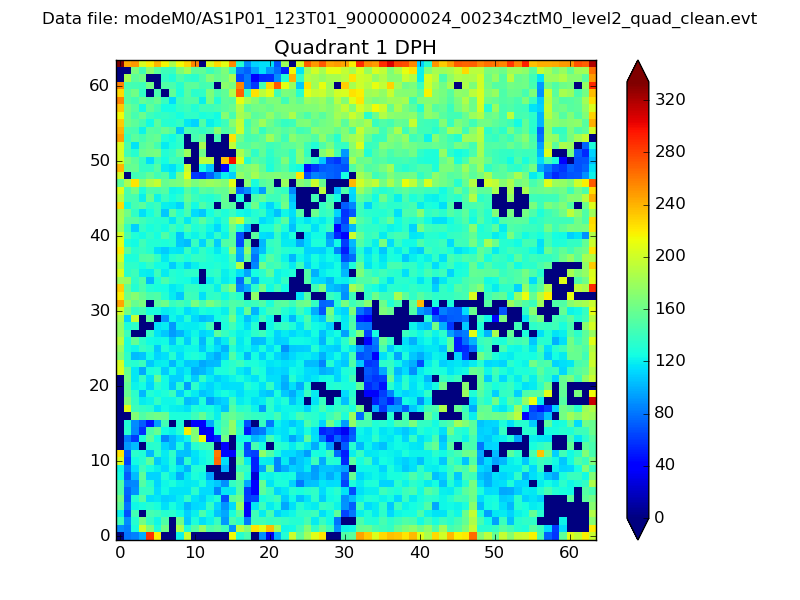
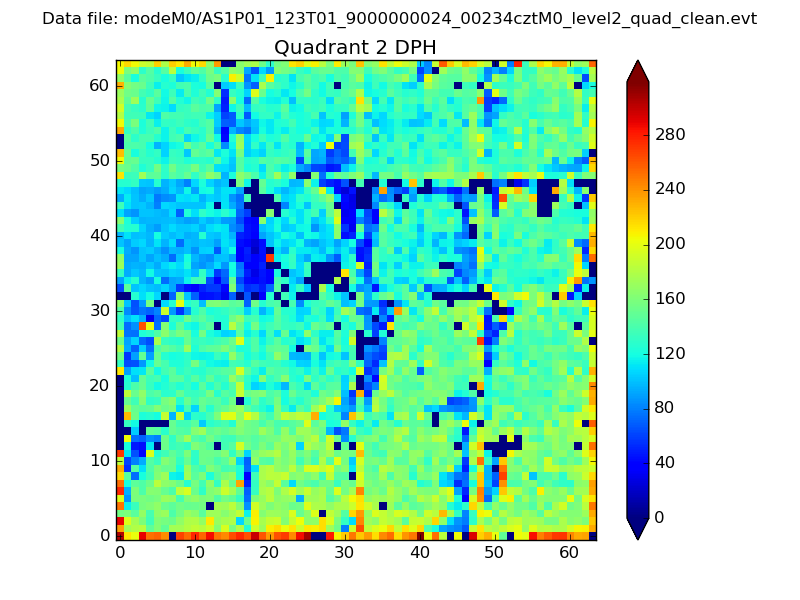
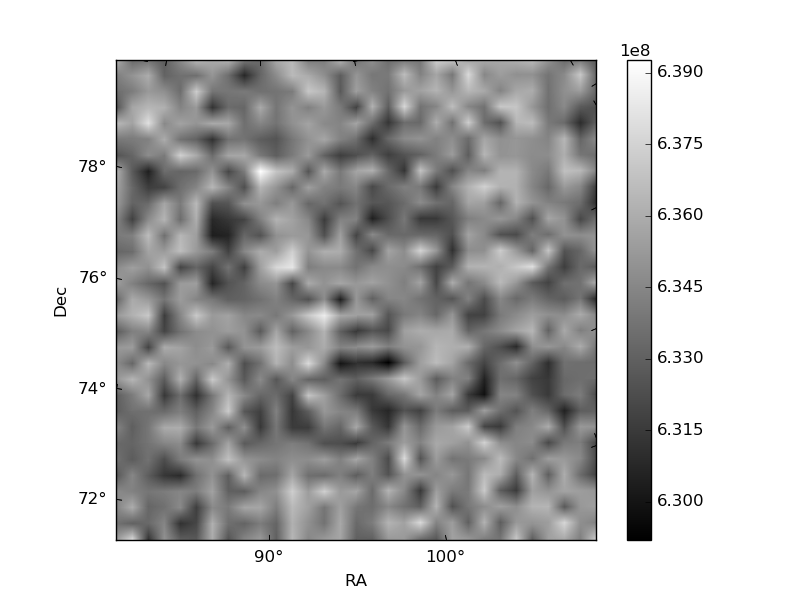
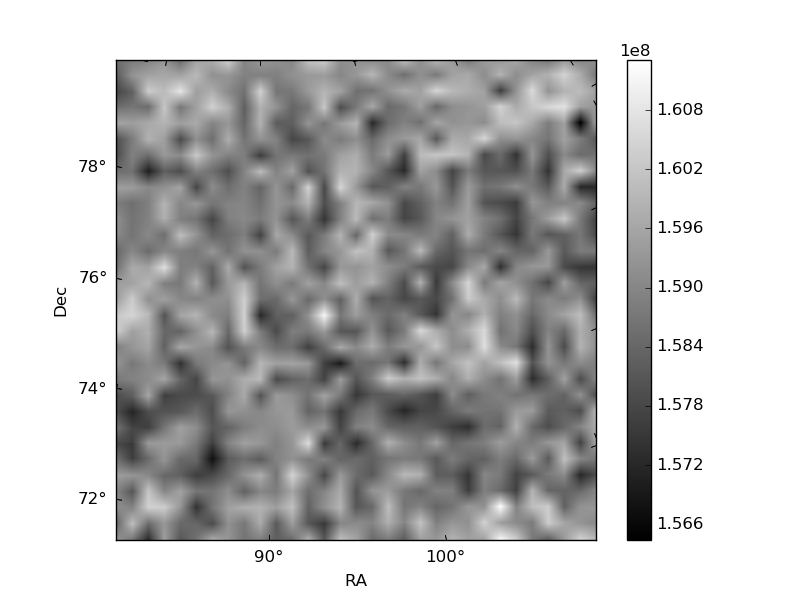
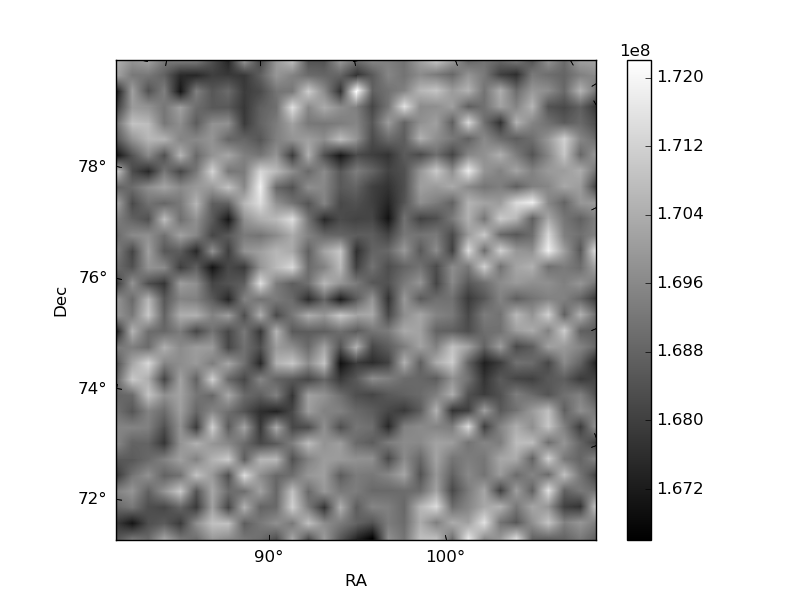
Histogram calculated using DETX and DETY for each event in the final _common_clean file
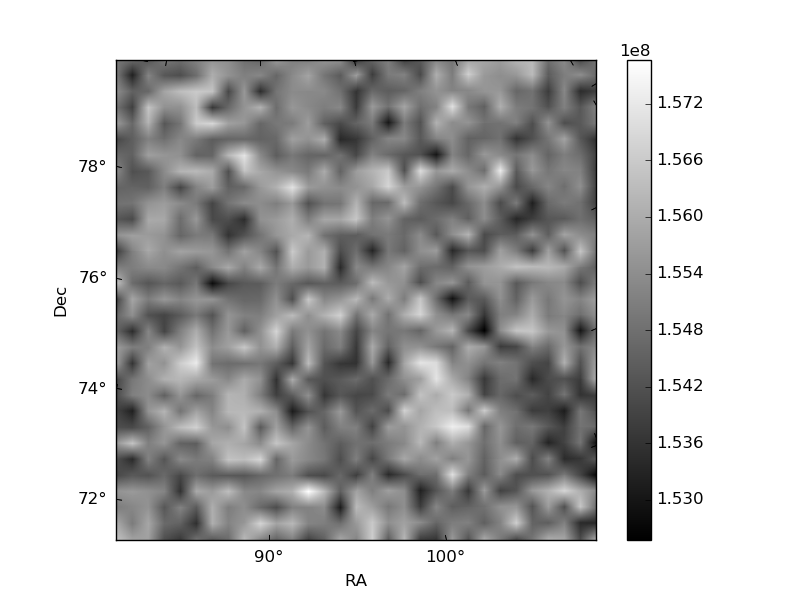
| Quadrant A |  |
 |
Quadrant B |
|---|---|---|---|
| Quadrant D | 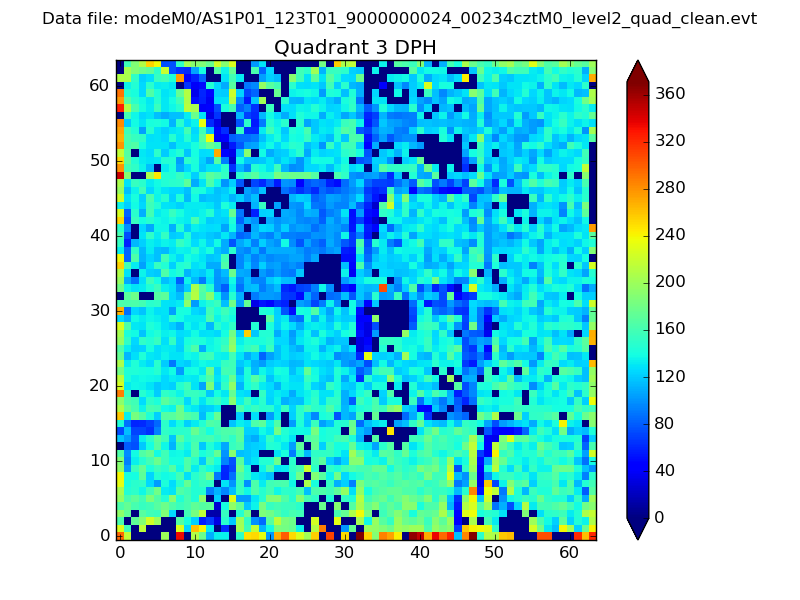 |
 |
Quadrant C |
| Plot type | Count rate plots | Images |
|---|---|---|
| Comparison with Poisson distribution Blue bars denote a histogram of data divided into 1 sec bins. Red curve is a Poisson curve with rate = median count rate of data. |
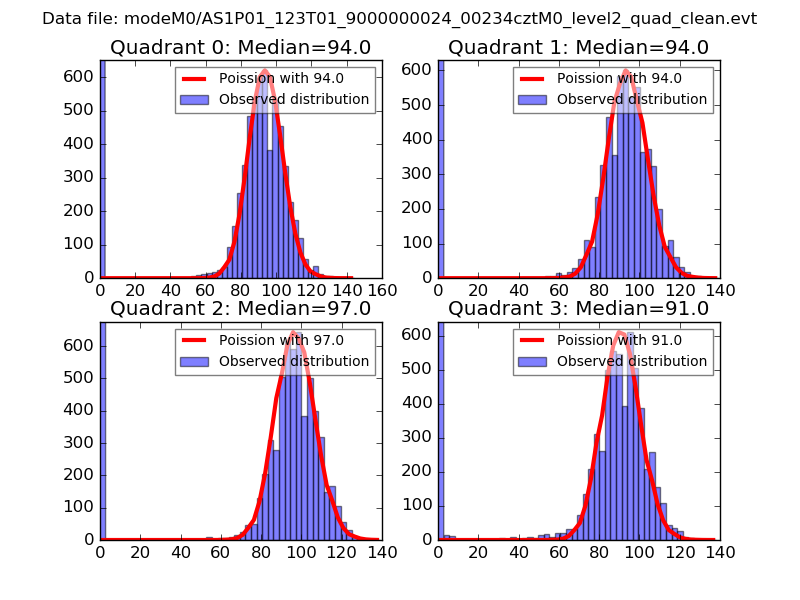 |
 |
| Quadrant-wise count rates Data is divided into 100 sec bins |
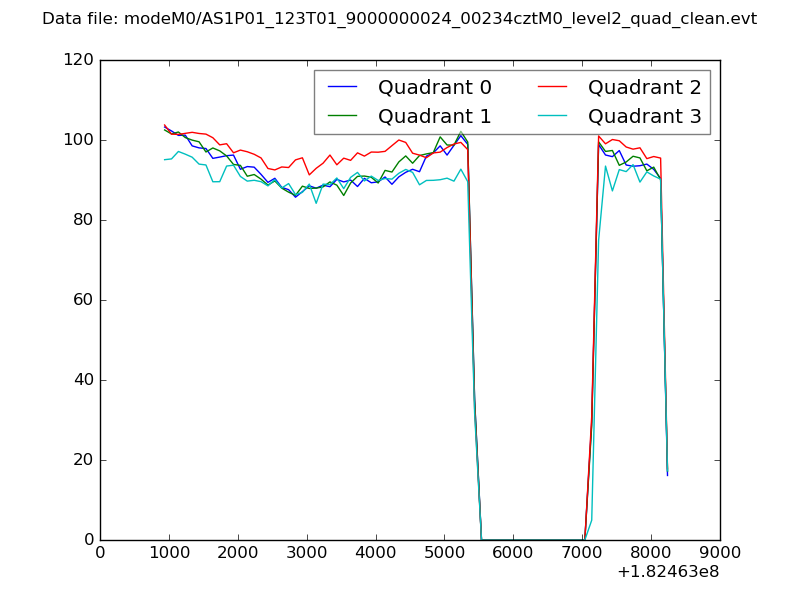 |
|
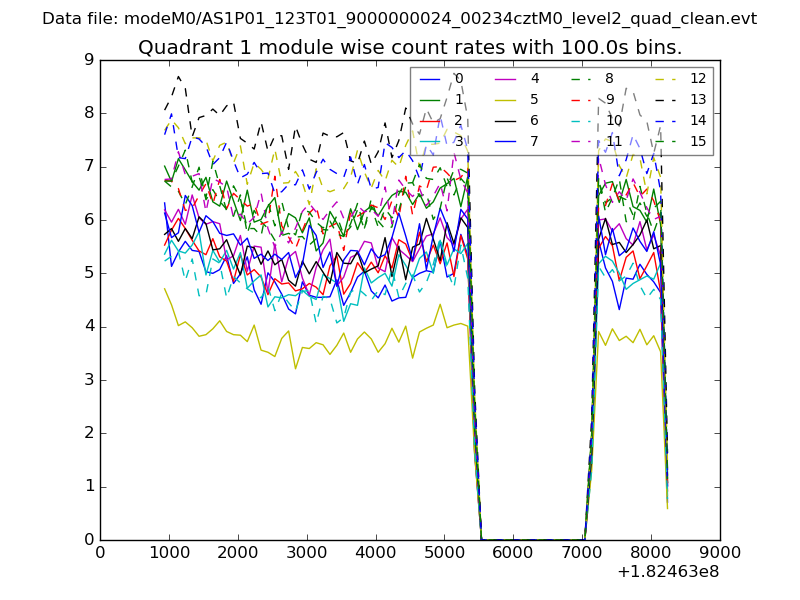
| Module-wise count rates for Quadrant A Data is divided into 100 sec bins |
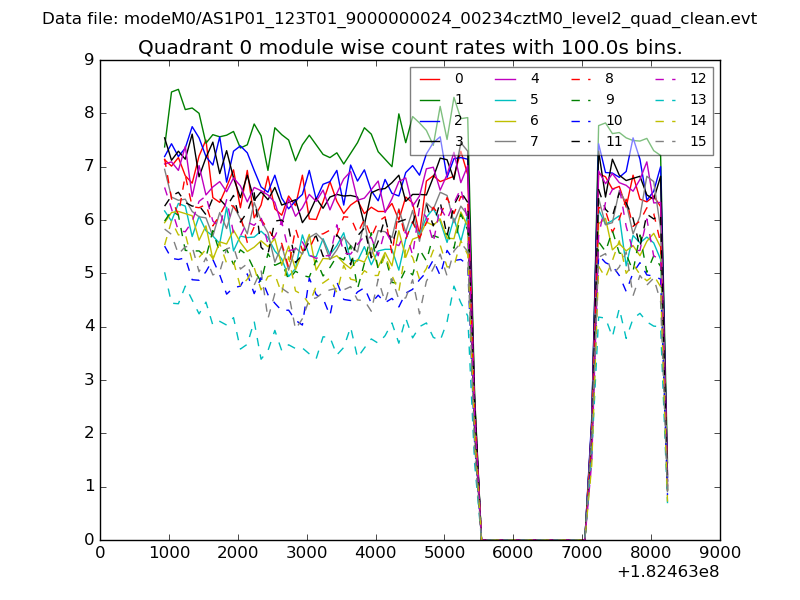 |
 |
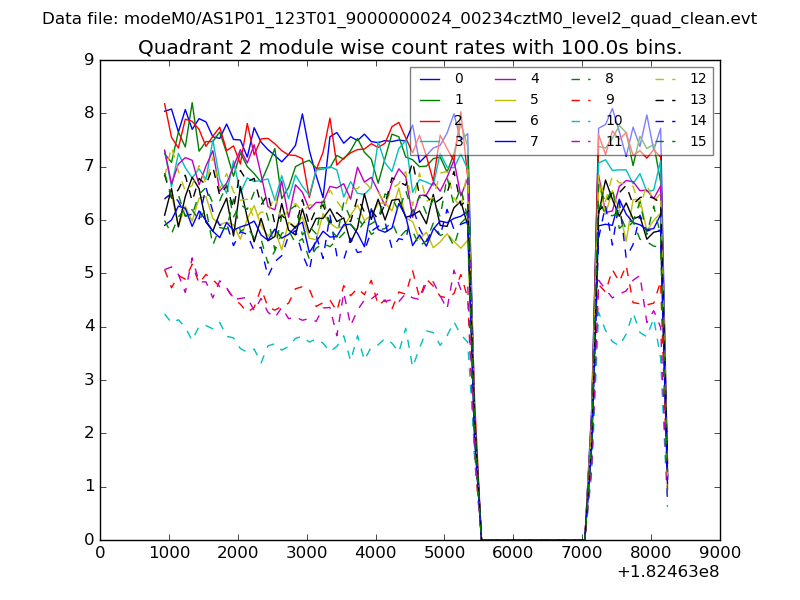
| Module-wise count rates for Quadrant B Data is divided into 100 sec bins |
 |
 |
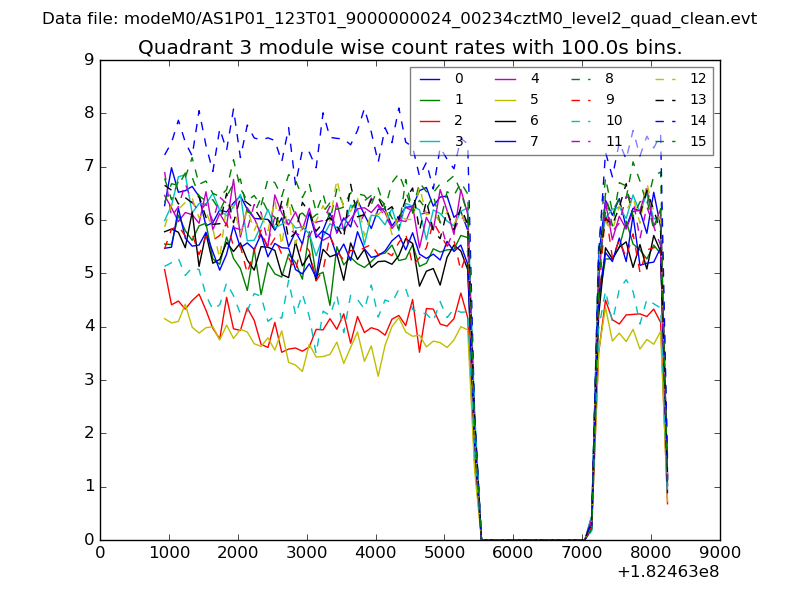
| Module-wise count rates for Quadrant C Data is divided into 100 sec bins |
 |
 |
| Module-wise count rates for Quadrant D Data is divided into 100 sec bins |
 |
 |
| Parameter | Plot |
|---|---|
| CZT HV Monitor | 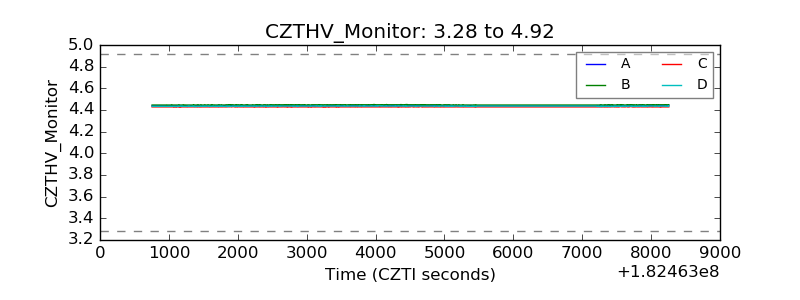 |
| D_VDD | 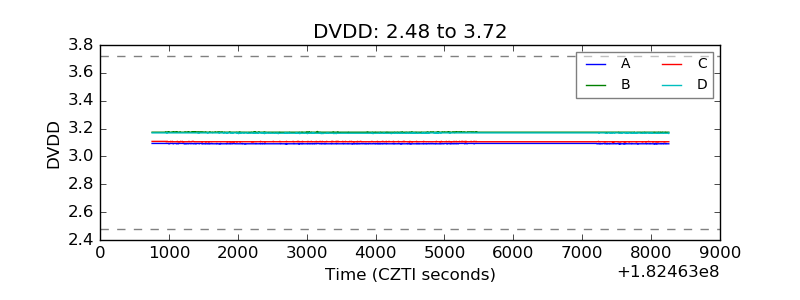 |
| Temperature 1 | 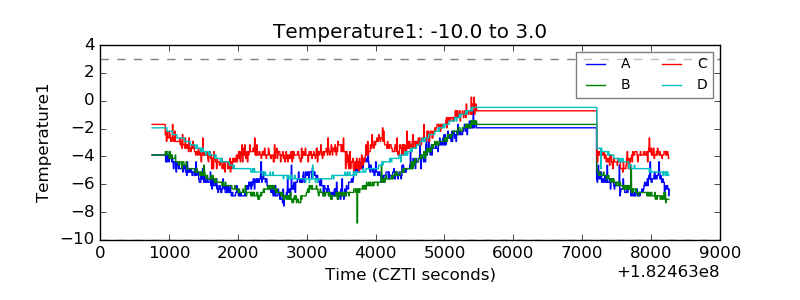 |
| Veto HV Monitor | 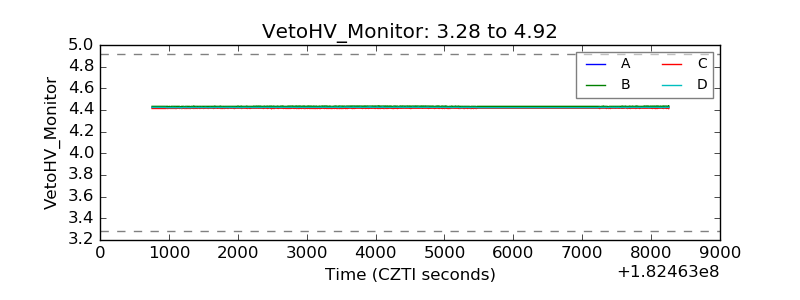 |
| Veto LLD | 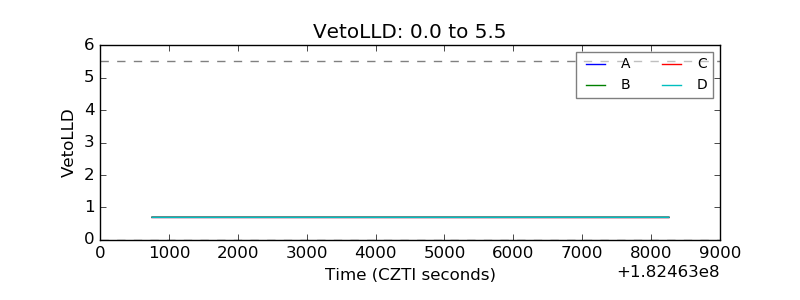 |
| Alpha Counter | 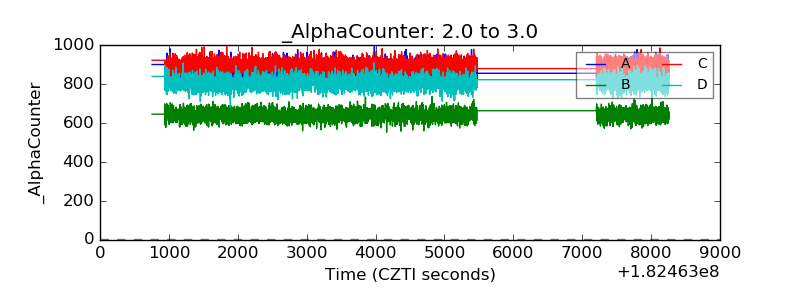 |
| _CPM_Rate | 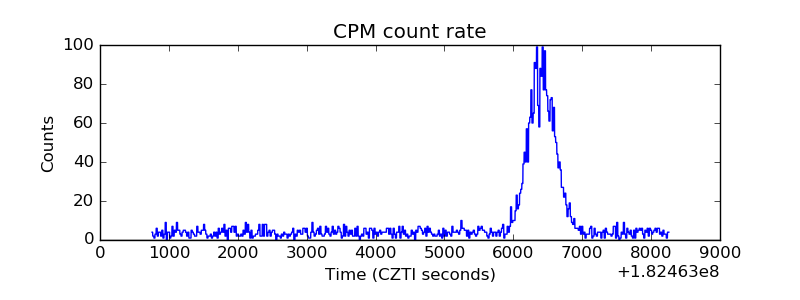 |
| CZT Counter | 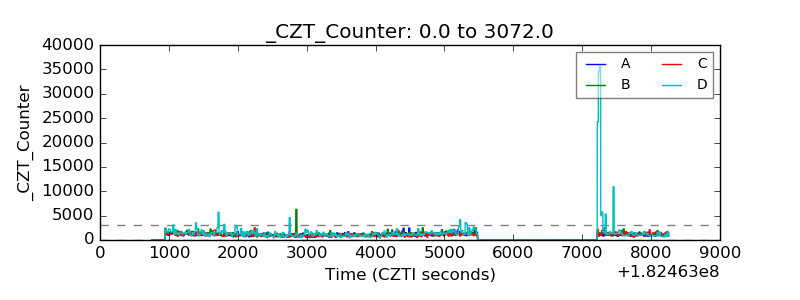 |
| +2.5 Volts monitor |  |
| +5 Volts monitor |  |
| _ROLL_ROT | 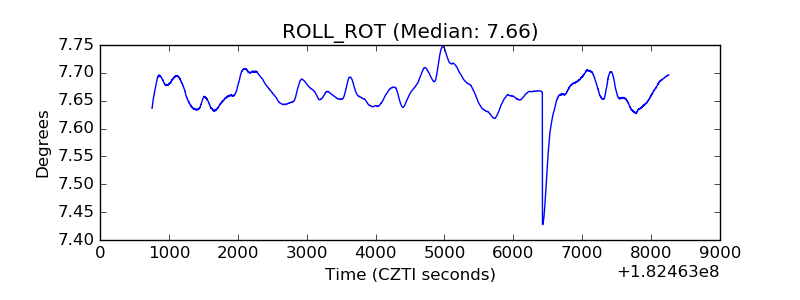 |
| _Roll_DEC | 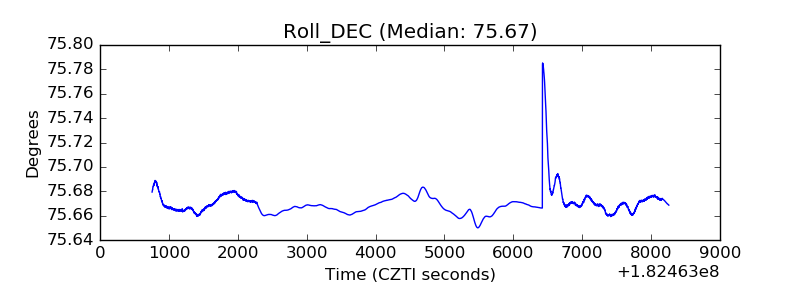 |
| _Roll_RA | 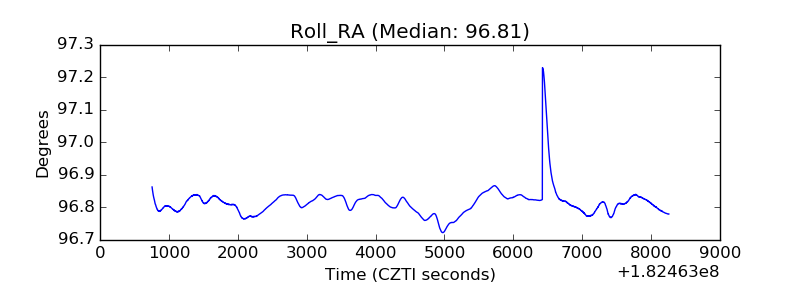 |
| Veto Counter | 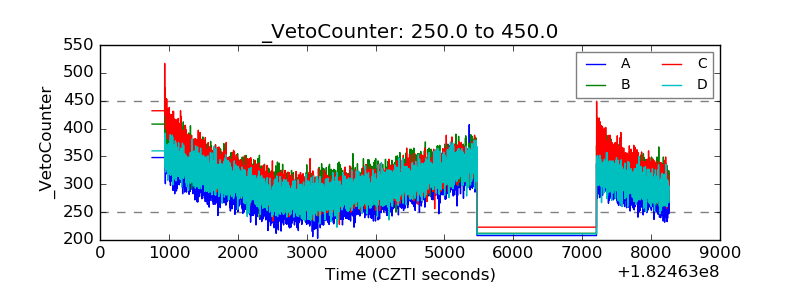 |