| Param | Original file | Final file |
|---|---|---|
| Filename | modeM0/AS1P01_123T01_9000000024_00237cztM0_level2.evt | modeM0/AS1P01_123T01_9000000024_00237cztM0_level2_quad_clean.evt |
| Size (bytes) | 885,150,720 | 78,632,640 |
| Size | 844.1 MB | 75.0 MB |
| Events in quadrant A | 6,430,551 | 498,554 |
| Events in quadrant B | 6,571,332 | 504,585 |
| Events in quadrant C | 5,745,880 | 510,764 |
| Events in quadrant D | 7,689,133 | 477,897 |
| Mode SS | |||
|---|---|---|---|
| Quadrant | BADHDUFLAG | Total packets | Discarded packets |
| A | 0 | 114 | 0 |
| B | 0 | 114 | 0 |
| C | 0 | 114 | 0 |
| D | 0 | 114 | 0 |
| Mode M9 | |||
|---|---|---|---|
| Quadrant | BADHDUFLAG | Total packets | Discarded packets |
| A | 0 | 17 | 0 |
| B | 0 | 17 | 0 |
| C | 0 | 17 | 0 |
| D | 0 | 17 | 0 |
| Mode M0 | |||
|---|---|---|---|
| Quadrant | BADHDUFLAG | Total packets | Discarded packets |
| A | 0 | 23070 | 2 |
| B | 0 | 23473 | 1 |
| C | 0 | 21067 | 1 |
| D | 0 | 26816 | 1 |
| Quadrant | Total seconds | Saturated seconds | Saturation percentage |
|---|---|---|---|
| A | 5560 | 3 | 0.053957% |
| B | 5560 | 14 | 0.251799% |
| C | 5560 | 2 | 0.035971% |
| D | 5560 | 330 | 5.935252% |
Noise dominated data is calculated using 1-second bins in cleaned event files. If a bin has >2000 counts, and if more than 50% of those come from <1% of pixels, then it is considered to be noise-dominated and hence unusable.
| Quadrant | # 1 sec bins | Bins with >0 counts | Bins with >2000 counts | High rate bins dominated by noise | Noise dominated (total time) | Noise dominated (detector-on time) | Marked lightcurve |
|---|---|---|---|---|---|---|---|
| A | 7264 | 5561 | 95 | 95 | 1.31% | 1.71% | 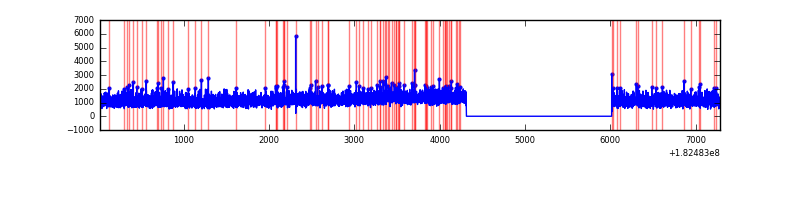 |
| B | 7264 | 5561 | 129 | 129 | 1.78% | 2.32% | 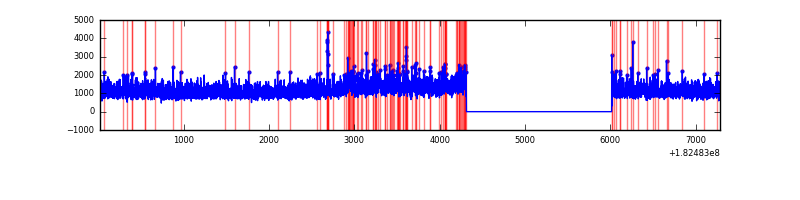 |
| C | 7264 | 5561 | 33 | 33 | 0.45% | 0.59% | 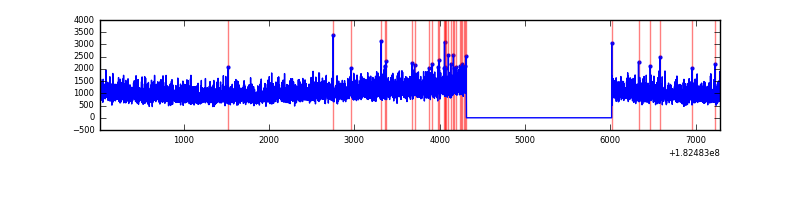 |
| D | 7264 | 5561 | 852 | 852 | 11.73% | 15.32% | 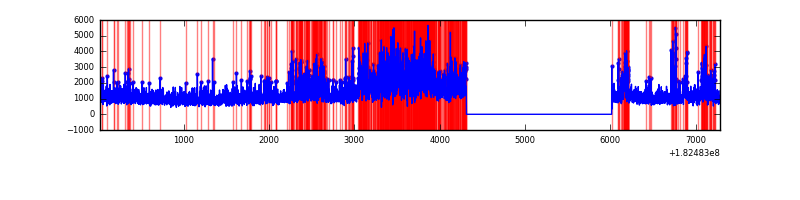 |
Top three noisy pixels from each quadrant. If the there are fewer than three noisy pixels in the level2.evt file, extra rows are filled as -1
| Pixel properties | Quadrant properties | ||||||
|---|---|---|---|---|---|---|---|
| Quadrant | DetID | PixID | Counts | Sigma | Mean | Median | Sigma |
| A | 12 | 150 | 25132 | 64.46 | 1645 | 1629 | 364.6 |
| A | 5 | 244 | 21216 | 53.72 | 1645 | 1629 | 364.6 |
| A | 12 | 189 | 12070 | 28.63 | 1645 | 1629 | 364.6 |
| B | 7 | 220 | 163432 | 420.31 | 1634 | 1639 | 384.9 |
| B | 5 | 46 | 51565 | 129.7 | 1634 | 1639 | 384.9 |
| B | 15 | 219 | 31840 | 78.46 | 1634 | 1639 | 384.9 |
| C | 1 | 1 | 11267 | 23.96 | 1454 | 1504 | 407.5 |
| C | 10 | 69 | 8779 | 17.85 | 1454 | 1504 | 407.5 |
| C | 0 | 186 | 6735 | 12.84 | 1454 | 1504 | 407.5 |
| D | 1 | 4 | 1945764 | 4627.44 | 1393 | 1436 | 420.2 |
| D | 10 | 154 | 87579 | 205.02 | 1393 | 1436 | 420.2 |
| D | 1 | 5 | 71012 | 165.59 | 1393 | 1436 | 420.2 |
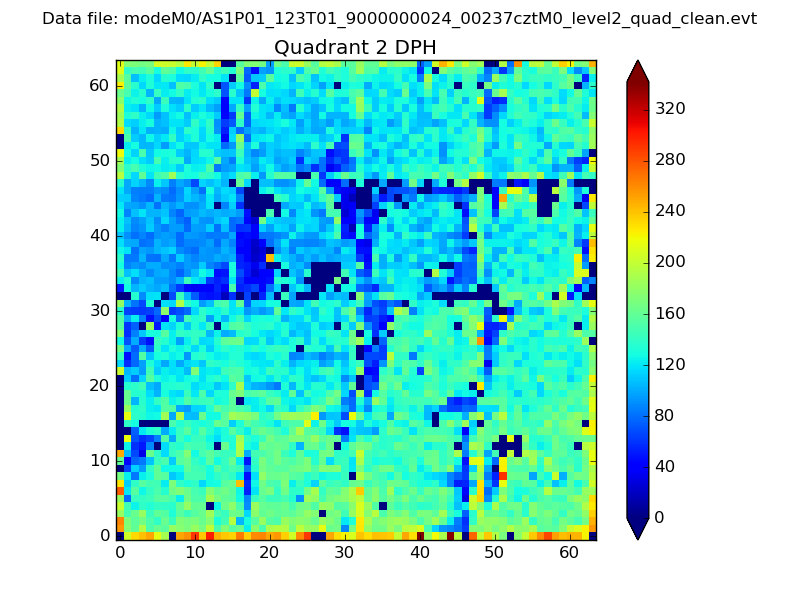
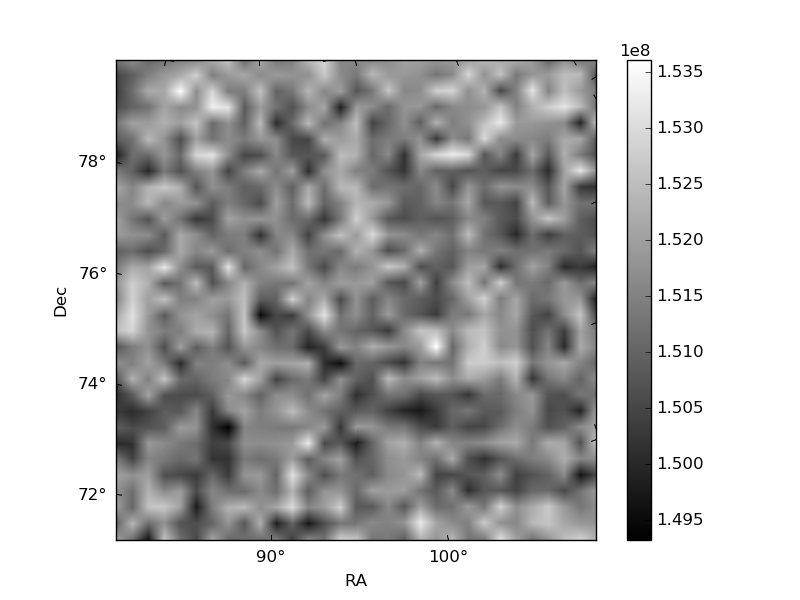
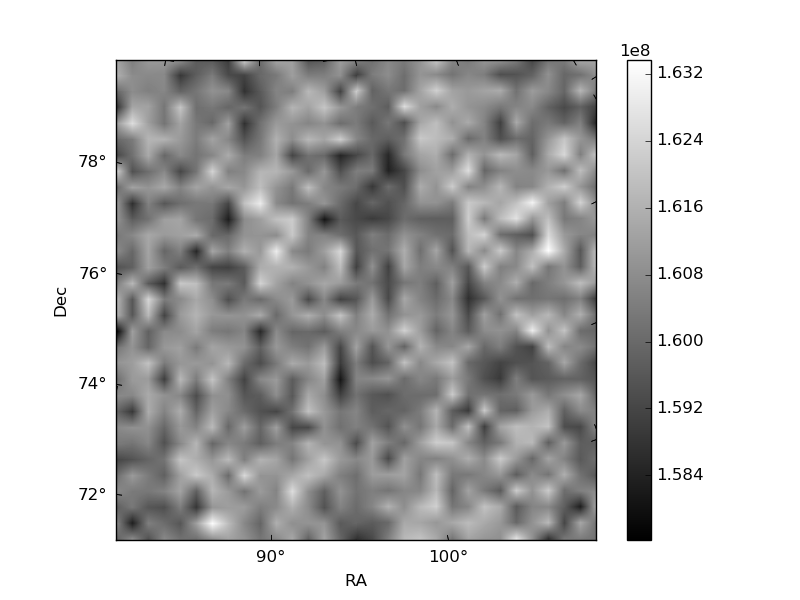
Histogram calculated using DETX and DETY for each event in the final _common_clean file
| Quadrant A | 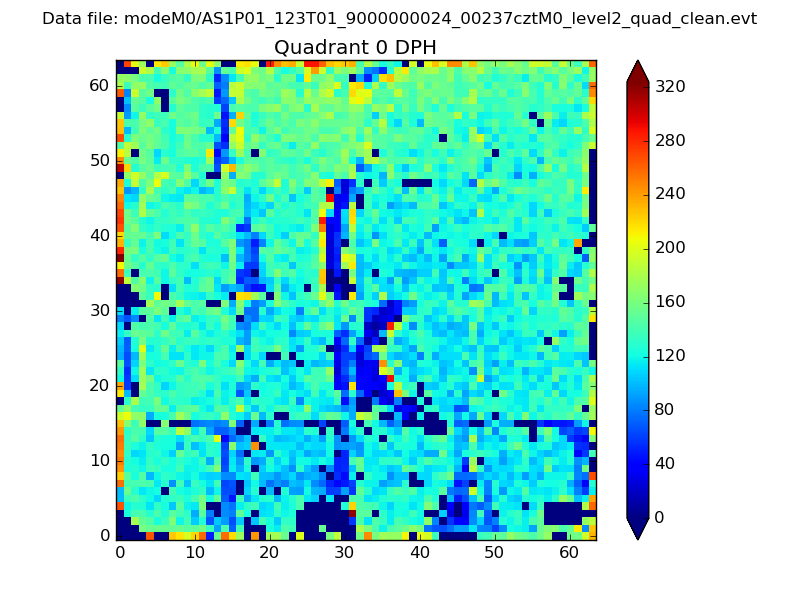 |
 |
Quadrant B |
|---|---|---|---|
| Quadrant D |  |
 |
Quadrant C |
| Plot type | Count rate plots | Images |
|---|---|---|
| Comparison with Poisson distribution Blue bars denote a histogram of data divided into 1 sec bins. Red curve is a Poisson curve with rate = median count rate of data. |
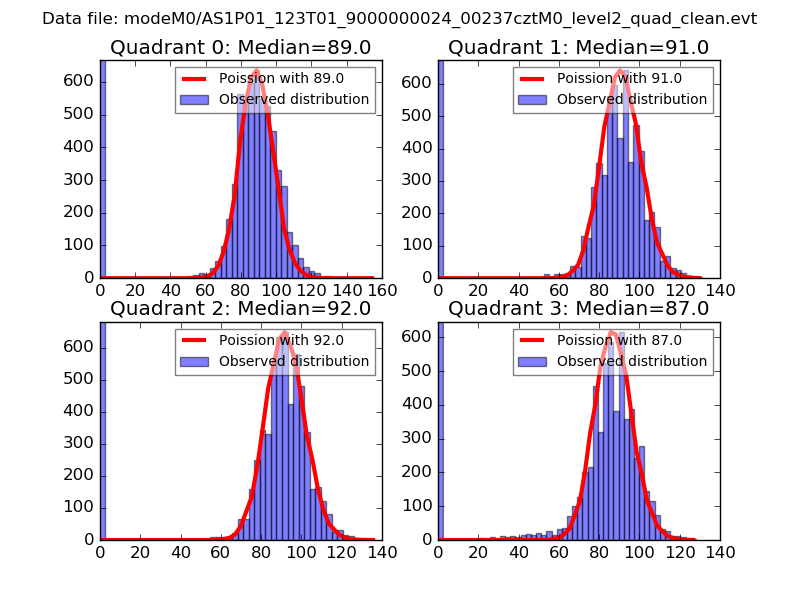 |
 |
| Quadrant-wise count rates Data is divided into 100 sec bins |
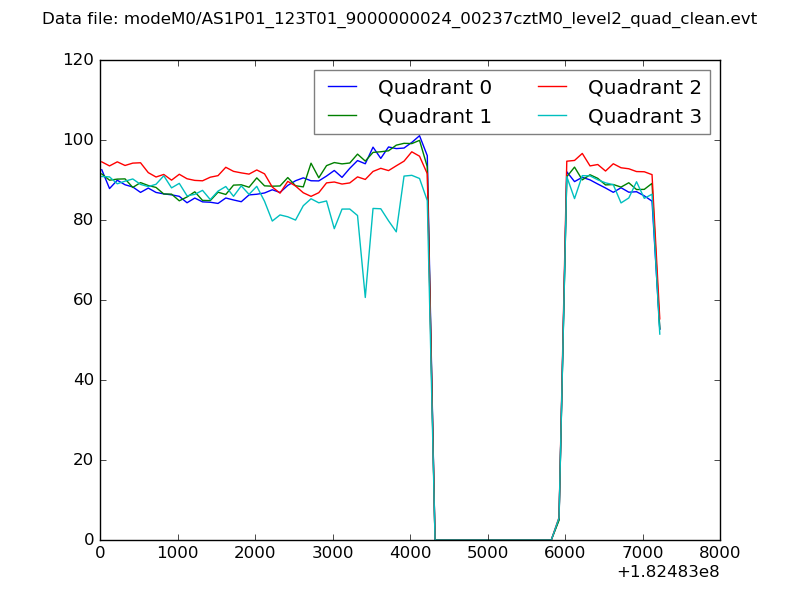 |
|
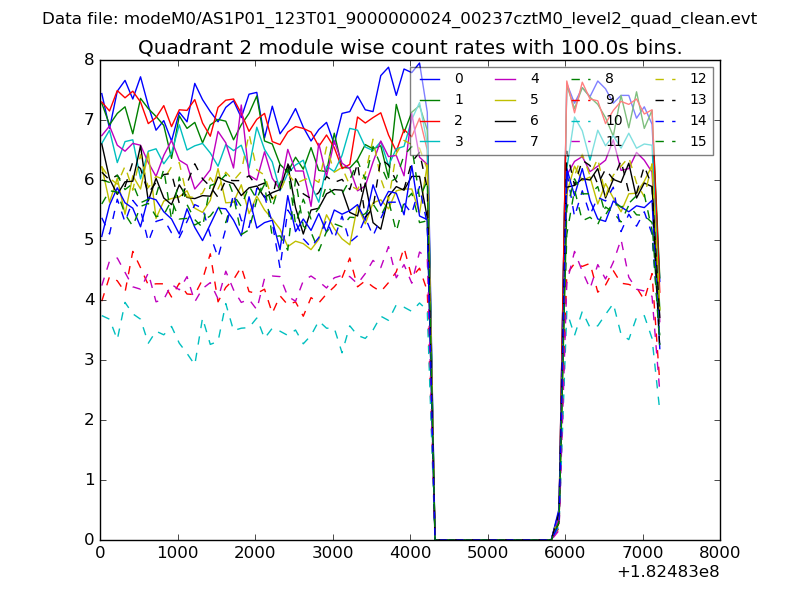
| Module-wise count rates for Quadrant A Data is divided into 100 sec bins |
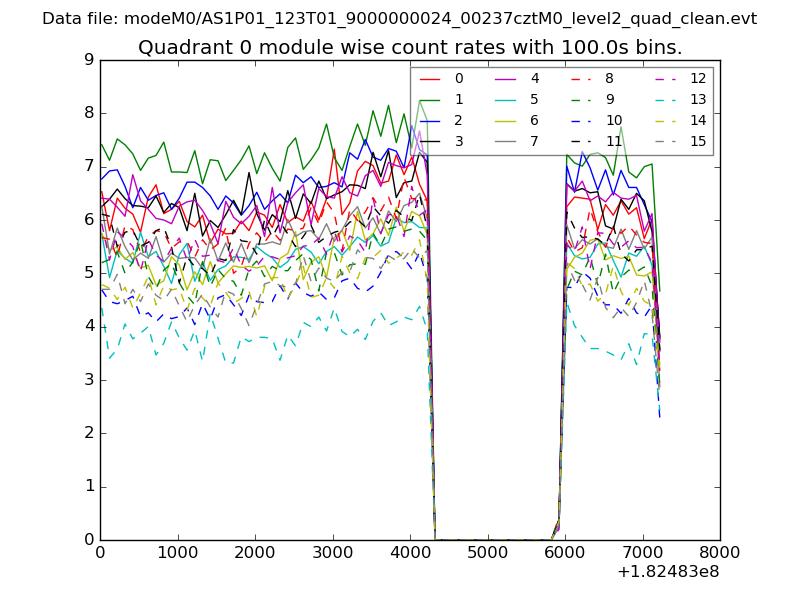 |
 |
| Module-wise count rates for Quadrant B Data is divided into 100 sec bins |
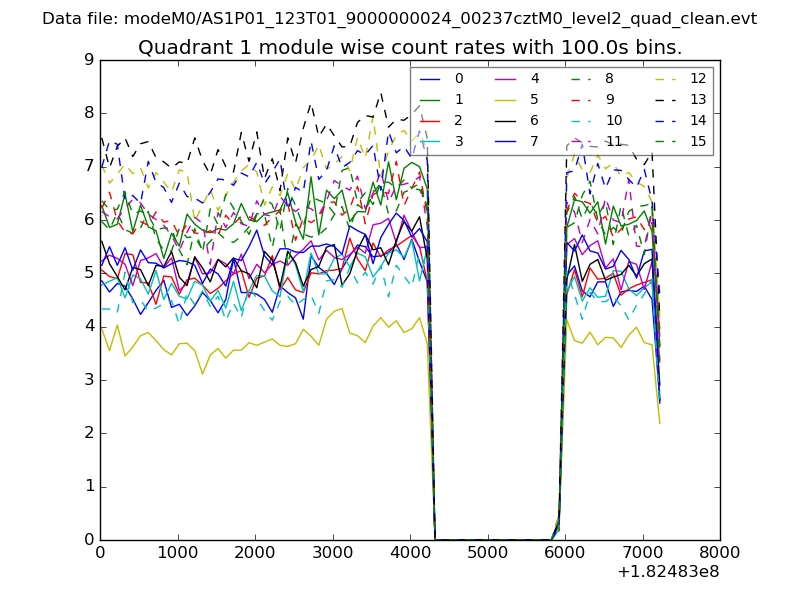 |
 |
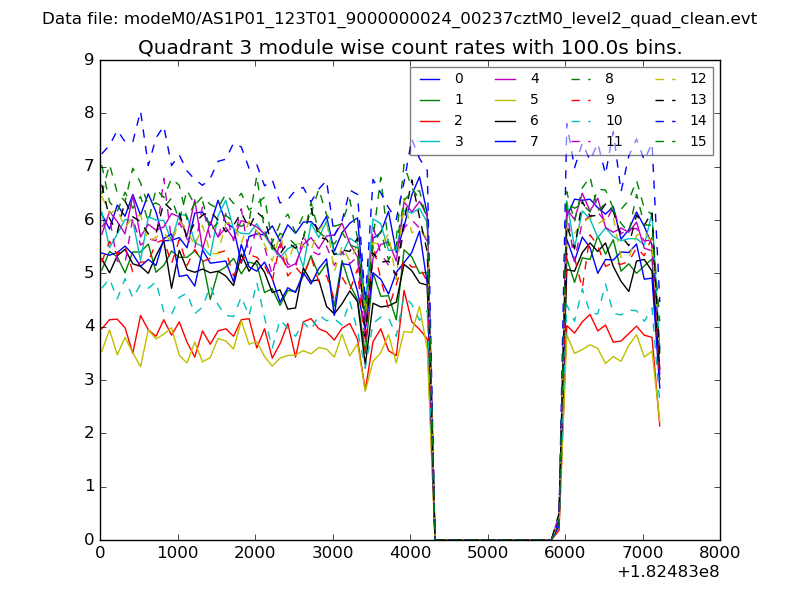
| Module-wise count rates for Quadrant C Data is divided into 100 sec bins |
 |
 |
| Module-wise count rates for Quadrant D Data is divided into 100 sec bins |
 |
 |
| Parameter | Plot |
|---|---|
| CZT HV Monitor | 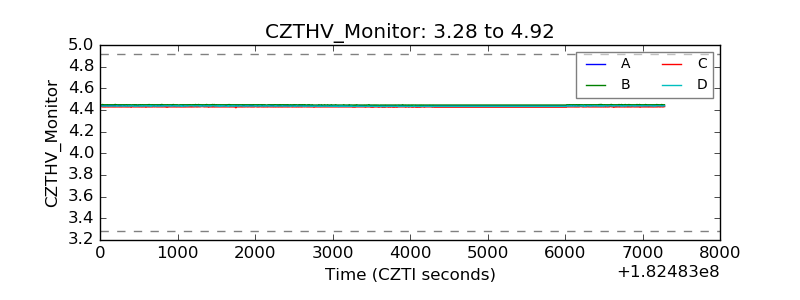 |
| D_VDD | 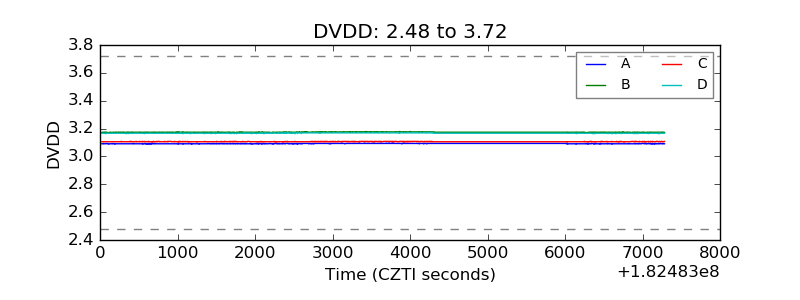 |
| Temperature 1 | 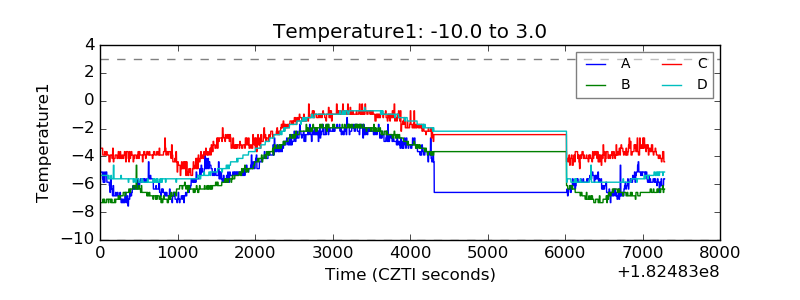 |
| Veto HV Monitor | 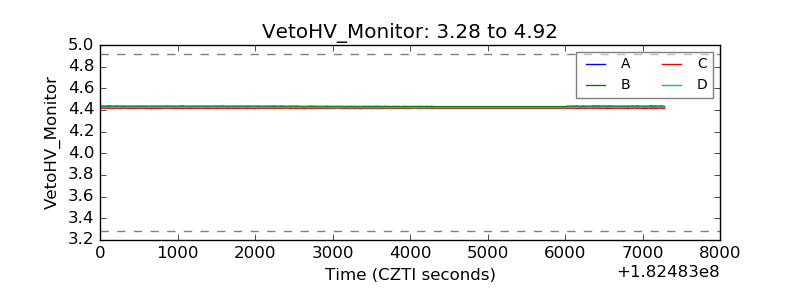 |
| Veto LLD | 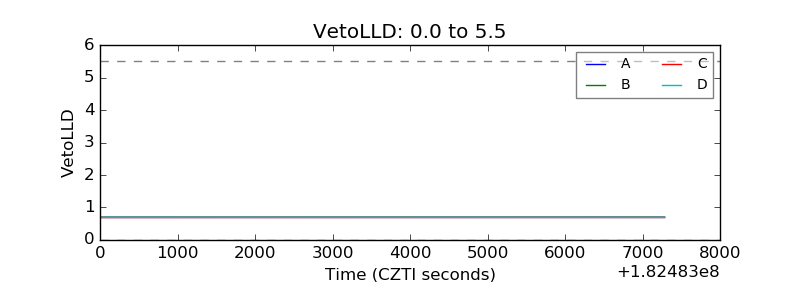 |
| Alpha Counter | 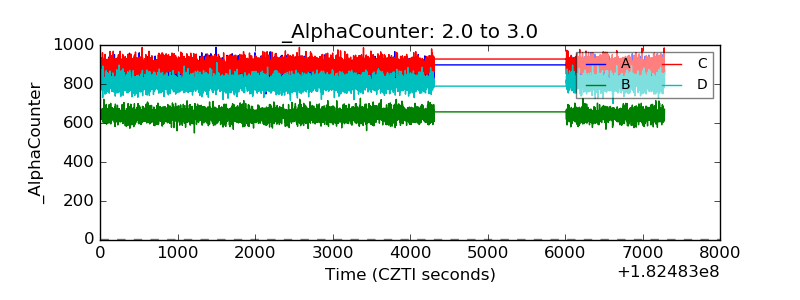 |
| _CPM_Rate | 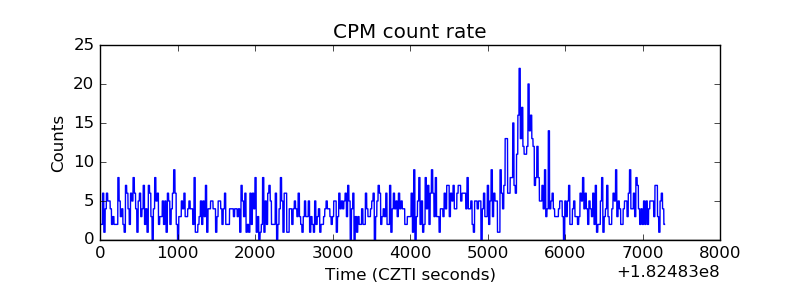 |
| CZT Counter | 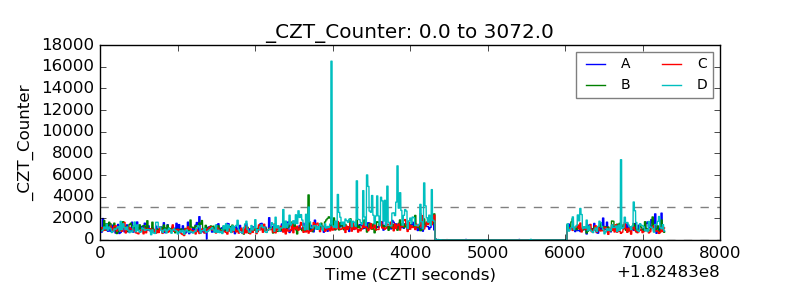 |
| +2.5 Volts monitor |  |
| +5 Volts monitor |  |
| _ROLL_ROT | 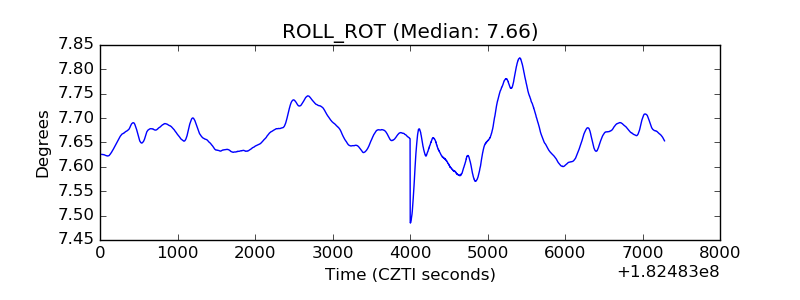 |
| _Roll_DEC | 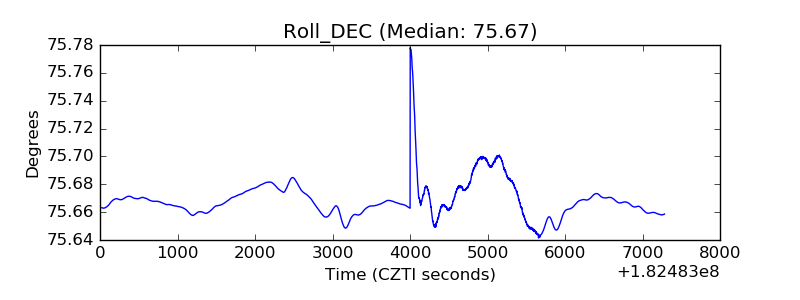 |
| _Roll_RA |  |
| Veto Counter | 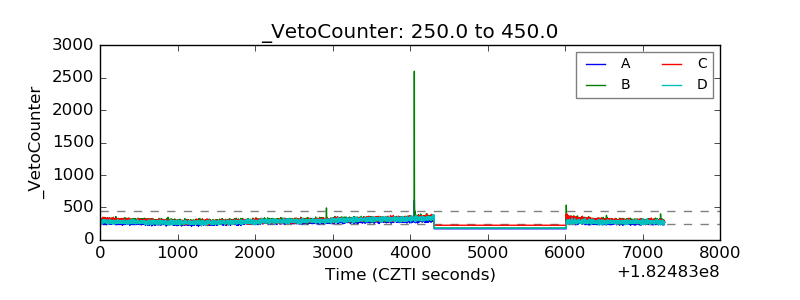 |