| Param | Original file | Final file |
|---|---|---|
| Filename | modeM0/AS1P01_122T01_9000000026_00241cztM0_level2.evt | modeM0/AS1P01_122T01_9000000026_00241cztM0_level2_quad_clean.evt |
| Size (bytes) | 840,792,960 | 46,535,040 |
| Size | 801.8 MB | 44.4 MB |
| Events in quadrant A | 7,045,059 | 261,223 |
| Events in quadrant B | 6,087,625 | 266,508 |
| Events in quadrant C | 5,556,927 | 268,128 |
| Events in quadrant D | 6,440,589 | 260,673 |
| Mode M9 | |||
|---|---|---|---|
| Quadrant | BADHDUFLAG | Total packets | Discarded packets |
| A | 0 | 17 | 0 |
| B | 0 | 17 | 0 |
| C | 0 | 17 | 0 |
| D | 0 | 17 | 0 |
| Mode SS | |||
|---|---|---|---|
| Quadrant | BADHDUFLAG | Total packets | Discarded packets |
| A | 0 | 104 | 4 |
| B | 0 | 104 | 0 |
| C | 0 | 104 | 0 |
| D | 0 | 104 | 0 |
| Mode M0 | |||
|---|---|---|---|
| Quadrant | BADHDUFLAG | Total packets | Discarded packets |
| A | 0 | 24796 | 335 |
| B | 0 | 21968 | 332 |
| C | 0 | 20342 | 281 |
| D | 0 | 23056 | 344 |
| Quadrant | Total seconds | Saturated seconds | Saturation percentage |
|---|---|---|---|
| A | 5017 | 105 | 2.092884% |
| B | 5015 | 23 | 0.458624% |
| C | 5026 | 1 | 0.019897% |
| D | 5017 | 45 | 0.896950% |
Noise dominated data is calculated using 1-second bins in cleaned event files. If a bin has >2000 counts, and if more than 50% of those come from <1% of pixels, then it is considered to be noise-dominated and hence unusable.
| Quadrant | # 1 sec bins | Bins with >0 counts | Bins with >2000 counts | High rate bins dominated by noise | Noise dominated (total time) | Noise dominated (detector-on time) | Marked lightcurve |
|---|---|---|---|---|---|---|---|
| A | 6754 | 5033 | 552 | 552 | 8.17% | 10.97% | 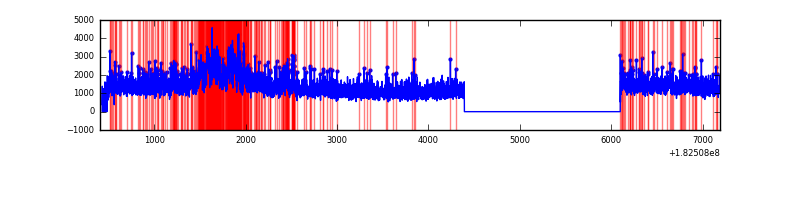 |
| B | 6751 | 5034 | 112 | 112 | 1.66% | 2.22% | 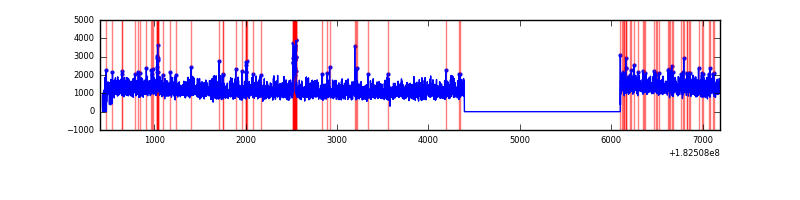 |
| C | 6779 | 5045 | 51 | 51 | 0.75% | 1.01% | 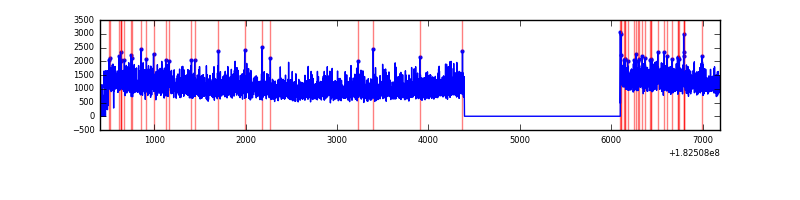 |
| D | 6757 | 5034 | 249 | 249 | 3.69% | 4.95% | 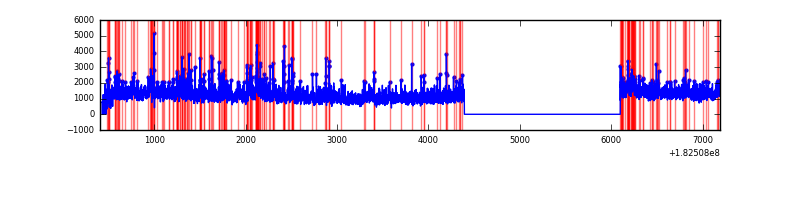 |
Top three noisy pixels from each quadrant. If the there are fewer than three noisy pixels in the level2.evt file, extra rows are filled as -1
| Pixel properties | Quadrant properties | ||||||
|---|---|---|---|---|---|---|---|
| Quadrant | DetID | PixID | Counts | Sigma | Mean | Median | Sigma |
| A | 15 | 127 | 982431 | 2822.62 | 1564 | 1552 | 347.5 |
| A | 15 | 250 | 8934 | 21.24 | 1564 | 1552 | 347.5 |
| A | 13 | 17 | 5394 | 11.05 | 1564 | 1552 | 347.5 |
| B | 10 | 244 | 68601 | 183.08 | 1555 | 1568 | 366.1 |
| B | 8 | 54 | 26435 | 67.92 | 1555 | 1568 | 366.1 |
| B | 15 | 219 | 22424 | 56.96 | 1555 | 1568 | 366.1 |
| C | 9 | 51 | 30374 | 73.97 | 1393 | 1443 | 391.1 |
| C | 1 | 1 | 21561 | 51.44 | 1393 | 1443 | 391.1 |
| C | 9 | 35 | 19802 | 46.94 | 1393 | 1443 | 391.1 |
| D | 1 | 4 | 653635 | 1538.5 | 1347 | 1399 | 423.9 |
| D | 10 | 154 | 367902 | 864.51 | 1347 | 1399 | 423.9 |
| D | 12 | 7 | 137600 | 321.27 | 1347 | 1399 | 423.9 |
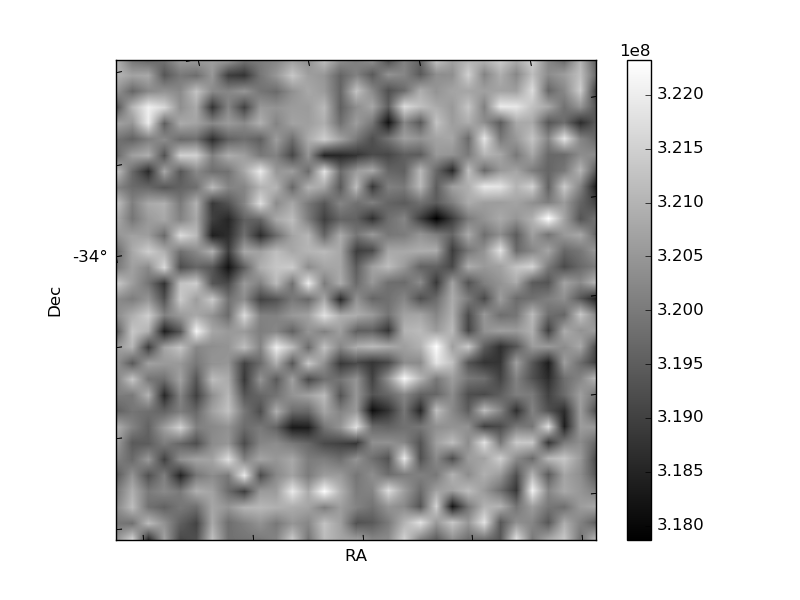
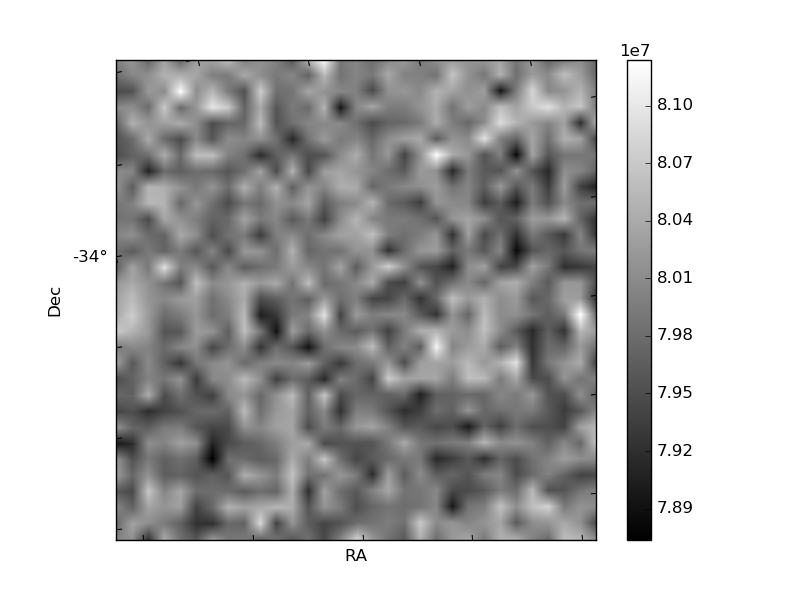
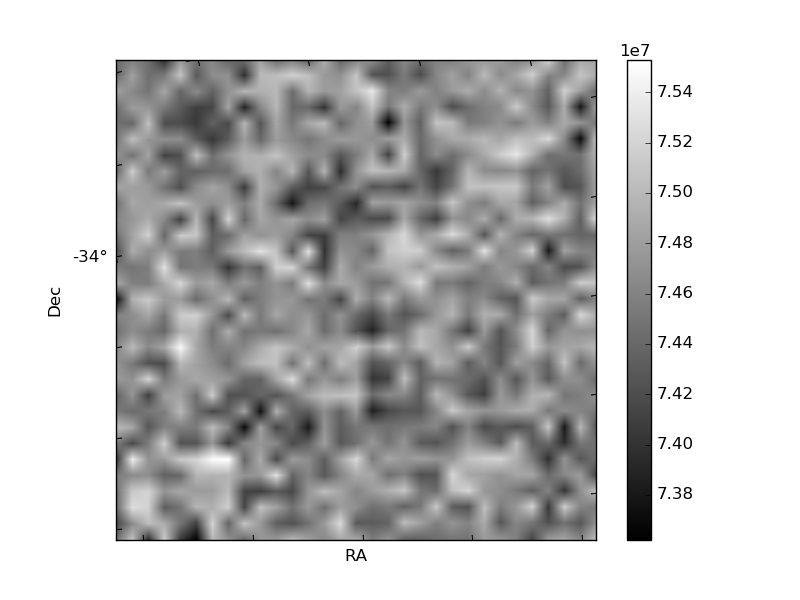
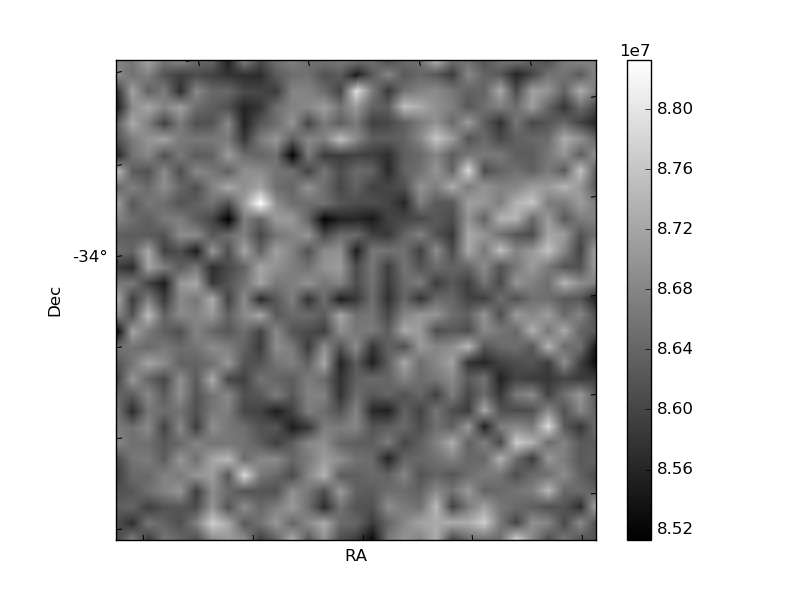
Histogram calculated using DETX and DETY for each event in the final _common_clean file
| Quadrant A | 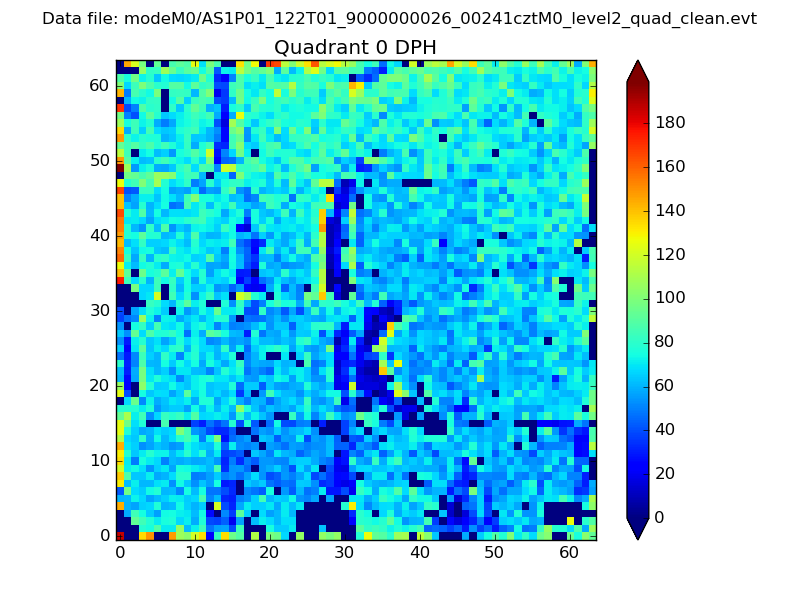 |
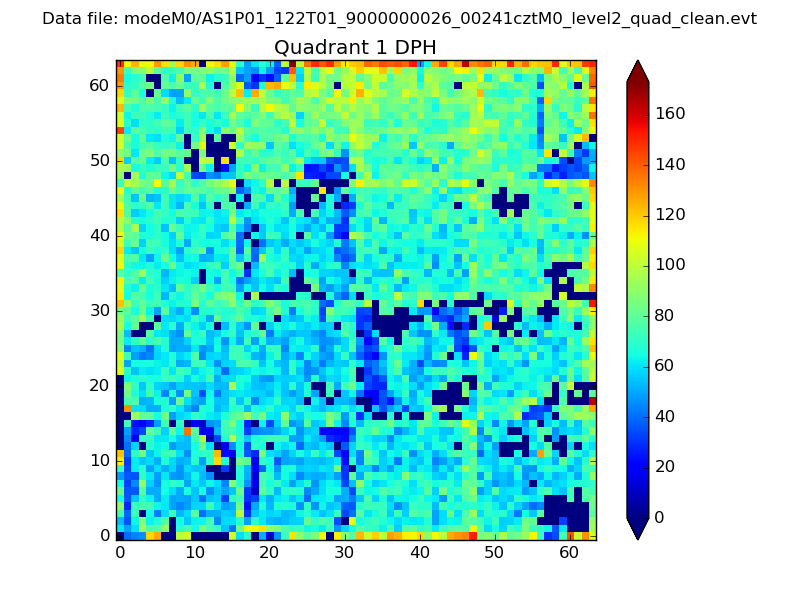 |
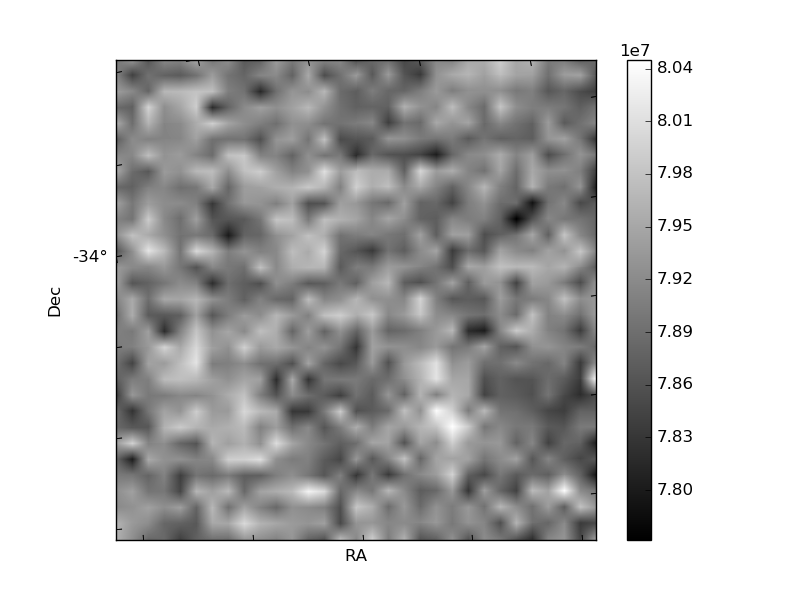
Quadrant B |
|---|---|---|---|
| Quadrant D | 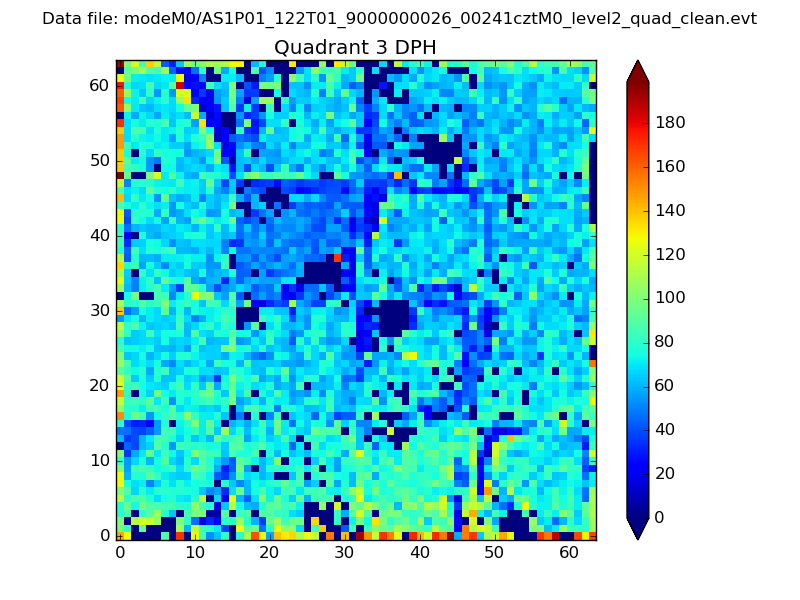 |
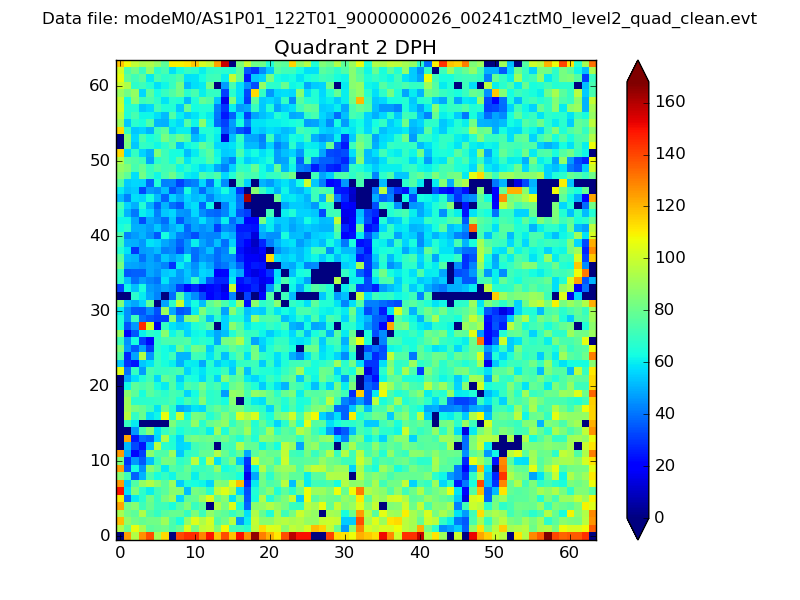 |
Quadrant C |
| Plot type | Count rate plots | Images |
|---|---|---|
| Comparison with Poisson distribution Blue bars denote a histogram of data divided into 1 sec bins. Red curve is a Poisson curve with rate = median count rate of data. |
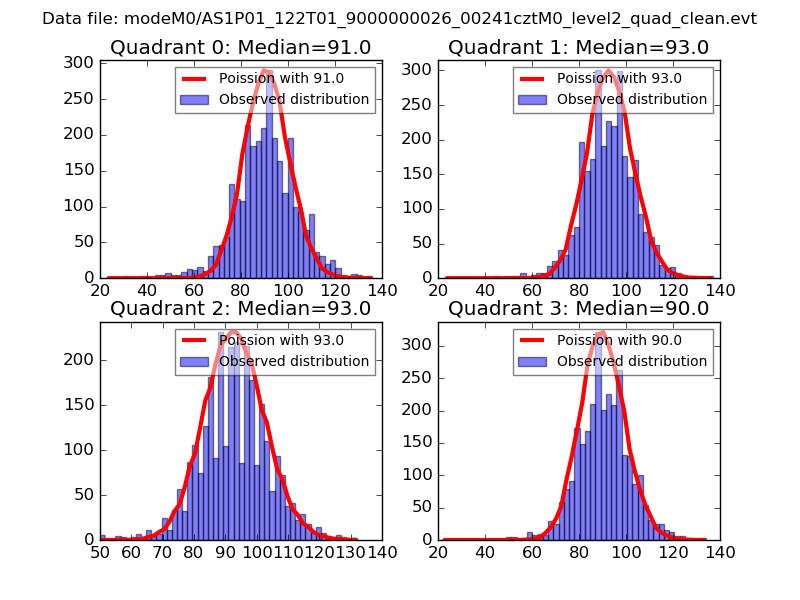 |
 |
| Quadrant-wise count rates Data is divided into 100 sec bins |
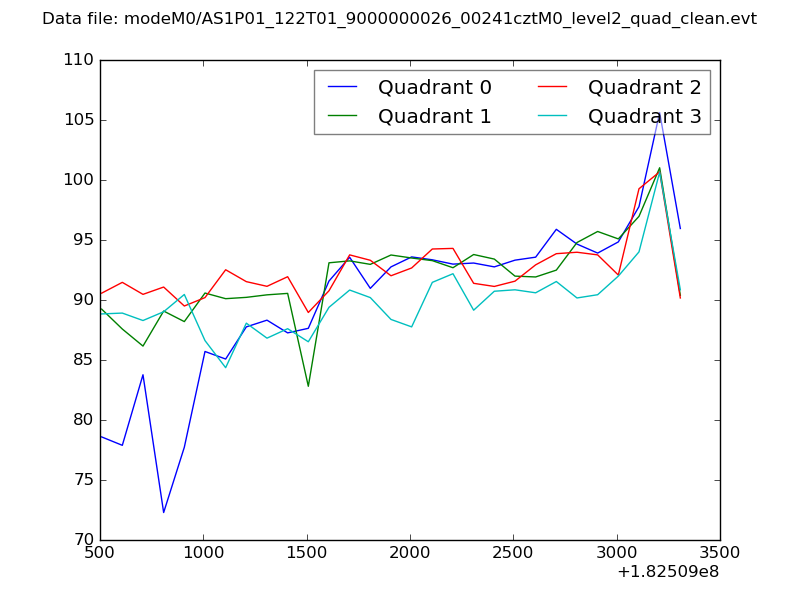 |
|
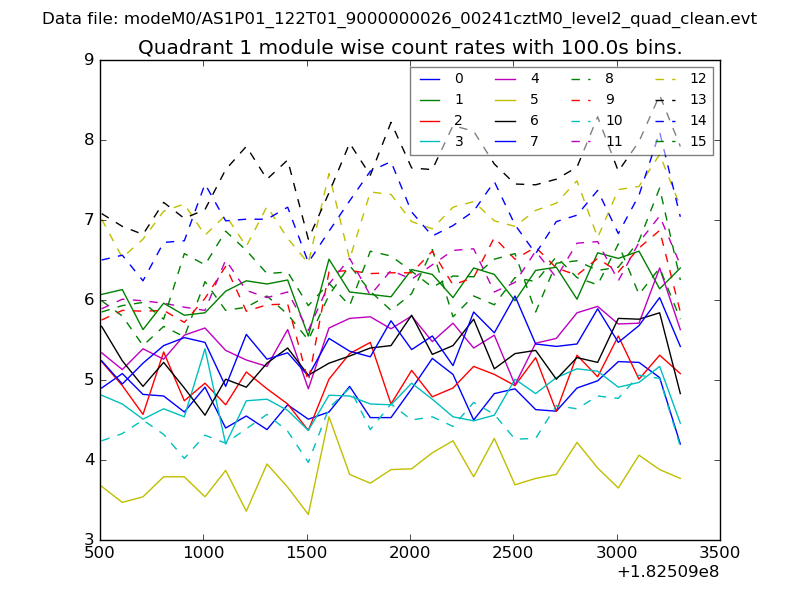
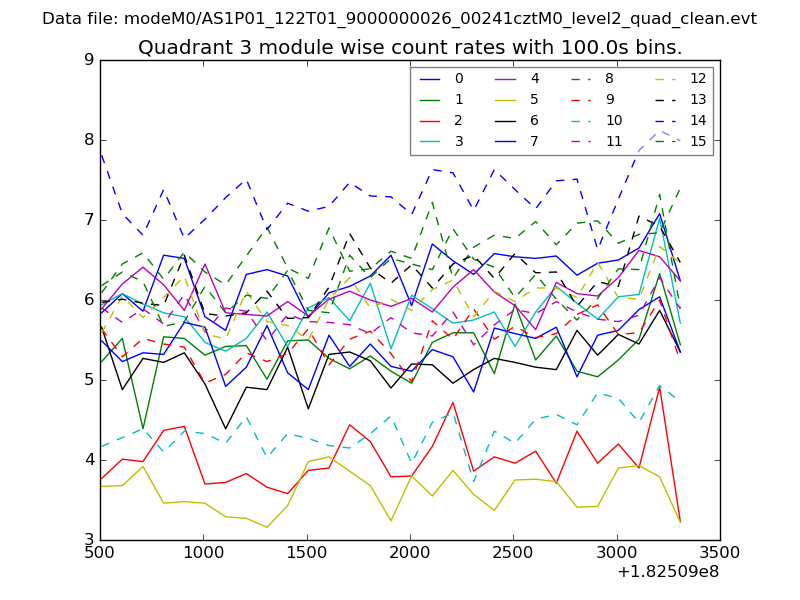
| Module-wise count rates for Quadrant A Data is divided into 100 sec bins |
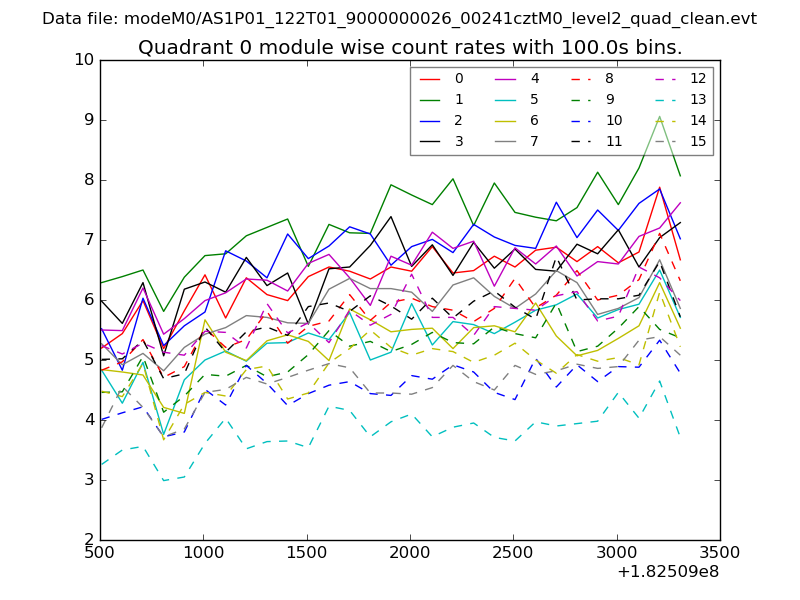 |
 |
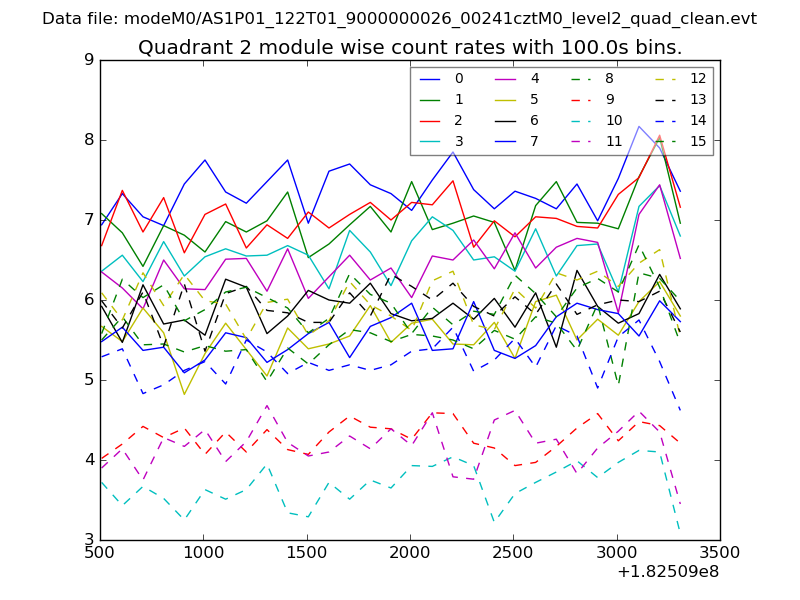
| Module-wise count rates for Quadrant B Data is divided into 100 sec bins |
 |
 |
| Module-wise count rates for Quadrant C Data is divided into 100 sec bins |
 |
 |
| Module-wise count rates for Quadrant D Data is divided into 100 sec bins |
 |
 |
| Parameter | Plot |
|---|---|
| CZT HV Monitor | 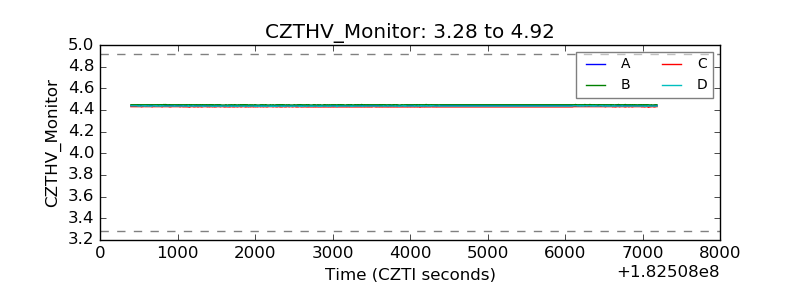 |
| D_VDD | 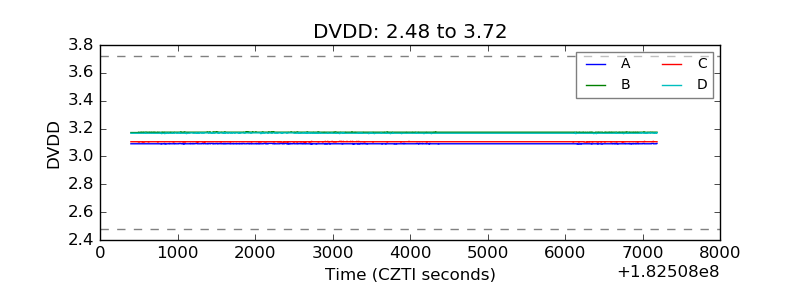 |
| Temperature 1 | 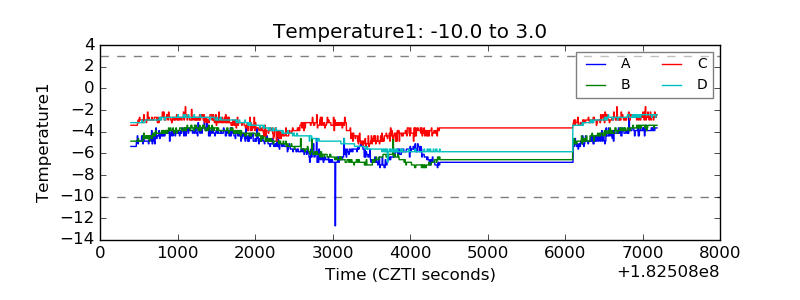 |
| Veto HV Monitor | 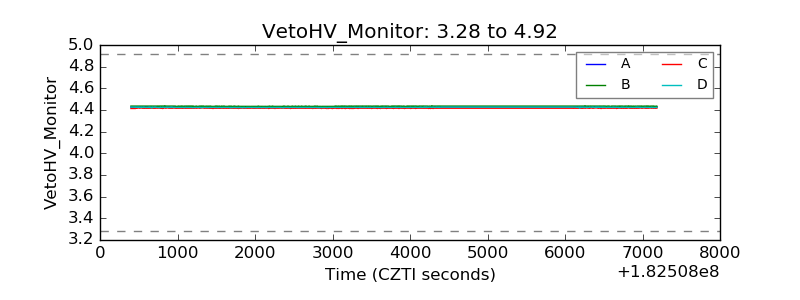 |
| Veto LLD | 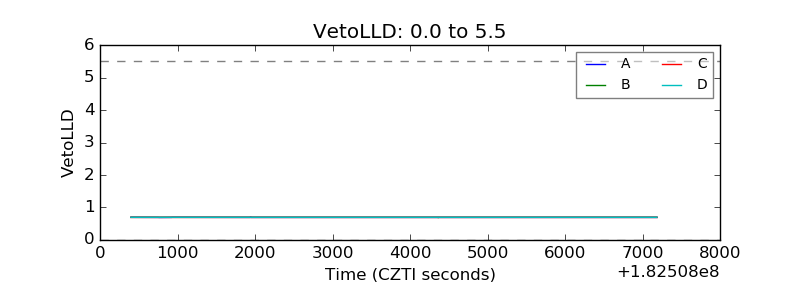 |
| Alpha Counter | 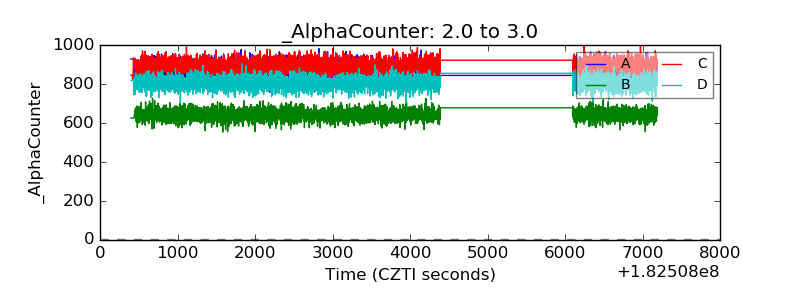 |
| _CPM_Rate | 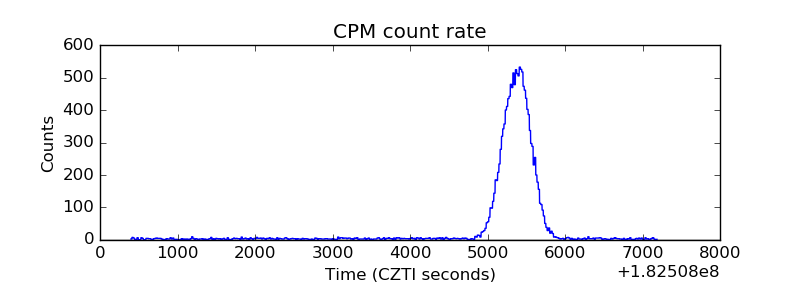 |
| CZT Counter | 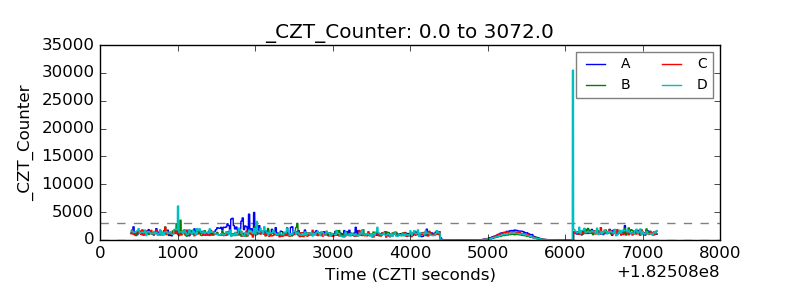 |
| +2.5 Volts monitor |  |
| +5 Volts monitor |  |
| _ROLL_ROT | 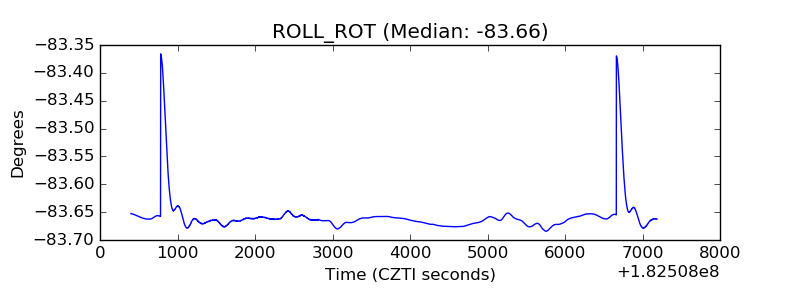 |
| _Roll_DEC | 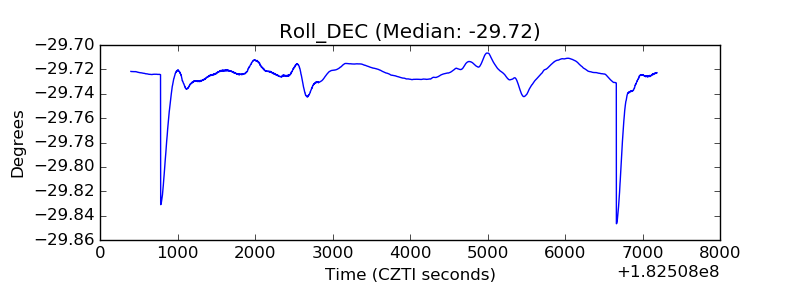 |
| _Roll_RA | 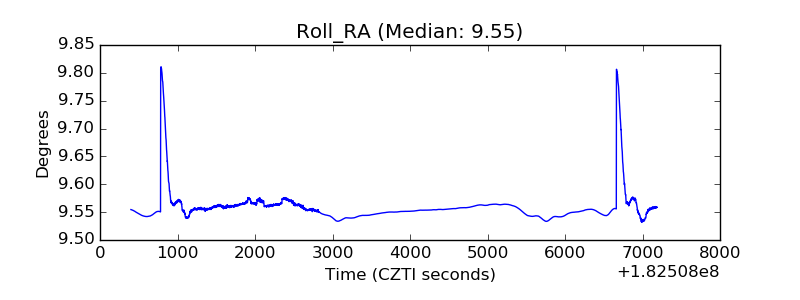 |
| Veto Counter | 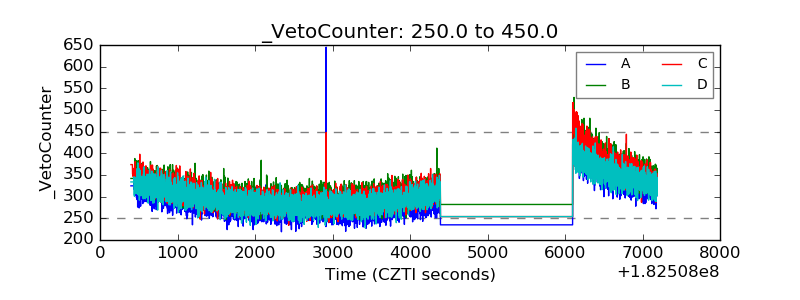 |