| Param | Original file | Final file |
|---|---|---|
| Filename | modeM0/AS1P01_122T01_9000000026_00245cztM0_level2.evt | modeM0/AS1P01_122T01_9000000026_00245cztM0_level2_quad_clean.evt |
| Size (bytes) | 830,787,840 | 74,845,440 |
| Size | 792.3 MB | 71.4 MB |
| Events in quadrant A | 6,055,684 | 481,333 |
| Events in quadrant B | 6,482,537 | 487,372 |
| Events in quadrant C | 5,469,396 | 480,948 |
| Events in quadrant D | 6,804,883 | 450,257 |
| Mode M9 | |||
|---|---|---|---|
| Quadrant | BADHDUFLAG | Total packets | Discarded packets |
| A | 0 | 17 | 0 |
| B | 0 | 17 | 0 |
| C | 0 | 17 | 0 |
| D | 0 | 17 | 0 |
| Mode SS | |||
|---|---|---|---|
| Quadrant | BADHDUFLAG | Total packets | Discarded packets |
| A | 0 | 106 | 0 |
| B | 0 | 106 | 0 |
| C | 0 | 106 | 0 |
| D | 0 | 106 | 0 |
| Mode M0 | |||
|---|---|---|---|
| Quadrant | BADHDUFLAG | Total packets | Discarded packets |
| A | 0 | 21735 | 2 |
| B | 0 | 22973 | 1 |
| C | 0 | 19963 | 1 |
| D | 0 | 23940 | 1 |
| Quadrant | Total seconds | Saturated seconds | Saturation percentage |
|---|---|---|---|
| A | 5232 | 3 | 0.057339% |
| B | 5232 | 70 | 1.337920% |
| C | 5232 | 11 | 0.210245% |
| D | 5232 | 140 | 2.675841% |
Noise dominated data is calculated using 1-second bins in cleaned event files. If a bin has >2000 counts, and if more than 50% of those come from <1% of pixels, then it is considered to be noise-dominated and hence unusable.
| Quadrant | # 1 sec bins | Bins with >0 counts | Bins with >2000 counts | High rate bins dominated by noise | Noise dominated (total time) | Noise dominated (detector-on time) | Marked lightcurve |
|---|---|---|---|---|---|---|---|
| A | 6937 | 5233 | 112 | 112 | 1.61% | 2.14% | 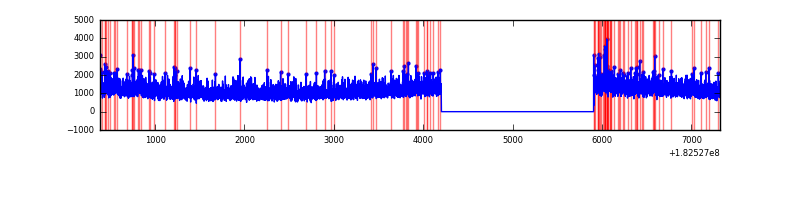 |
| B | 6937 | 5233 | 227 | 227 | 3.27% | 4.34% | 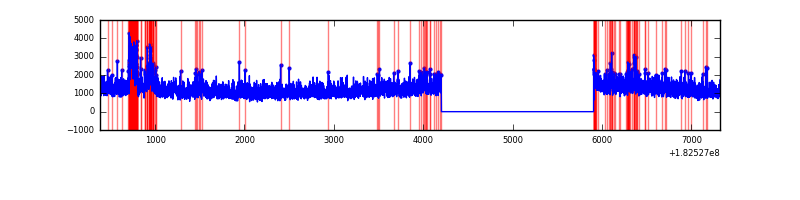 |
| C | 6937 | 5233 | 52 | 52 | 0.75% | 0.99% | 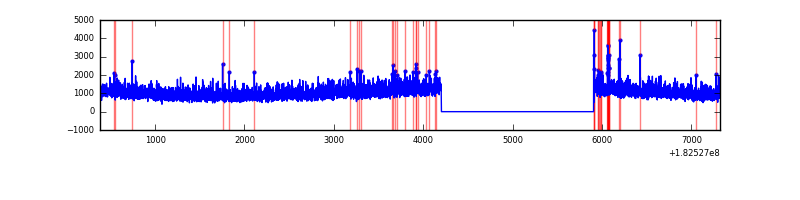 |
| D | 6937 | 5233 | 451 | 451 | 6.50% | 8.62% | 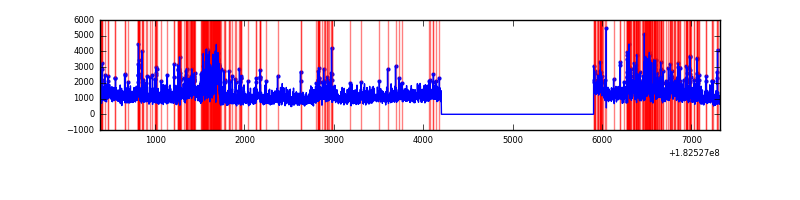 |
Top three noisy pixels from each quadrant. If the there are fewer than three noisy pixels in the level2.evt file, extra rows are filled as -1
| Pixel properties | Quadrant properties | ||||||
|---|---|---|---|---|---|---|---|
| Quadrant | DetID | PixID | Counts | Sigma | Mean | Median | Sigma |
| A | 15 | 250 | 24382 | 65.27 | 1545 | 1531 | 350.1 |
| A | 15 | 31 | 20599 | 54.46 | 1545 | 1531 | 350.1 |
| A | 13 | 17 | 14540 | 37.16 | 1545 | 1531 | 350.1 |
| B | 2 | 32 | 407868 | 1125.84 | 1548 | 1563 | 360.9 |
| B | 0 | 214 | 99343 | 270.94 | 1548 | 1563 | 360.9 |
| B | 10 | 14 | 35663 | 94.49 | 1548 | 1563 | 360.9 |
| C | 12 | 204 | 42281 | 107.56 | 1375 | 1423 | 379.9 |
| C | 9 | 206 | 7222 | 15.27 | 1375 | 1423 | 379.9 |
| C | 1 | 1 | 6780 | 14.1 | 1375 | 1423 | 379.9 |
| D | 1 | 4 | 963523 | 2367.92 | 1296 | 1346 | 406.3 |
| D | 2 | 63 | 362084 | 887.78 | 1296 | 1346 | 406.3 |
| D | 10 | 154 | 334489 | 819.87 | 1296 | 1346 | 406.3 |
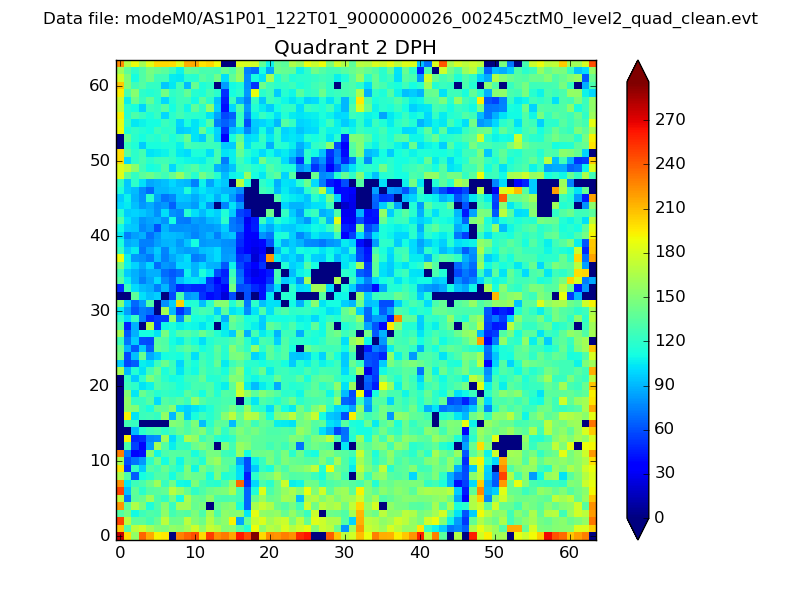
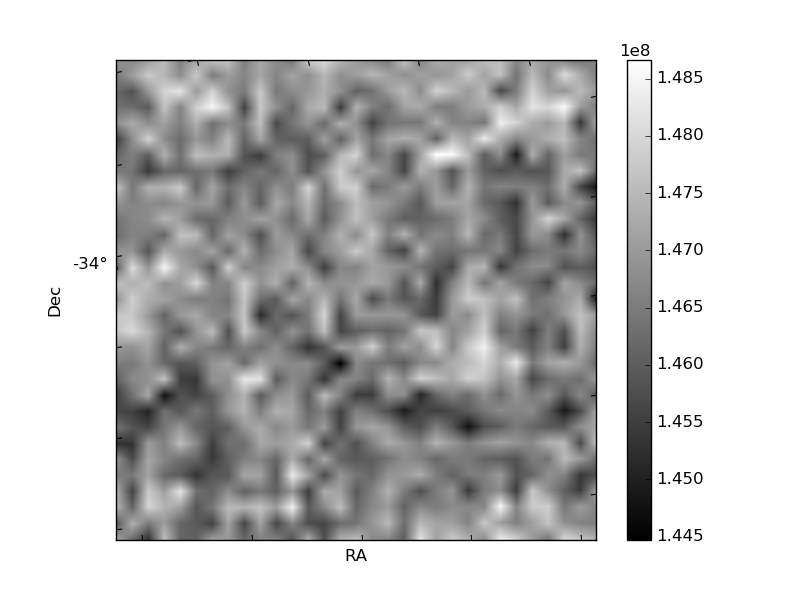
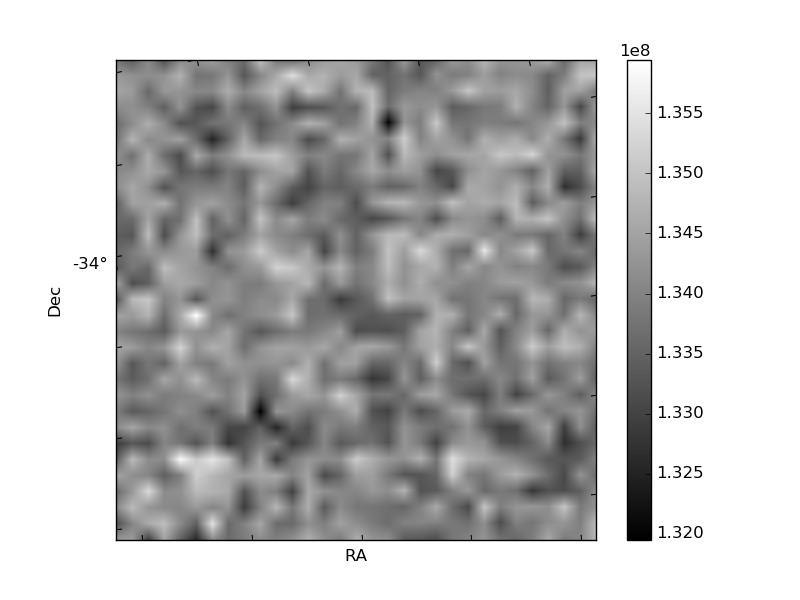
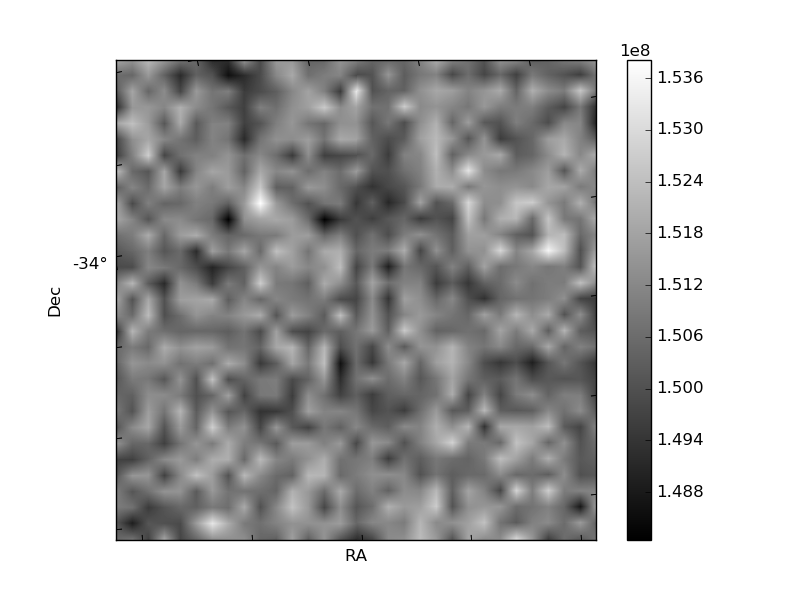
Histogram calculated using DETX and DETY for each event in the final _common_clean file
| Quadrant A | 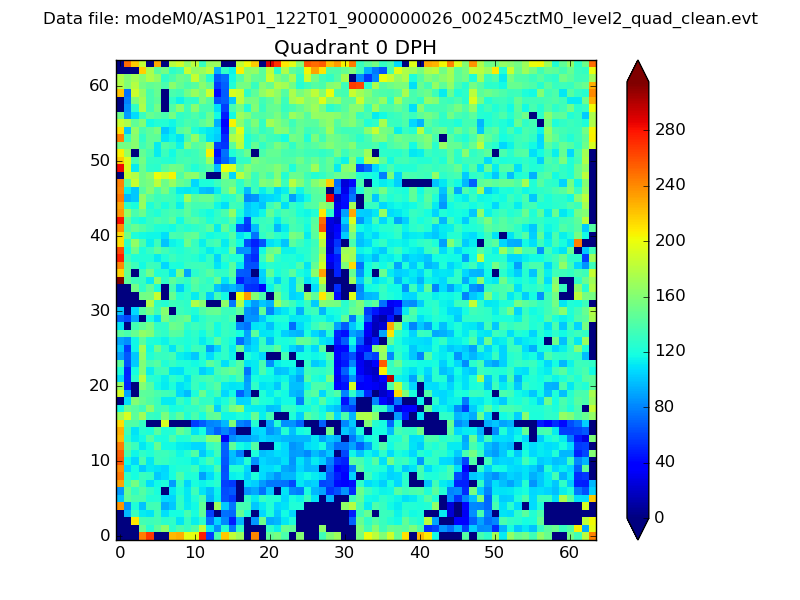 |
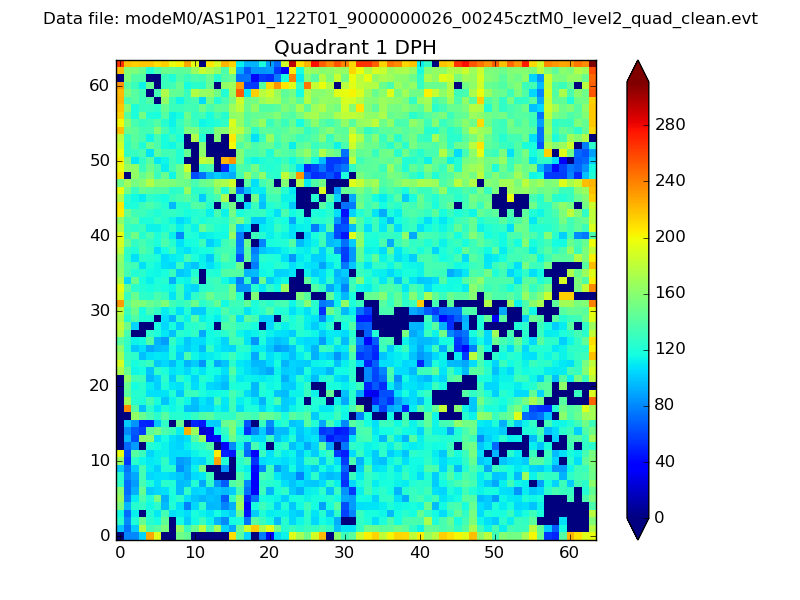 |
Quadrant B |
|---|---|---|---|
| Quadrant D | 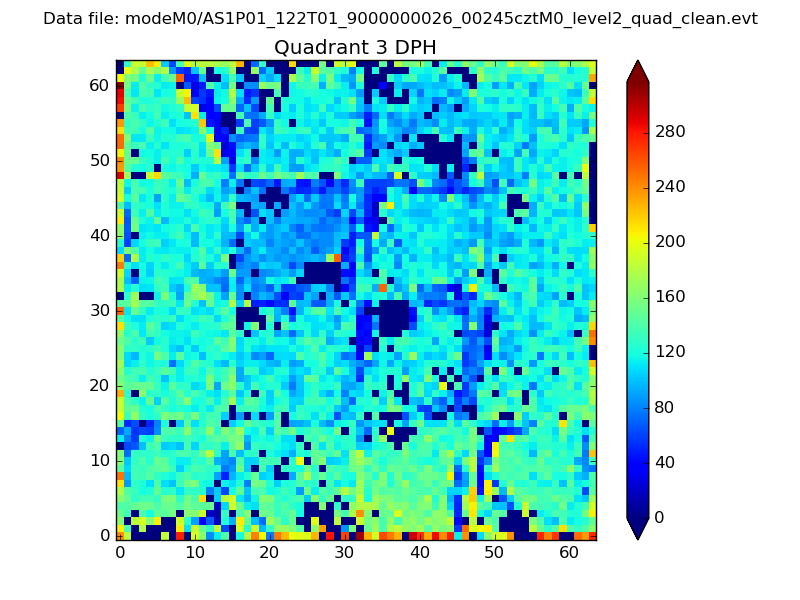 |
 |
Quadrant C |
| Plot type | Count rate plots | Images |
|---|---|---|
| Comparison with Poisson distribution Blue bars denote a histogram of data divided into 1 sec bins. Red curve is a Poisson curve with rate = median count rate of data. |
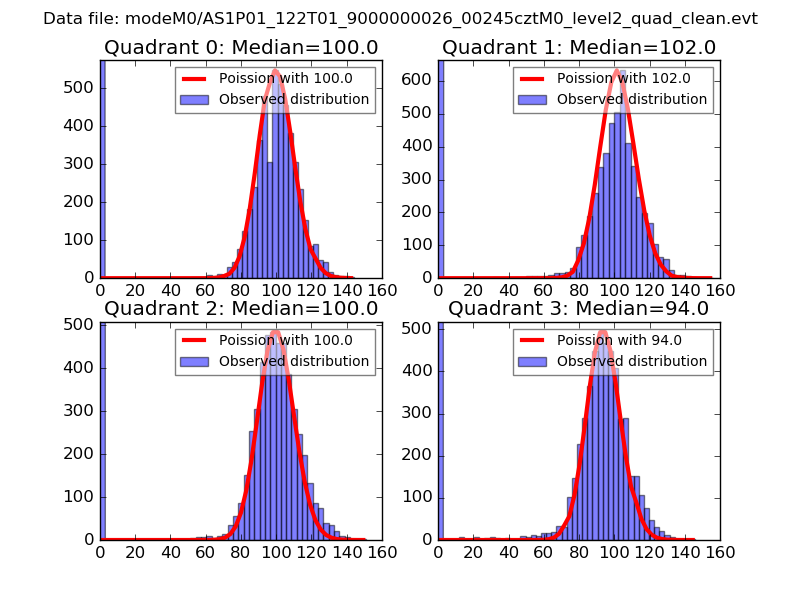 |
 |
| Quadrant-wise count rates Data is divided into 100 sec bins |
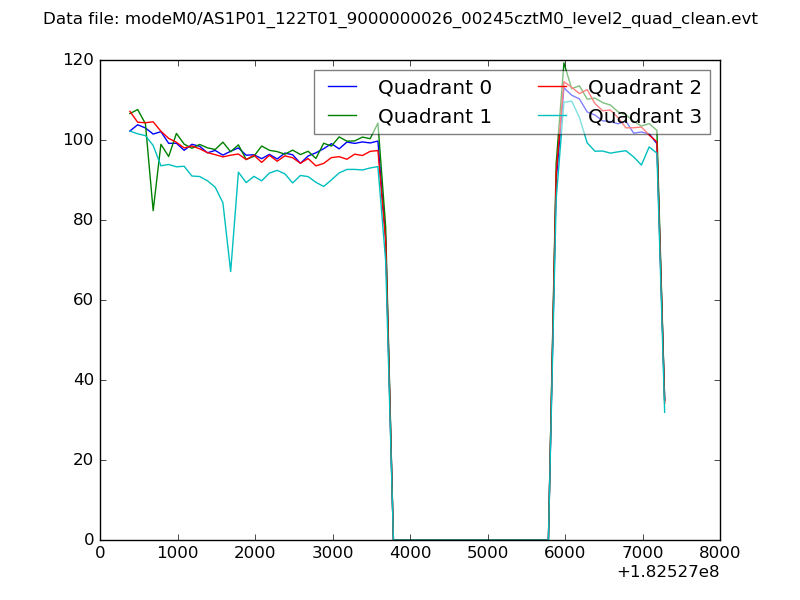 |
|
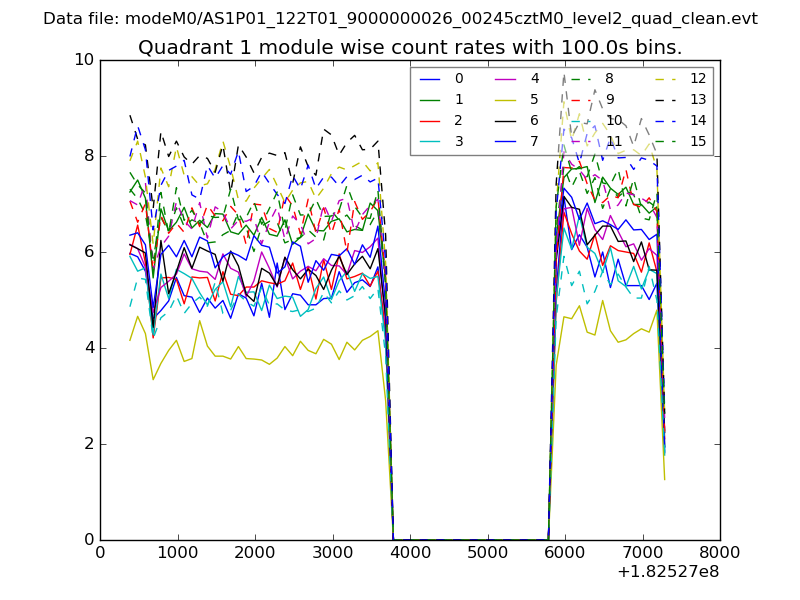
| Module-wise count rates for Quadrant A Data is divided into 100 sec bins |
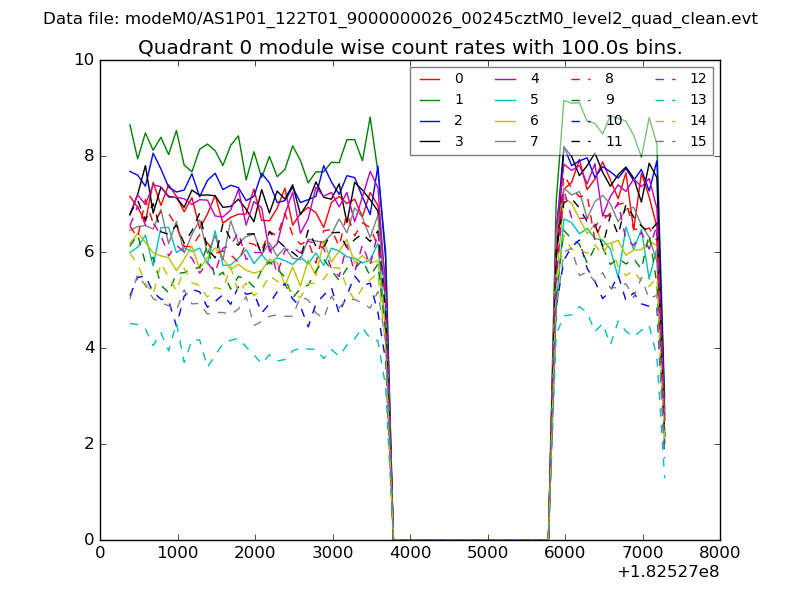 |
 |
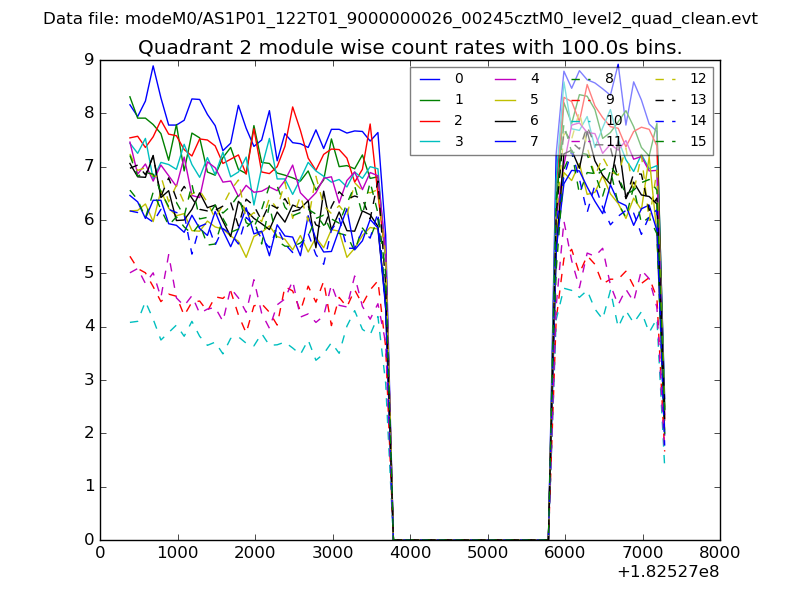
| Module-wise count rates for Quadrant B Data is divided into 100 sec bins |
 |
 |
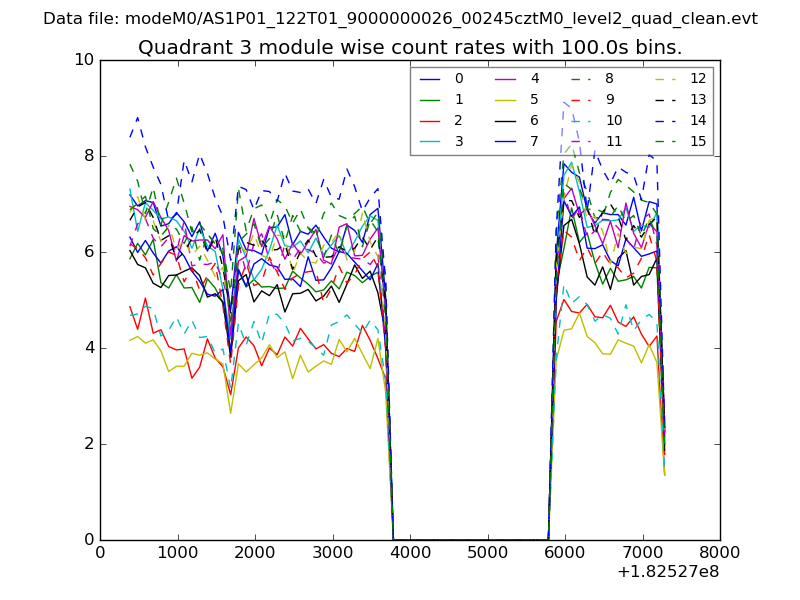
| Module-wise count rates for Quadrant C Data is divided into 100 sec bins |
 |
 |
| Module-wise count rates for Quadrant D Data is divided into 100 sec bins |
 |
 |
| Parameter | Plot |
|---|---|
| CZT HV Monitor | 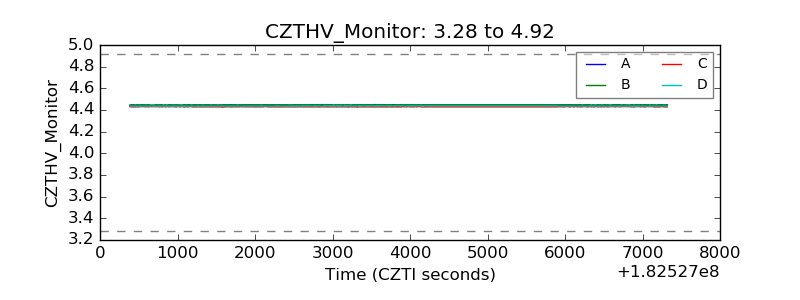 |
| D_VDD | 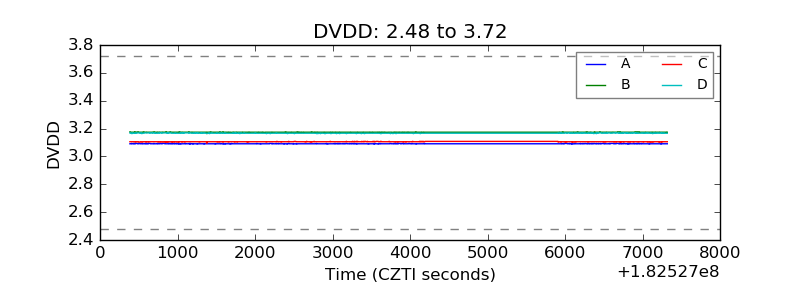 |
| Temperature 1 | 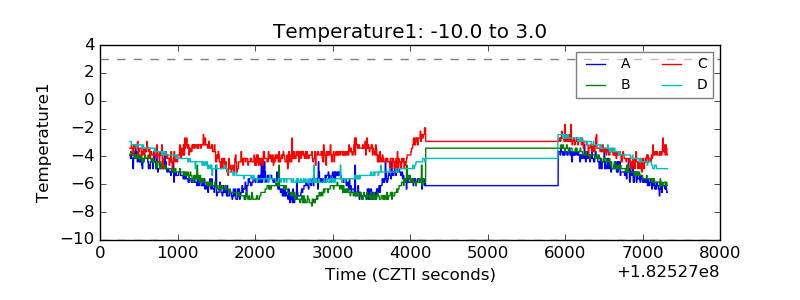 |
| Veto HV Monitor |  |
| Veto LLD | 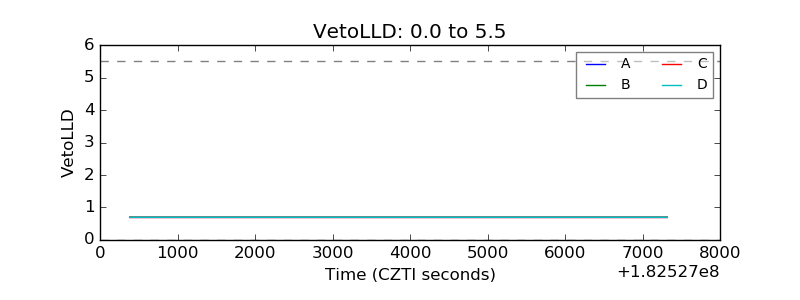 |
| Alpha Counter | 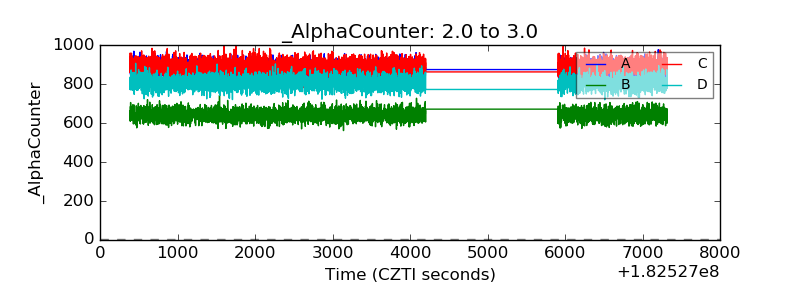 |
| _CPM_Rate | 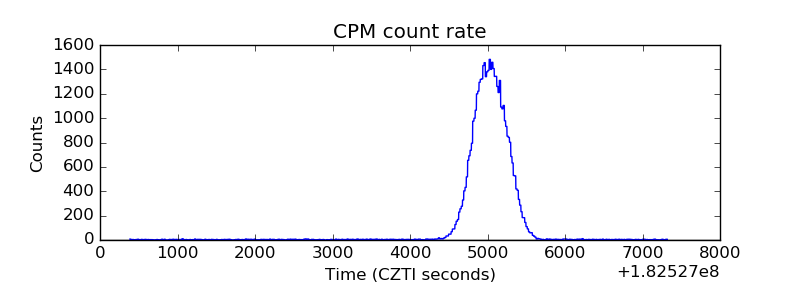 |
| CZT Counter | 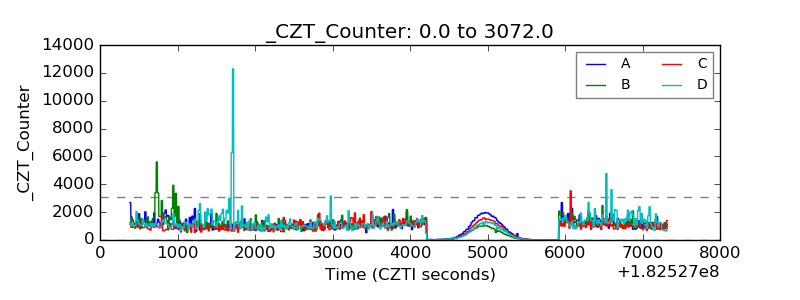 |
| +2.5 Volts monitor |  |
| +5 Volts monitor |  |
| _ROLL_ROT | 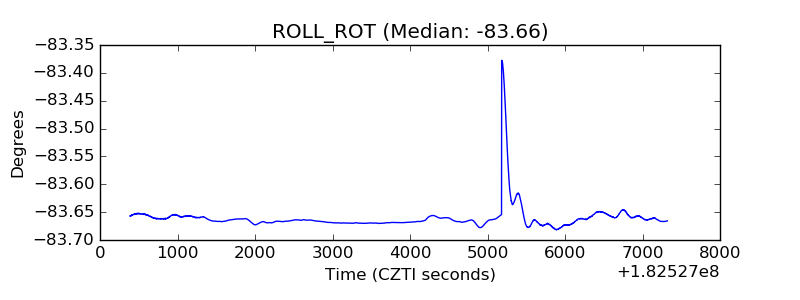 |
| _Roll_DEC | 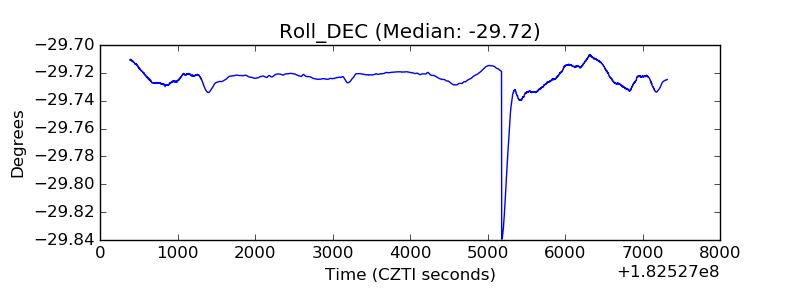 |
| _Roll_RA |  |
| Veto Counter | 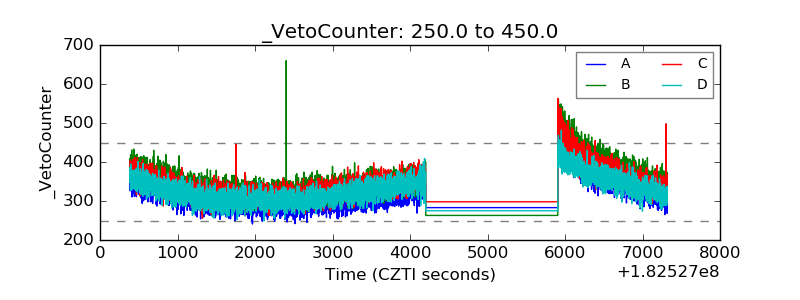 |