| Param | Original file | Final file |
|---|---|---|
| Filename | modeM0/AS1P01_122T01_9000000026_00248cztM0_level2.evt | modeM0/AS1P01_122T01_9000000026_00248cztM0_level2_quad_clean.evt |
| Size (bytes) | 803,707,200 | 55,797,120 |
| Size | 766.5 MB | 53.2 MB |
| Events in quadrant A | 5,920,180 | 334,645 |
| Events in quadrant B | 6,379,307 | 337,639 |
| Events in quadrant C | 5,645,145 | 330,077 |
| Events in quadrant D | 6,042,379 | 315,265 |
| Mode M9 | |||
|---|---|---|---|
| Quadrant | BADHDUFLAG | Total packets | Discarded packets |
| A | 0 | 17 | 0 |
| B | 0 | 17 | 0 |
| C | 0 | 17 | 0 |
| D | 0 | 17 | 0 |
| Mode SS | |||
|---|---|---|---|
| Quadrant | BADHDUFLAG | Total packets | Discarded packets |
| A | 0 | 108 | 0 |
| B | 0 | 108 | 0 |
| C | 0 | 108 | 0 |
| D | 0 | 108 | 0 |
| Mode M0 | |||
|---|---|---|---|
| Quadrant | BADHDUFLAG | Total packets | Discarded packets |
| A | 0 | 21352 | 2 |
| B | 0 | 22702 | 1 |
| C | 0 | 20583 | 1 |
| D | 0 | 21803 | 1 |
| Quadrant | Total seconds | Saturated seconds | Saturation percentage |
|---|---|---|---|
| A | 5306 | 5 | 0.094233% |
| B | 5306 | 9 | 0.169619% |
| C | 5306 | 4 | 0.075386% |
| D | 5306 | 93 | 1.752733% |
Noise dominated data is calculated using 1-second bins in cleaned event files. If a bin has >2000 counts, and if more than 50% of those come from <1% of pixels, then it is considered to be noise-dominated and hence unusable.
| Quadrant | # 1 sec bins | Bins with >0 counts | Bins with >2000 counts | High rate bins dominated by noise | Noise dominated (total time) | Noise dominated (detector-on time) | Marked lightcurve |
|---|---|---|---|---|---|---|---|
| A | 7011 | 5307 | 108 | 108 | 1.54% | 2.04% | 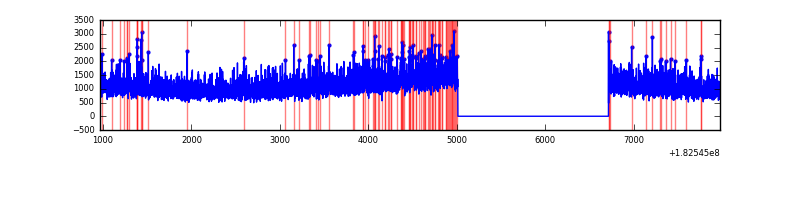 |
| B | 7011 | 5307 | 170 | 170 | 2.42% | 3.20% | 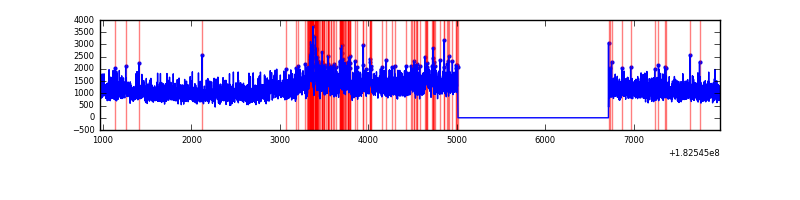 |
| C | 7011 | 5307 | 45 | 45 | 0.64% | 0.85% | 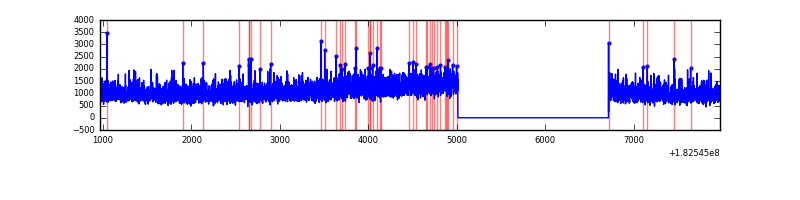 |
| D | 7011 | 5307 | 276 | 276 | 3.94% | 5.20% | 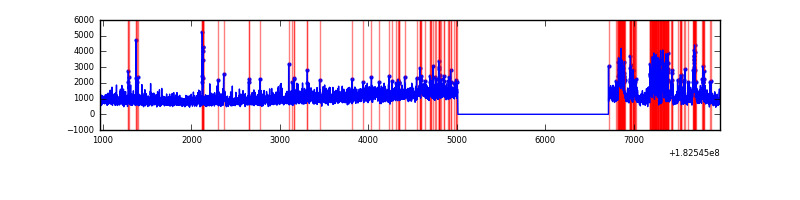 |
Top three noisy pixels from each quadrant. If the there are fewer than three noisy pixels in the level2.evt file, extra rows are filled as -1
| Pixel properties | Quadrant properties | ||||||
|---|---|---|---|---|---|---|---|
| Quadrant | DetID | PixID | Counts | Sigma | Mean | Median | Sigma |
| A | 15 | 250 | 38097 | 110.59 | 1502 | 1491 | 331.0 |
| A | 15 | 127 | 31714 | 91.31 | 1502 | 1491 | 331.0 |
| A | 12 | 150 | 24181 | 68.55 | 1502 | 1491 | 331.0 |
| B | 2 | 32 | 413547 | 1150.89 | 1525 | 1531 | 358.0 |
| B | 0 | 214 | 91029 | 250.0 | 1525 | 1531 | 358.0 |
| B | 0 | 190 | 19529 | 50.27 | 1525 | 1531 | 358.0 |
| C | 1 | 1 | 78754 | 198.9 | 1408 | 1462 | 388.6 |
| C | 9 | 68 | 14467 | 33.47 | 1408 | 1462 | 388.6 |
| C | 9 | 54 | 13372 | 30.65 | 1408 | 1462 | 388.6 |
| D | 13 | 7 | 447922 | 1080.04 | 1316 | 1371 | 413.5 |
| D | 1 | 4 | 344792 | 830.61 | 1316 | 1371 | 413.5 |
| D | 10 | 154 | 111608 | 266.62 | 1316 | 1371 | 413.5 |
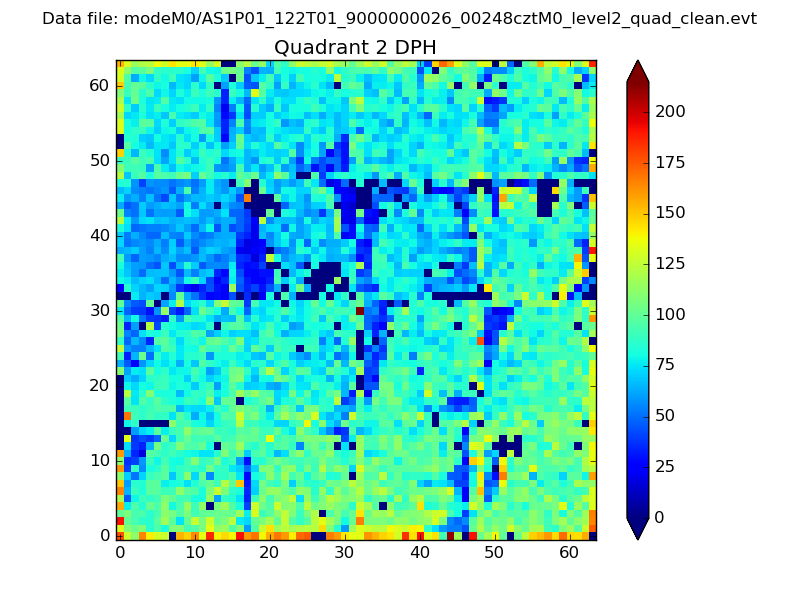
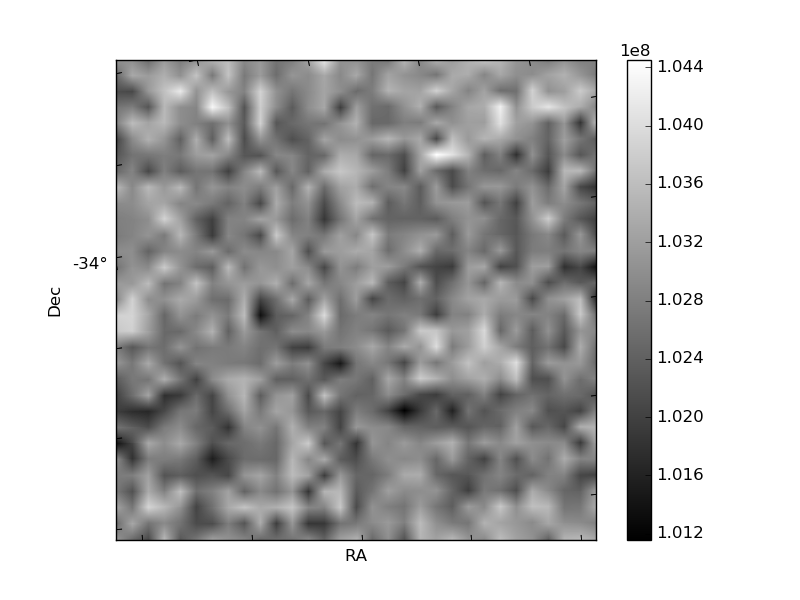
Histogram calculated using DETX and DETY for each event in the final _common_clean file
| Quadrant A | 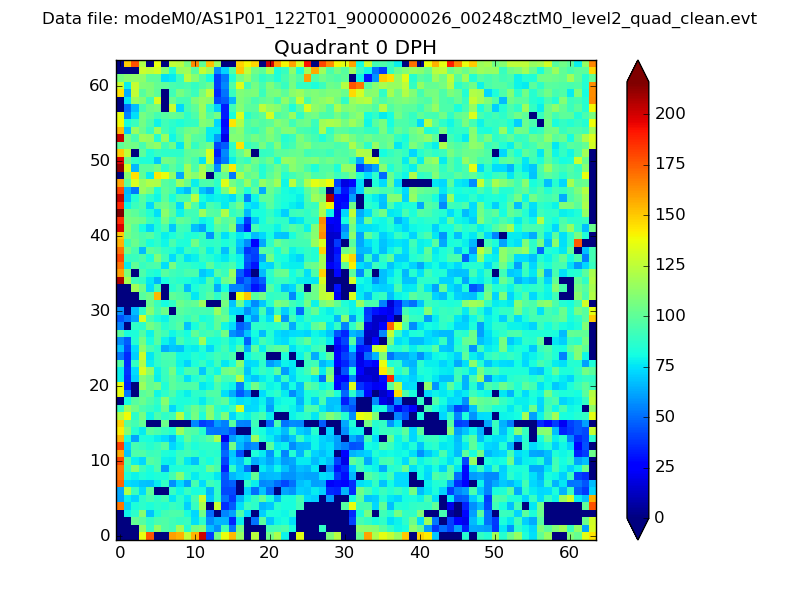 |
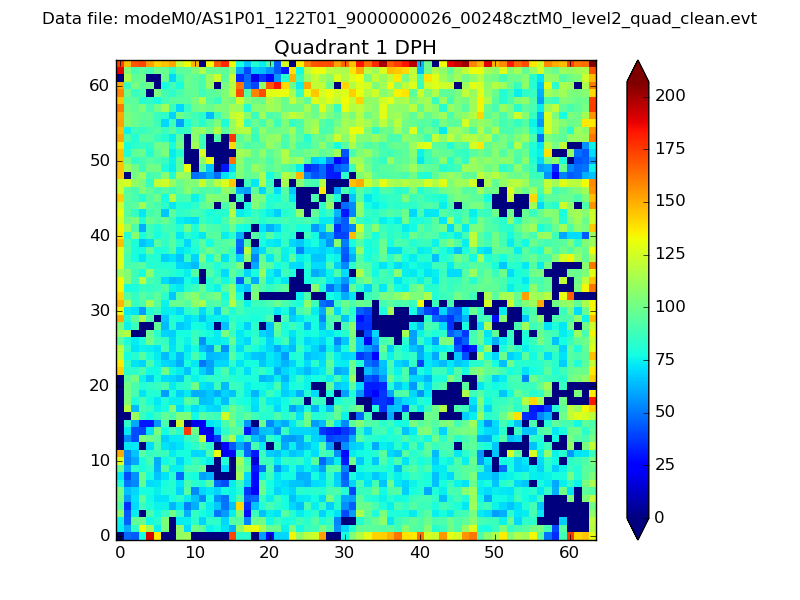 |
Quadrant B |
|---|---|---|---|
| Quadrant D | 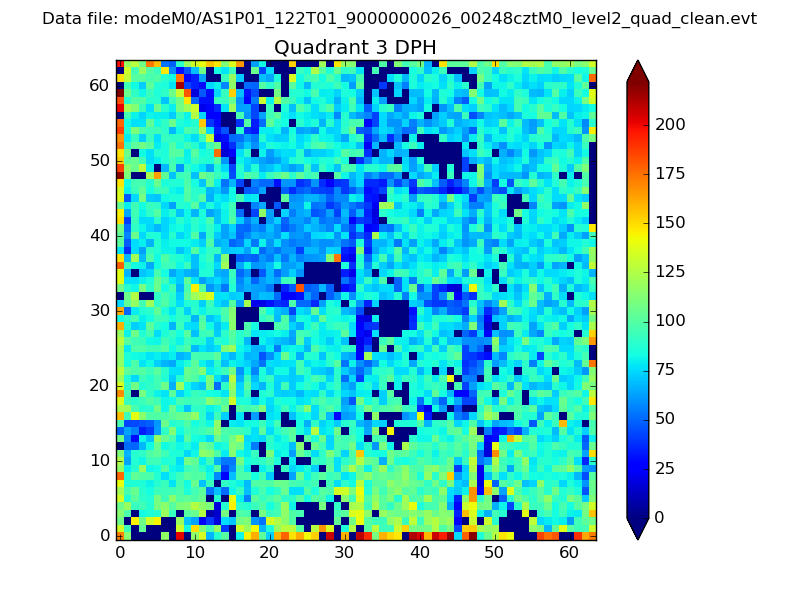 |
 |
Quadrant C |
| Plot type | Count rate plots | Images |
|---|---|---|
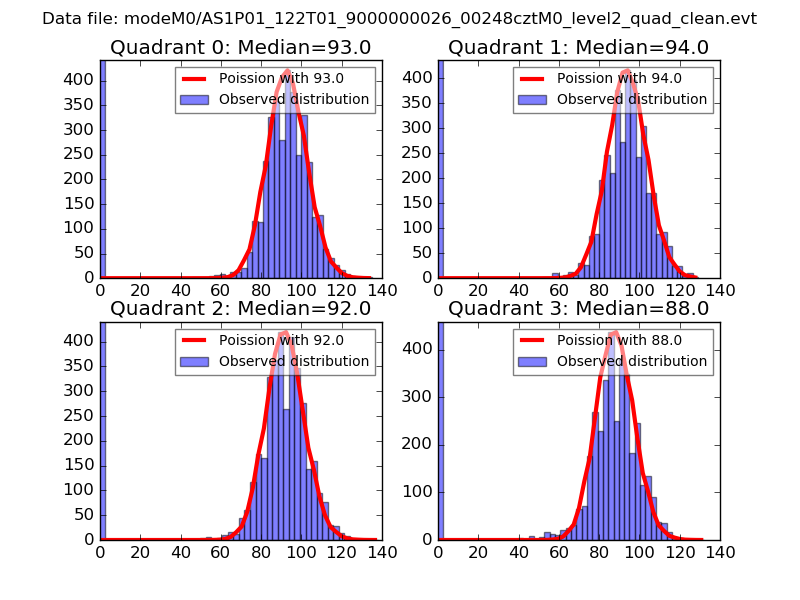
| Comparison with Poisson distribution Blue bars denote a histogram of data divided into 1 sec bins. Red curve is a Poisson curve with rate = median count rate of data. |
 |
 |
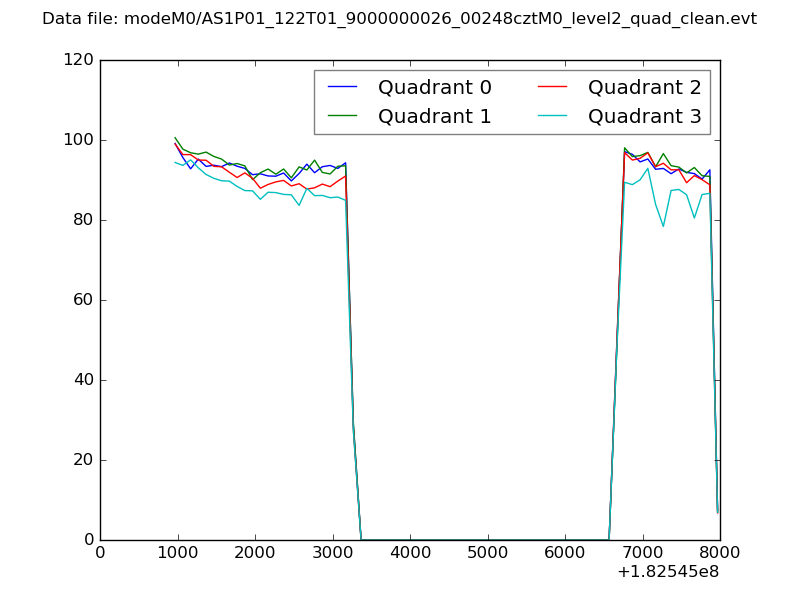
| Quadrant-wise count rates Data is divided into 100 sec bins |
 |
|
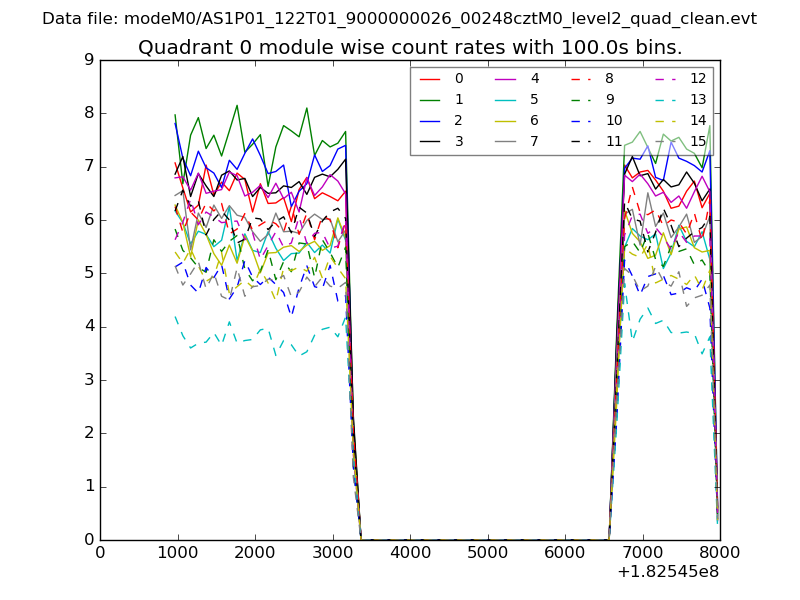
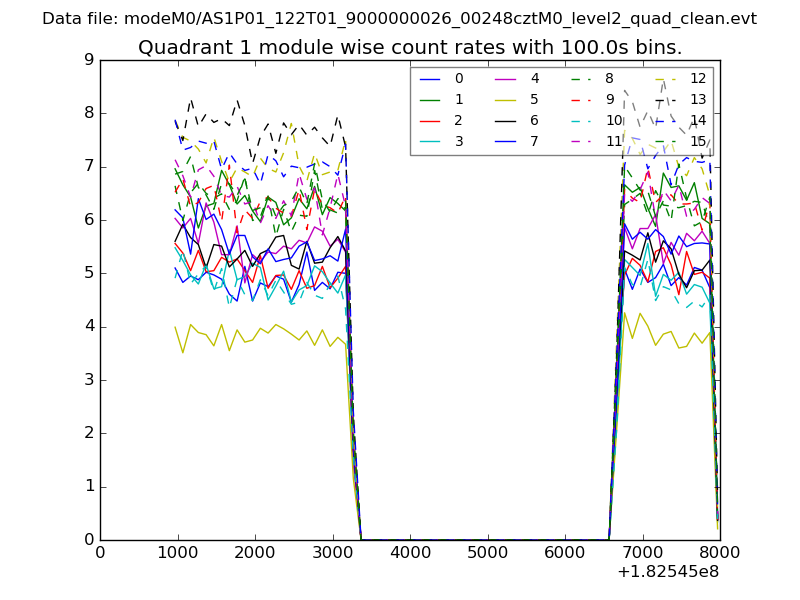
| Module-wise count rates for Quadrant A Data is divided into 100 sec bins |
 |
 |
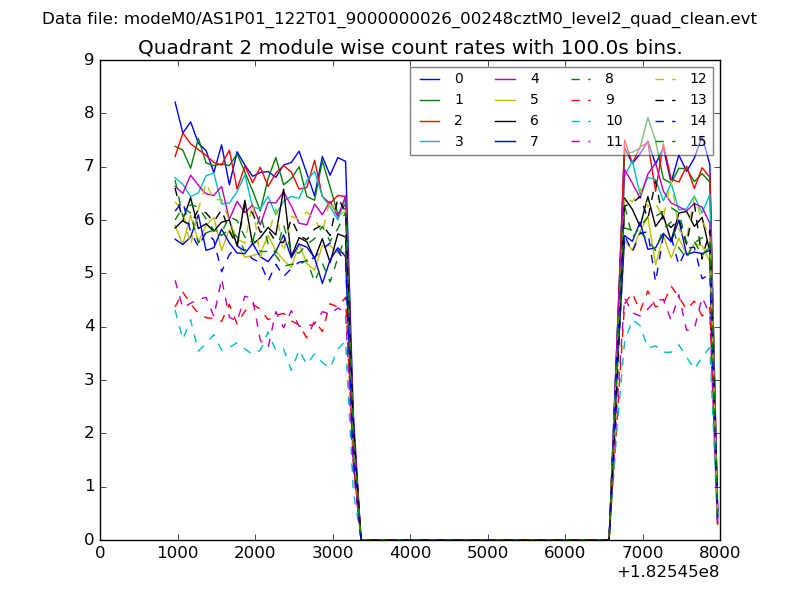
| Module-wise count rates for Quadrant B Data is divided into 100 sec bins |
 |
 |
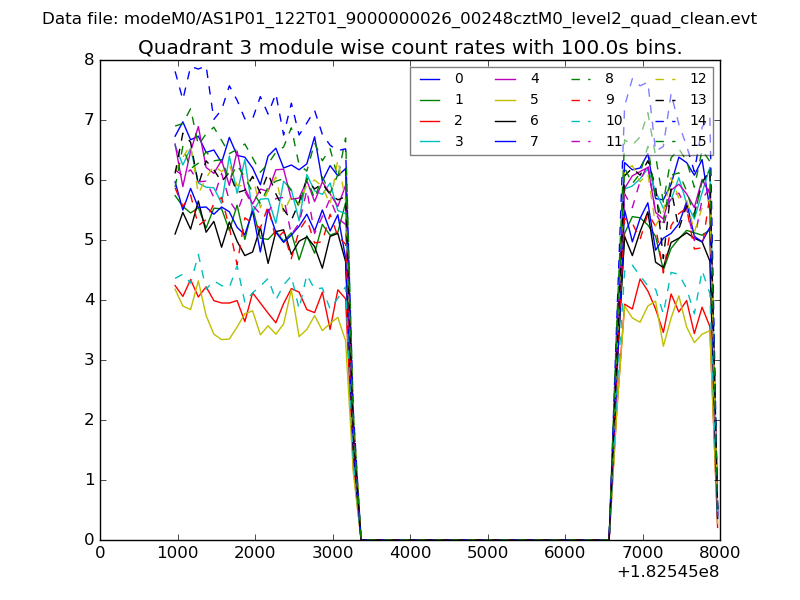
| Module-wise count rates for Quadrant C Data is divided into 100 sec bins |
 |
 |
| Module-wise count rates for Quadrant D Data is divided into 100 sec bins |
 |
 |
| Parameter | Plot |
|---|---|
| CZT HV Monitor | 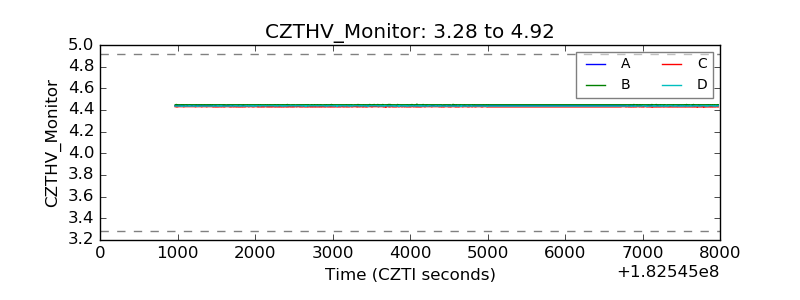 |
| D_VDD | 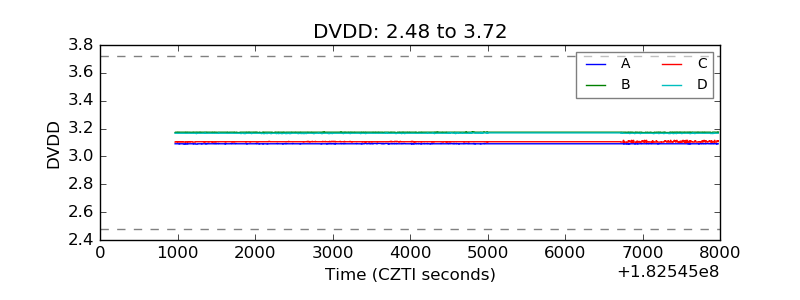 |
| Temperature 1 | 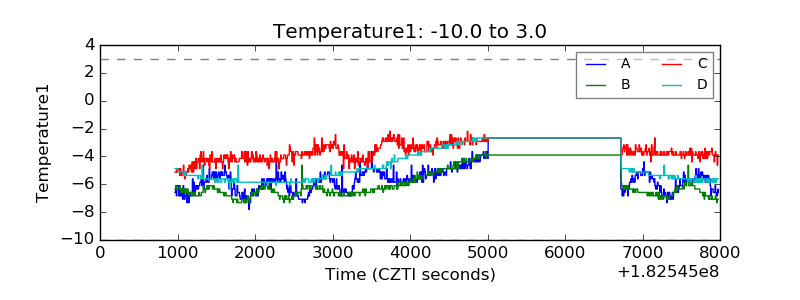 |
| Veto HV Monitor | 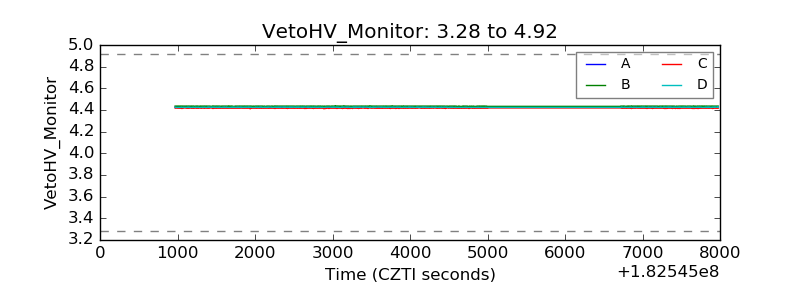 |
| Veto LLD | 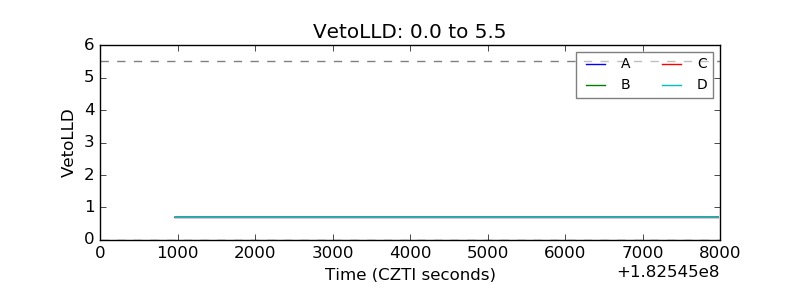 |
| Alpha Counter | 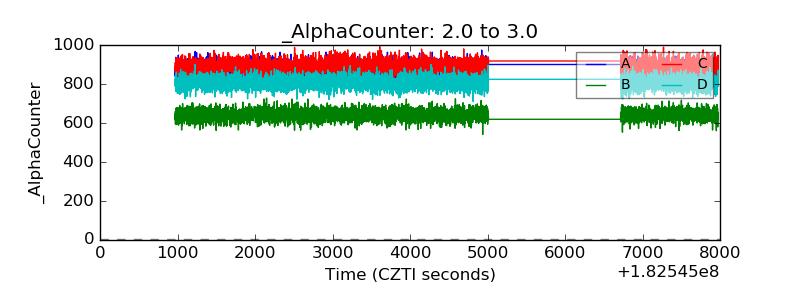 |
| _CPM_Rate | 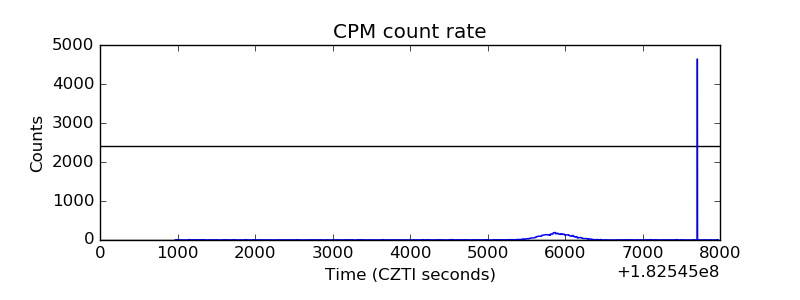 |
| CZT Counter |  |
| +2.5 Volts monitor |  |
| +5 Volts monitor |  |
| _ROLL_ROT | 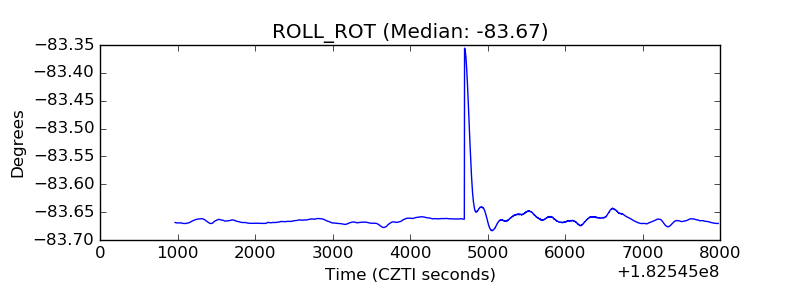 |
| _Roll_DEC | 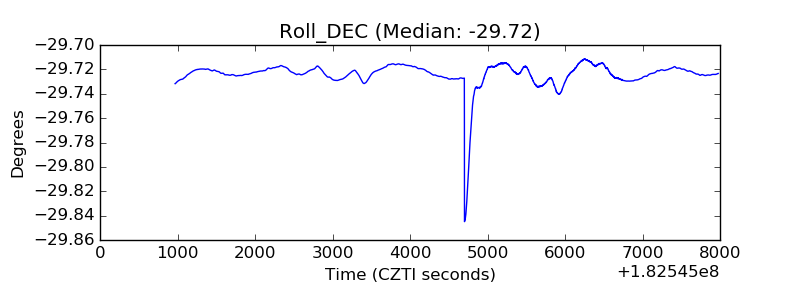 |
| _Roll_RA |  |
| Veto Counter | 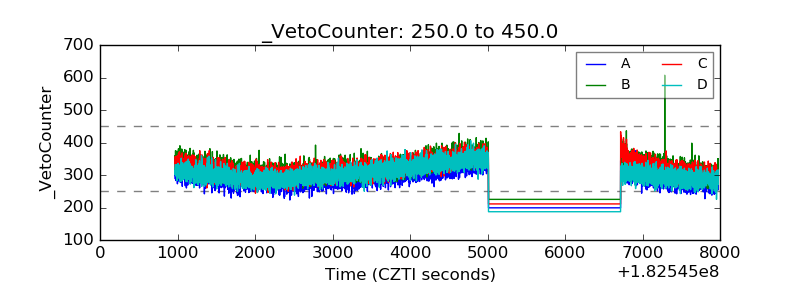 |