| Param | Original file | Final file |
|---|---|---|
| Filename | modeM0/AS1P01_122T01_9000000026_00250cztM0_level2.evt | modeM0/AS1P01_122T01_9000000026_00250cztM0_level2_quad_clean.evt |
| Size (bytes) | 875,427,840 | 55,563,840 |
| Size | 834.9 MB | 53.0 MB |
| Events in quadrant A | 6,496,127 | 325,312 |
| Events in quadrant B | 6,566,974 | 330,328 |
| Events in quadrant C | 6,113,040 | 319,916 |
| Events in quadrant D | 6,958,570 | 309,379 |
| Mode M9 | |||
|---|---|---|---|
| Quadrant | BADHDUFLAG | Total packets | Discarded packets |
| A | 0 | 19 | 0 |
| B | 0 | 19 | 0 |
| C | 0 | 19 | 0 |
| D | 0 | 20 | 0 |
| Mode SS | |||
|---|---|---|---|
| Quadrant | BADHDUFLAG | Total packets | Discarded packets |
| A | 0 | 114 | 0 |
| B | 0 | 114 | 0 |
| C | 0 | 114 | 0 |
| D | 0 | 114 | 0 |
| Mode M0 | |||
|---|---|---|---|
| Quadrant | BADHDUFLAG | Total packets | Discarded packets |
| A | 0 | 23342 | 3 |
| B | 0 | 23529 | 2 |
| C | 0 | 22224 | 2 |
| D | 0 | 24751 | 2 |
| Quadrant | Total seconds | Saturated seconds | Saturation percentage |
|---|---|---|---|
| A | 5684 | 3 | 0.052780% |
| B | 5684 | 3 | 0.052780% |
| C | 5684 | 2 | 0.035186% |
| D | 5684 | 71 | 1.249120% |
Noise dominated data is calculated using 1-second bins in cleaned event files. If a bin has >2000 counts, and if more than 50% of those come from <1% of pixels, then it is considered to be noise-dominated and hence unusable.
| Quadrant | # 1 sec bins | Bins with >0 counts | Bins with >2000 counts | High rate bins dominated by noise | Noise dominated (total time) | Noise dominated (detector-on time) | Marked lightcurve |
|---|---|---|---|---|---|---|---|
| A | 7390 | 5685 | 120 | 120 | 1.62% | 2.11% | 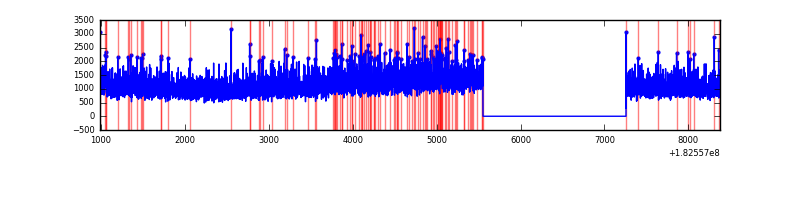 |
| B | 7390 | 5685 | 80 | 80 | 1.08% | 1.41% | 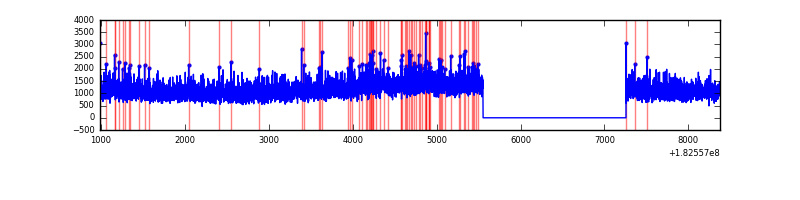 |
| C | 7390 | 5685 | 42 | 42 | 0.57% | 0.74% | 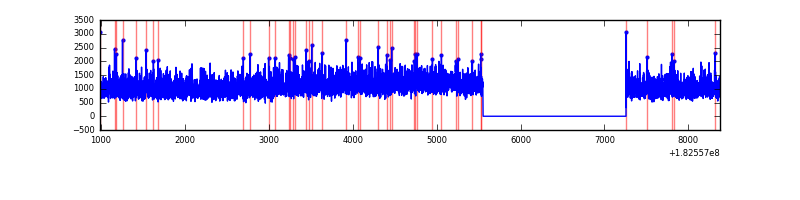 |
| D | 7390 | 5685 | 327 | 327 | 4.42% | 5.75% | 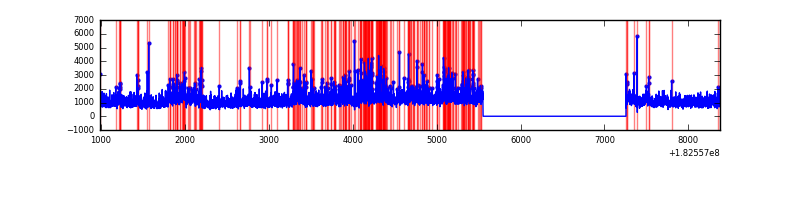 |
Top three noisy pixels from each quadrant. If the there are fewer than three noisy pixels in the level2.evt file, extra rows are filled as -1
| Pixel properties | Quadrant properties | ||||||
|---|---|---|---|---|---|---|---|
| Quadrant | DetID | PixID | Counts | Sigma | Mean | Median | Sigma |
| A | 15 | 250 | 89442 | 238.23 | 1655 | 1638 | 368.6 |
| A | 13 | 9 | 7517 | 15.95 | 1655 | 1638 | 368.6 |
| A | 13 | 239 | 4721 | 8.36 | 1655 | 1638 | 368.6 |
| B | 2 | 32 | 107593 | 272.43 | 1671 | 1683 | 388.8 |
| B | 0 | 214 | 33805 | 82.63 | 1671 | 1683 | 388.8 |
| B | 0 | 190 | 13237 | 29.72 | 1671 | 1683 | 388.8 |
| C | 9 | 68 | 11071 | 21.85 | 1549 | 1610 | 432.9 |
| C | 2 | 192 | 10967 | 21.61 | 1549 | 1610 | 432.9 |
| C | 9 | 85 | 6227 | 10.66 | 1549 | 1610 | 432.9 |
| D | 1 | 4 | 767222 | 1667.65 | 1463 | 1521 | 459.1 |
| D | 13 | 7 | 223896 | 484.32 | 1463 | 1521 | 459.1 |
| D | 10 | 154 | 156372 | 337.26 | 1463 | 1521 | 459.1 |
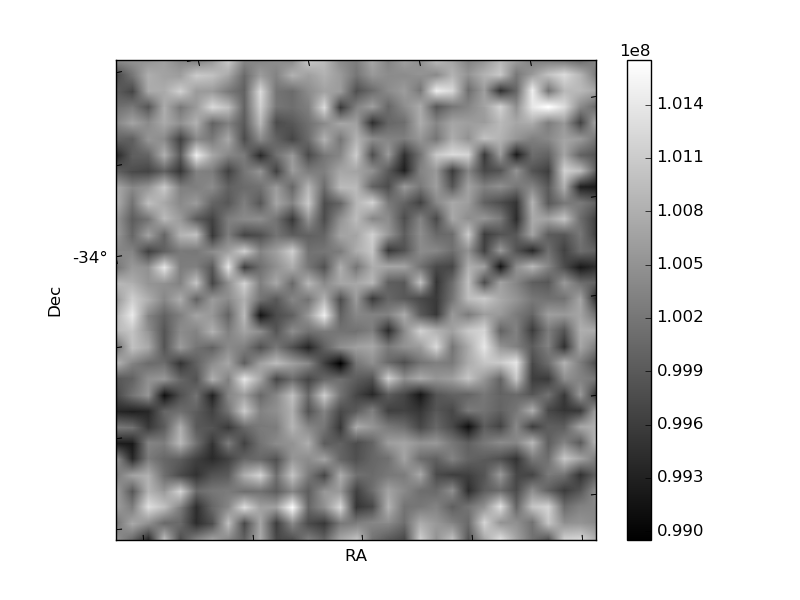
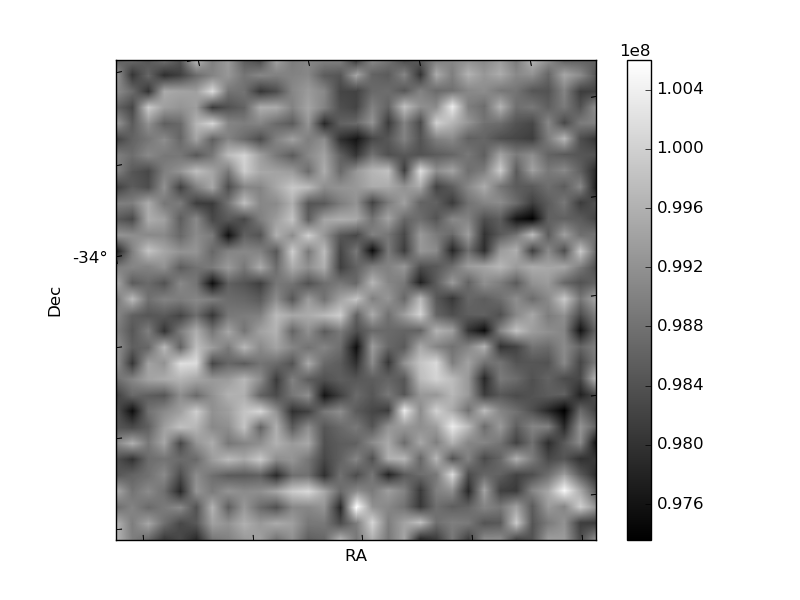
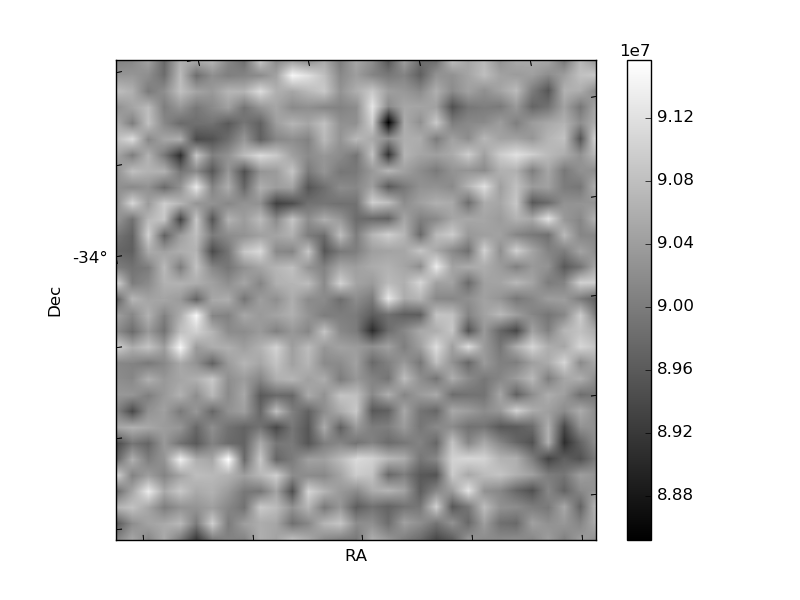
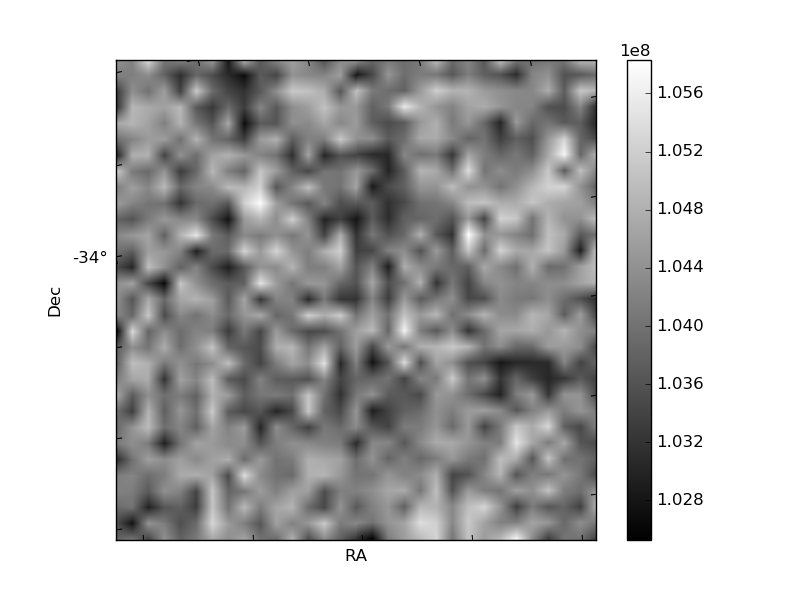
Histogram calculated using DETX and DETY for each event in the final _common_clean file
| Quadrant A | 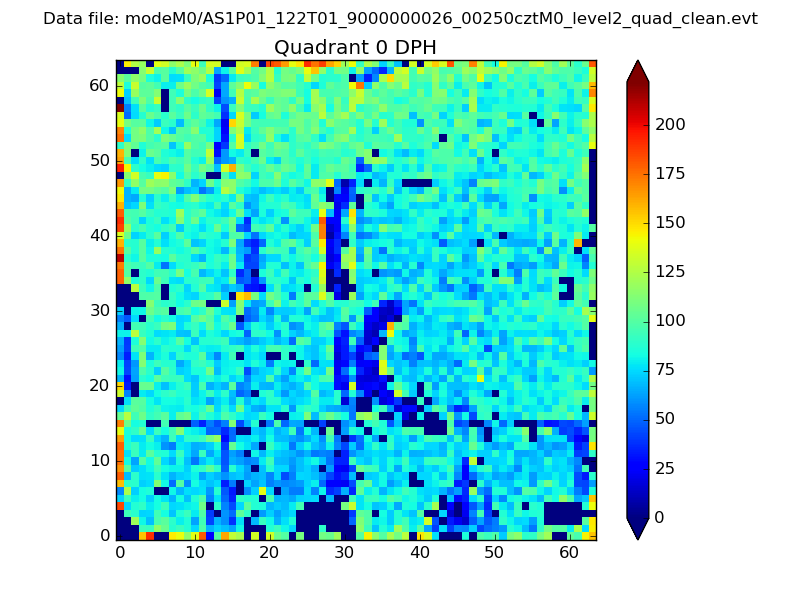 |
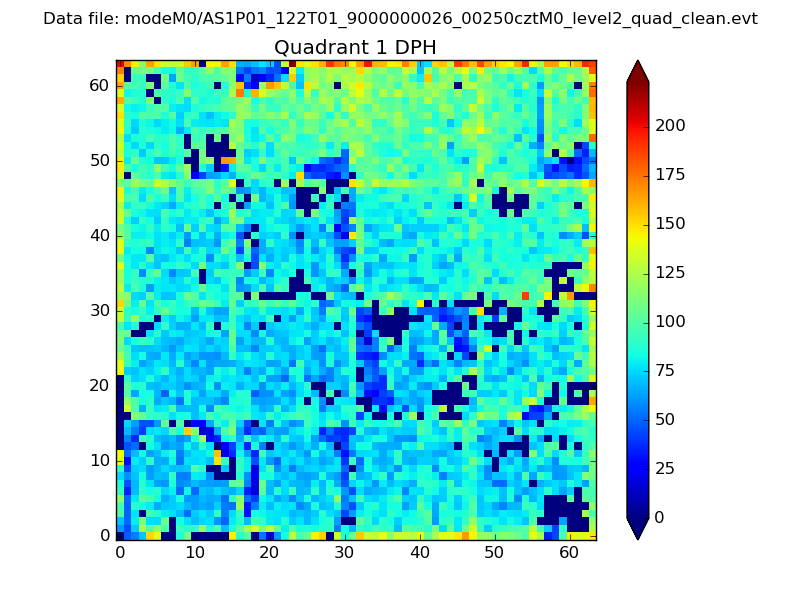 |
Quadrant B |
|---|---|---|---|
| Quadrant D | 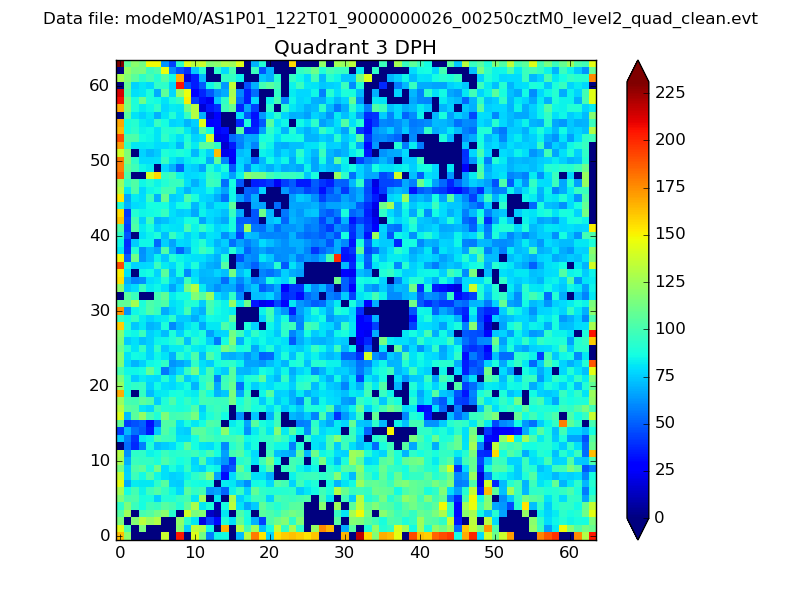 |
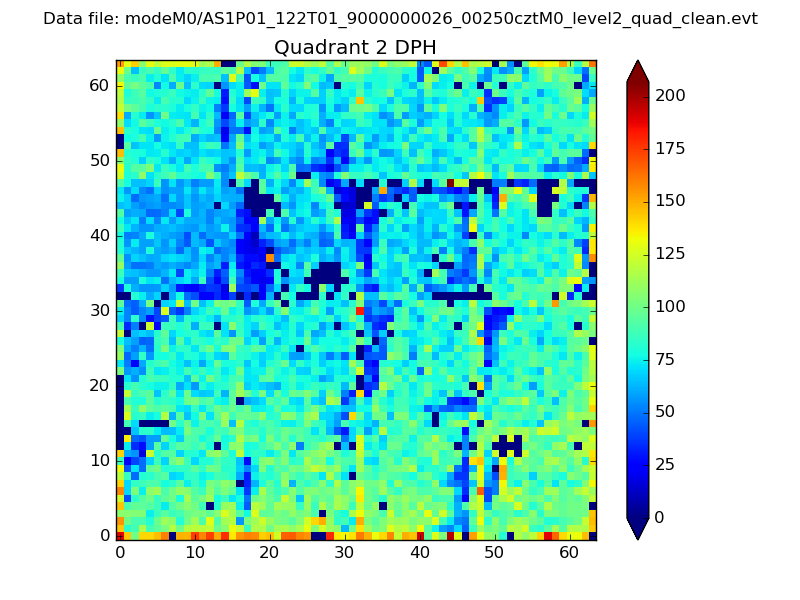 |
Quadrant C |
| Plot type | Count rate plots | Images |
|---|---|---|
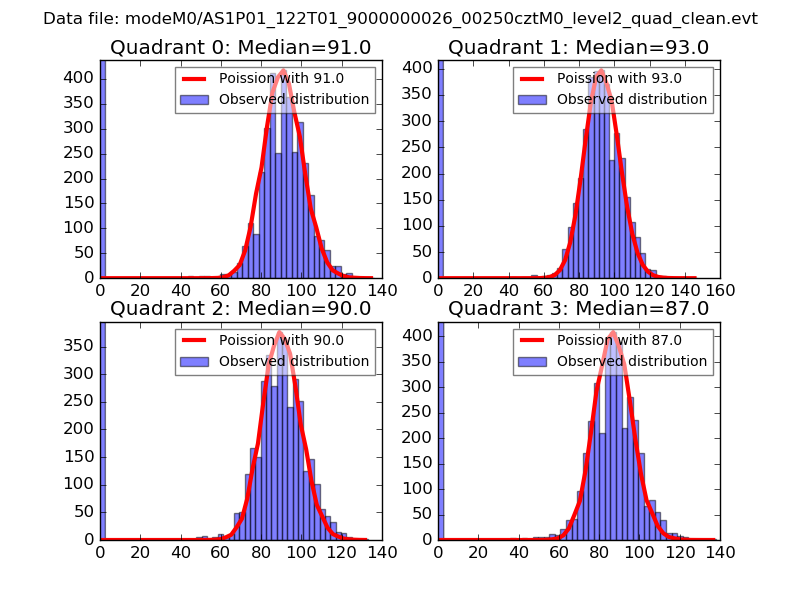
| Comparison with Poisson distribution Blue bars denote a histogram of data divided into 1 sec bins. Red curve is a Poisson curve with rate = median count rate of data. |
 |
 |
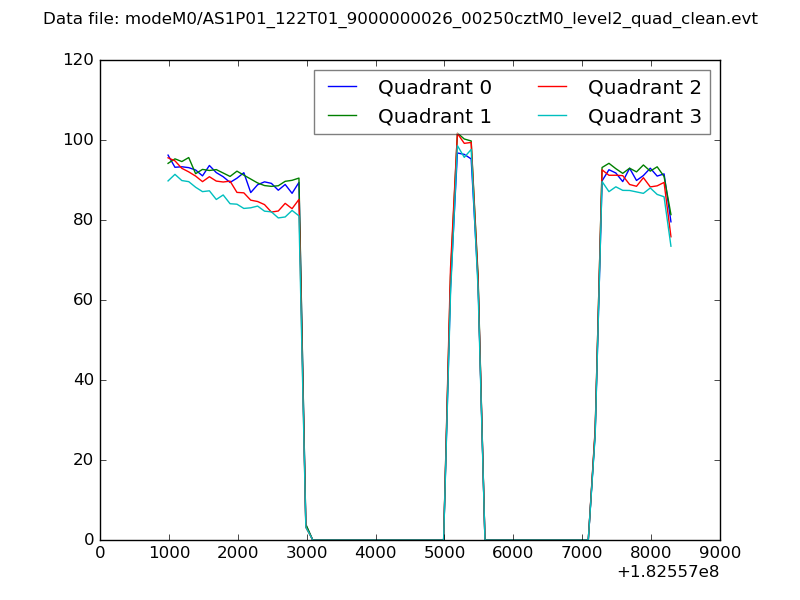
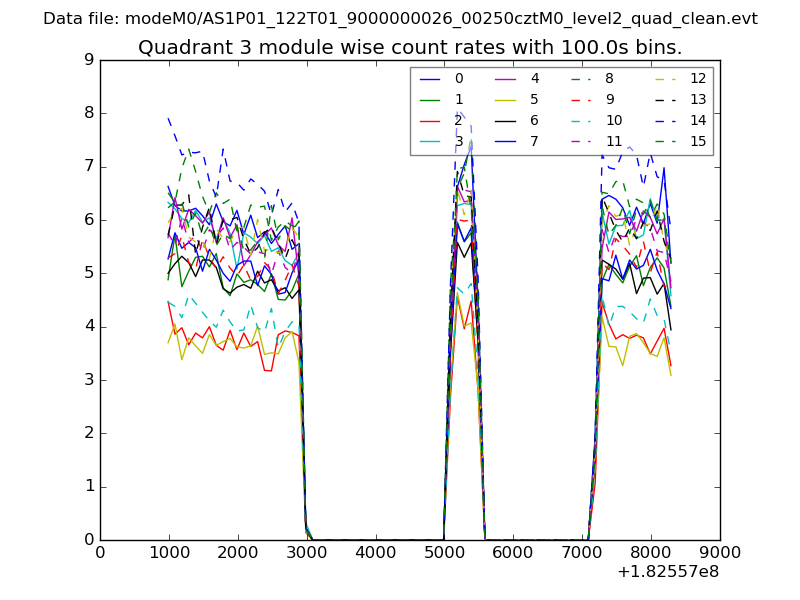
| Quadrant-wise count rates Data is divided into 100 sec bins |
 |
|
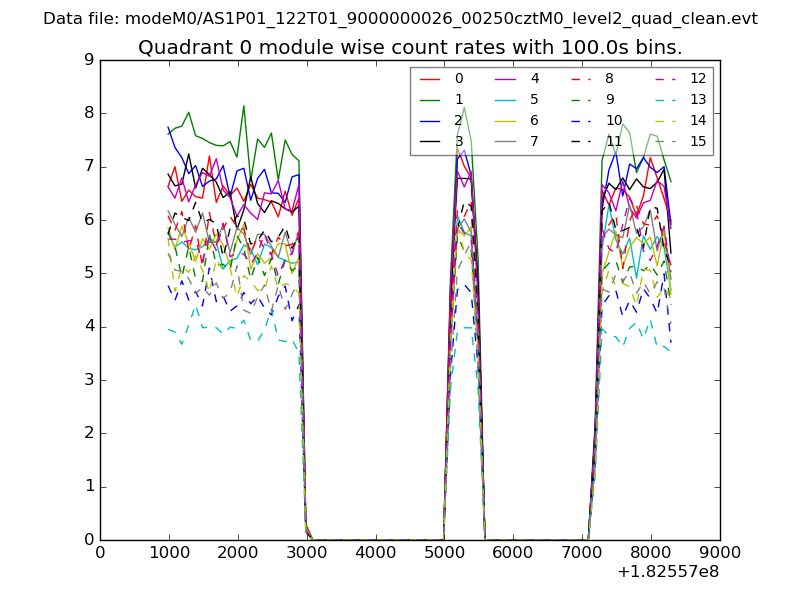
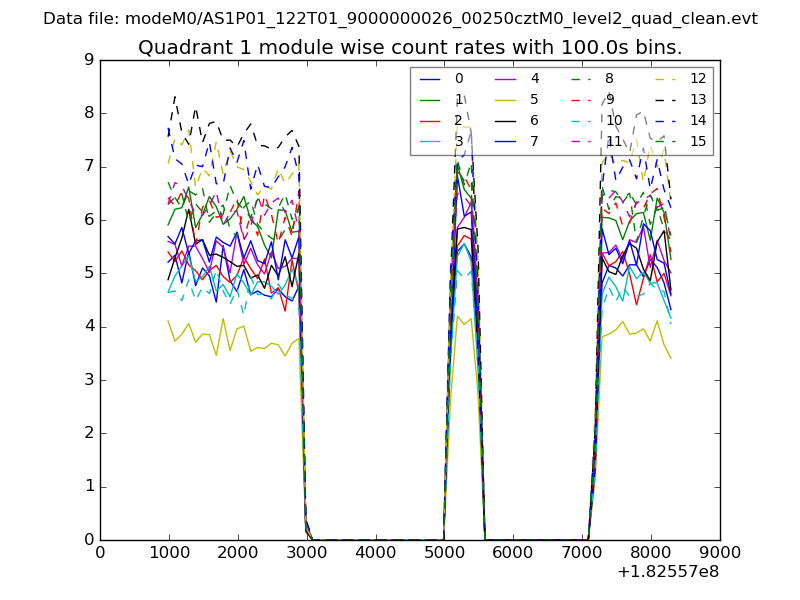
| Module-wise count rates for Quadrant A Data is divided into 100 sec bins |
 |
 |
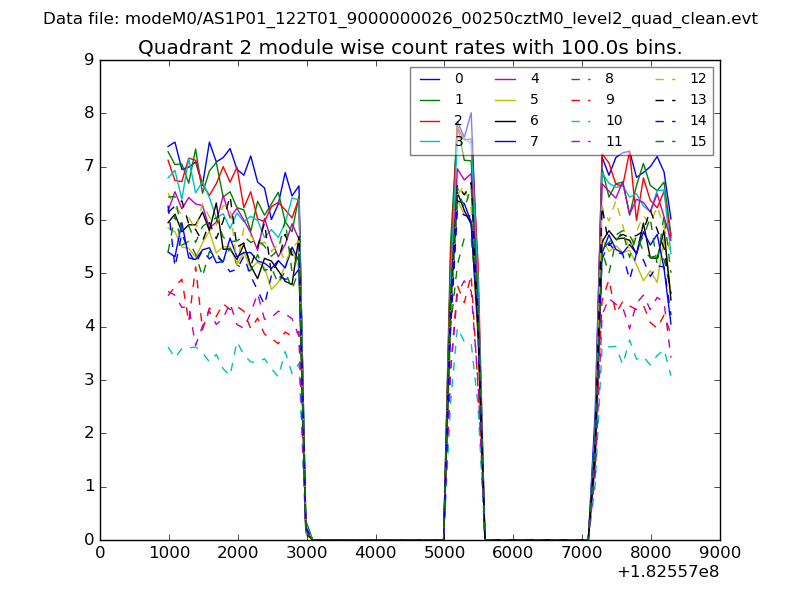
| Module-wise count rates for Quadrant B Data is divided into 100 sec bins |
 |
 |
| Module-wise count rates for Quadrant C Data is divided into 100 sec bins |
 |
 |
| Module-wise count rates for Quadrant D Data is divided into 100 sec bins |
 |
 |
| Parameter | Plot |
|---|---|
| CZT HV Monitor | 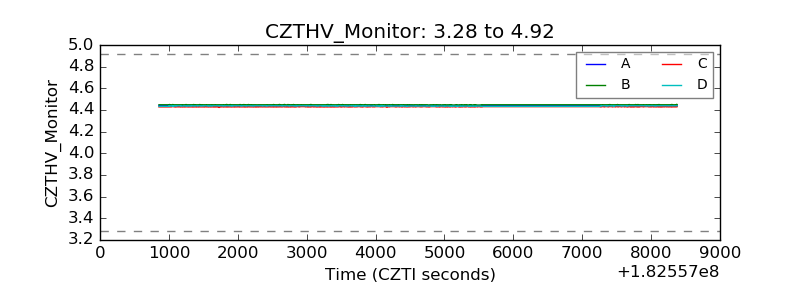 |
| D_VDD | 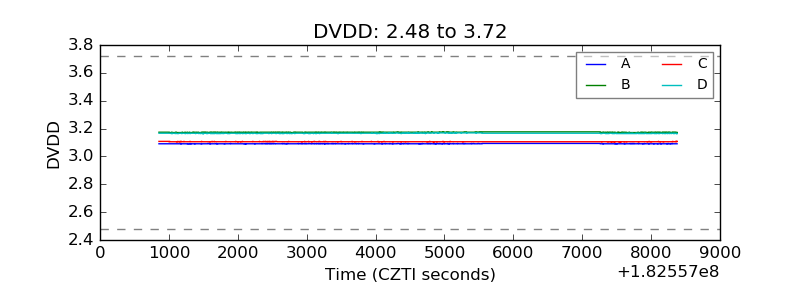 |
| Temperature 1 | 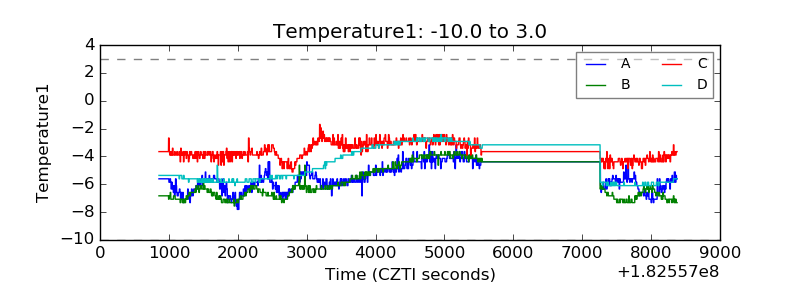 |
| Veto HV Monitor | 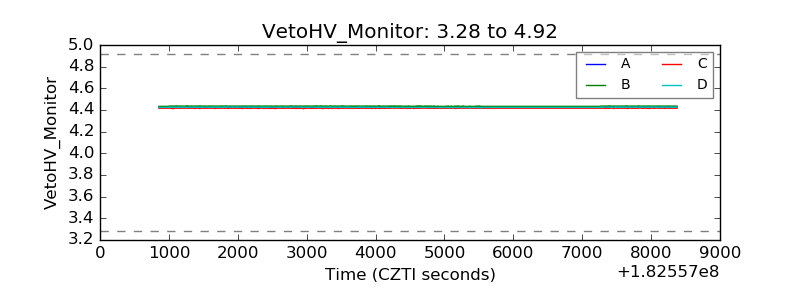 |
| Veto LLD | 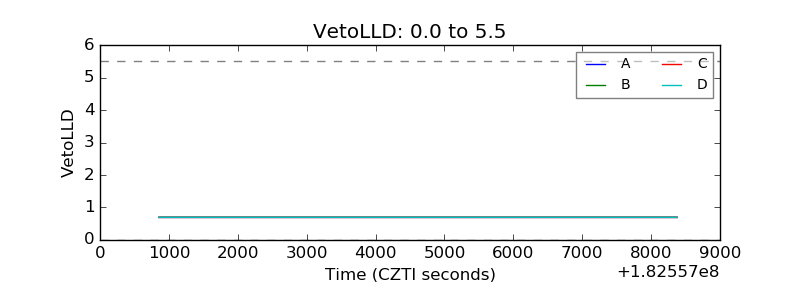 |
| Alpha Counter | 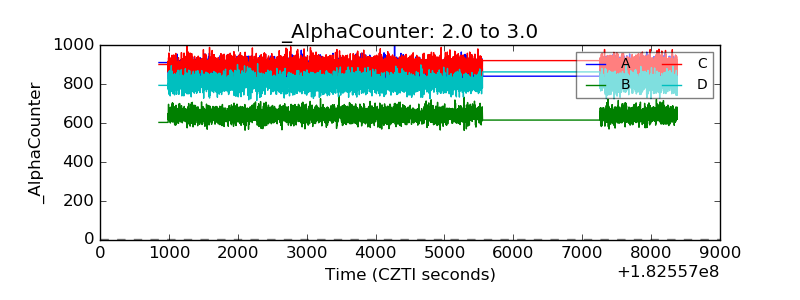 |
| _CPM_Rate | 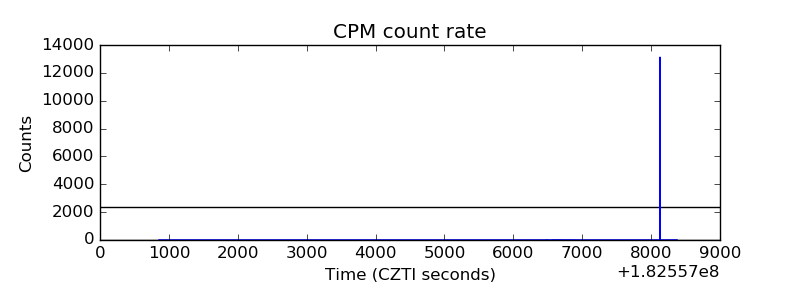 |
| CZT Counter | 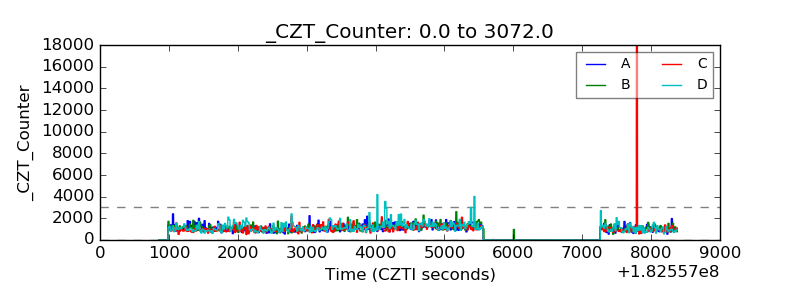 |
| +2.5 Volts monitor |  |
| +5 Volts monitor |  |
| _ROLL_ROT | 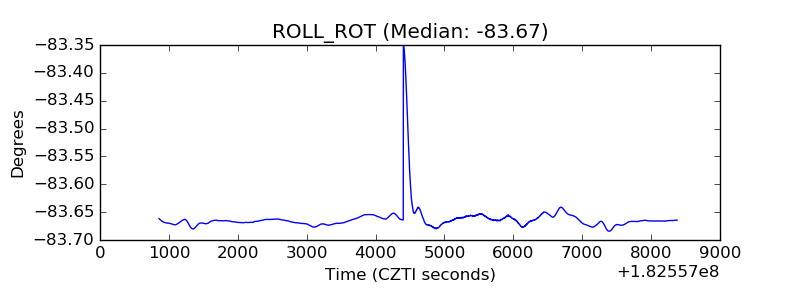 |
| _Roll_DEC | 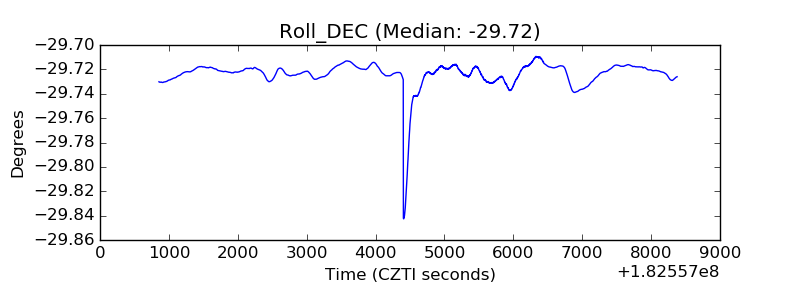 |
| _Roll_RA | 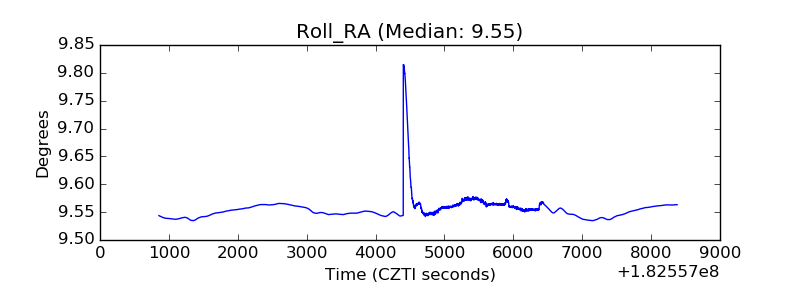 |
| Veto Counter | 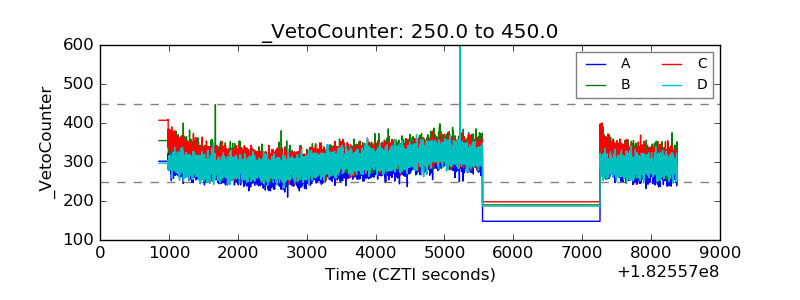 |