| Param | Original file | Final file |
|---|---|---|
| Filename | modeM0/AS1P01_122T01_9000000026_00252cztM0_level2.evt | modeM0/AS1P01_122T01_9000000026_00252cztM0_level2_quad_clean.evt |
| Size (bytes) | 845,965,440 | 44,809,920 |
| Size | 806.8 MB | 42.7 MB |
| Events in quadrant A | 6,317,343 | 249,131 |
| Events in quadrant B | 6,427,652 | 251,794 |
| Events in quadrant C | 5,968,073 | 246,209 |
| Events in quadrant D | 6,554,117 | 237,247 |
| Mode M9 | |||
|---|---|---|---|
| Quadrant | BADHDUFLAG | Total packets | Discarded packets |
| A | 0 | 17 | 0 |
| B | 0 | 17 | 0 |
| C | 0 | 17 | 0 |
| D | 0 | 17 | 0 |
| Mode SS | |||
|---|---|---|---|
| Quadrant | BADHDUFLAG | Total packets | Discarded packets |
| A | 0 | 108 | 0 |
| B | 0 | 108 | 0 |
| C | 0 | 108 | 0 |
| D | 0 | 108 | 0 |
| Mode M0 | |||
|---|---|---|---|
| Quadrant | BADHDUFLAG | Total packets | Discarded packets |
| A | 0 | 22522 | 2 |
| B | 0 | 22836 | 1 |
| C | 0 | 21544 | 1 |
| D | 0 | 23248 | 1 |
| Quadrant | Total seconds | Saturated seconds | Saturation percentage |
|---|---|---|---|
| A | 5310 | 2 | 0.037665% |
| B | 5310 | 1 | 0.018832% |
| C | 5310 | 3 | 0.056497% |
| D | 5310 | 20 | 0.376648% |
Noise dominated data is calculated using 1-second bins in cleaned event files. If a bin has >2000 counts, and if more than 50% of those come from <1% of pixels, then it is considered to be noise-dominated and hence unusable.
| Quadrant | # 1 sec bins | Bins with >0 counts | Bins with >2000 counts | High rate bins dominated by noise | Noise dominated (total time) | Noise dominated (detector-on time) | Marked lightcurve |
|---|---|---|---|---|---|---|---|
| A | 7016 | 5311 | 119 | 119 | 1.70% | 2.24% | 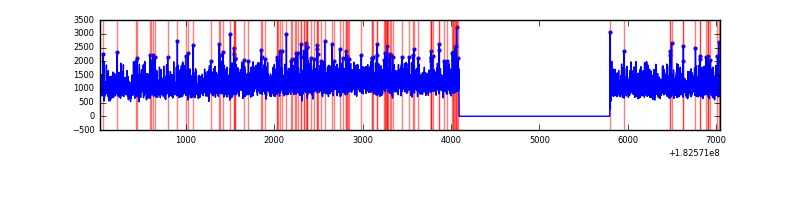 |
| B | 7016 | 5311 | 85 | 85 | 1.21% | 1.60% |  |
| C | 7016 | 5311 | 43 | 43 | 0.61% | 0.81% | 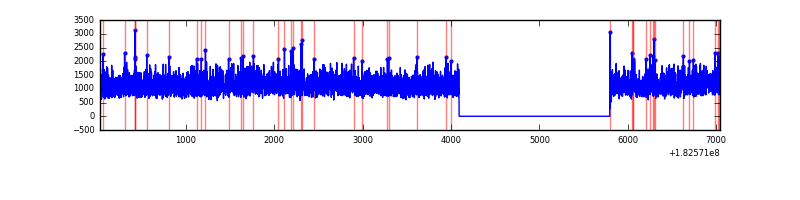 |
| D | 7016 | 5311 | 218 | 218 | 3.11% | 4.10% | 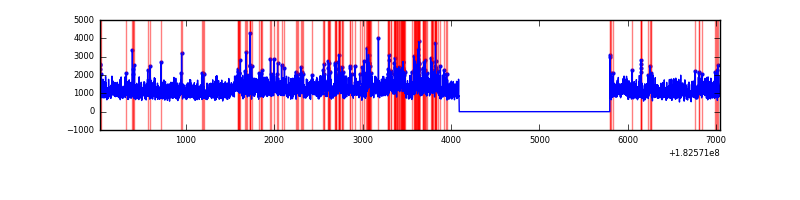 |
Top three noisy pixels from each quadrant. If the there are fewer than three noisy pixels in the level2.evt file, extra rows are filled as -1
| Pixel properties | Quadrant properties | ||||||
|---|---|---|---|---|---|---|---|
| Quadrant | DetID | PixID | Counts | Sigma | Mean | Median | Sigma |
| A | 12 | 150 | 8588 | 19.04 | 1629 | 1615 | 366.2 |
| A | 15 | 250 | 8087 | 17.67 | 1629 | 1615 | 366.2 |
| A | 13 | 239 | 5190 | 9.76 | 1629 | 1615 | 366.2 |
| B | 2 | 32 | 212383 | 558.97 | 1618 | 1632 | 377.0 |
| B | 5 | 46 | 13608 | 31.76 | 1618 | 1632 | 377.0 |
| B | 5 | 2 | 9058 | 19.7 | 1618 | 1632 | 377.0 |
| C | 2 | 192 | 21453 | 47.15 | 1509 | 1567 | 421.7 |
| C | 1 | 192 | 11206 | 22.86 | 1509 | 1567 | 421.7 |
| C | 0 | 206 | 5305 | 8.86 | 1509 | 1567 | 421.7 |
| D | 1 | 4 | 532402 | 1155.71 | 1456 | 1512 | 459.4 |
| D | 10 | 154 | 260282 | 563.32 | 1456 | 1512 | 459.4 |
| D | 1 | 5 | 140594 | 302.77 | 1456 | 1512 | 459.4 |
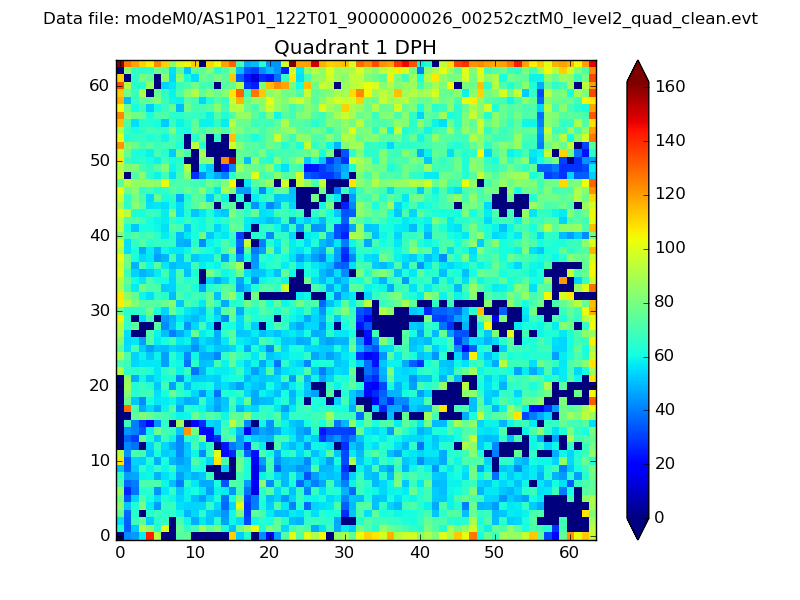
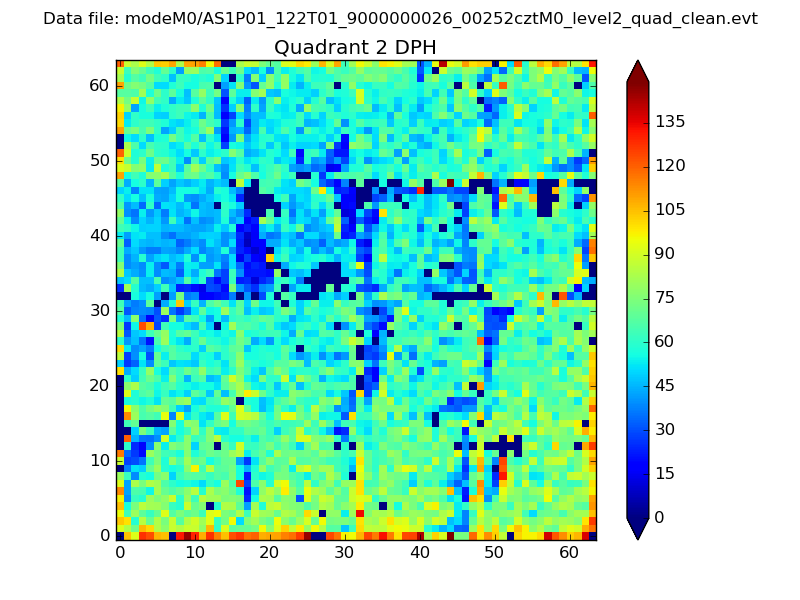
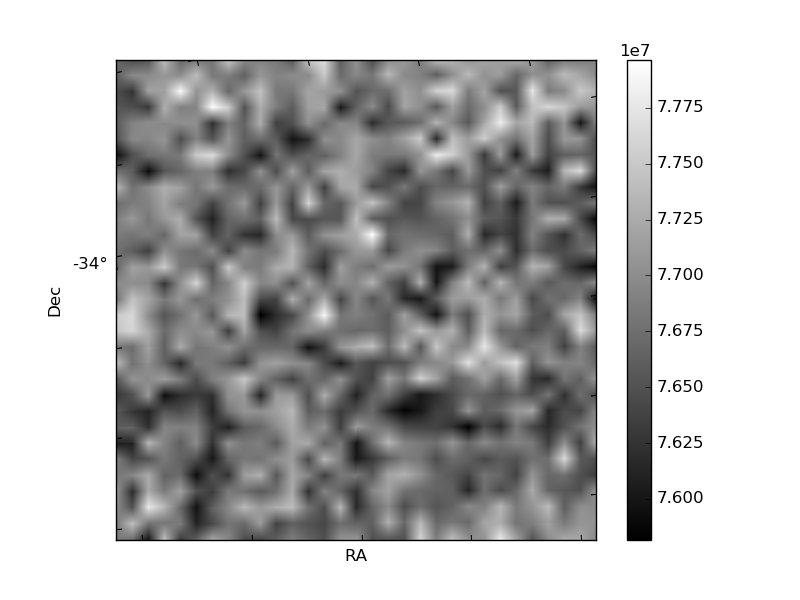
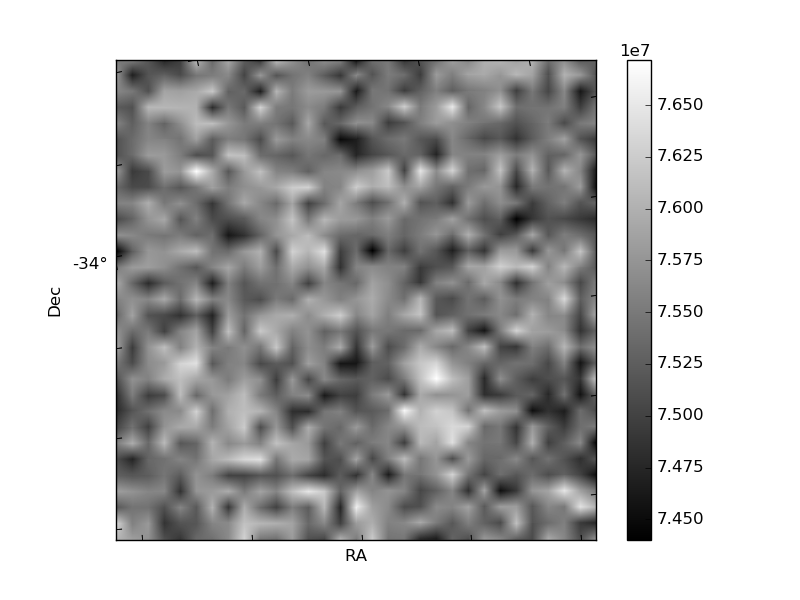
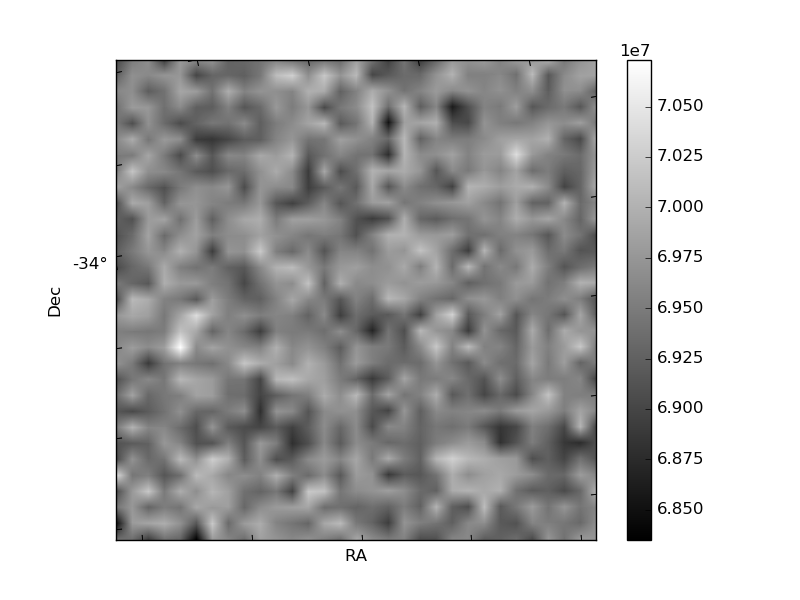
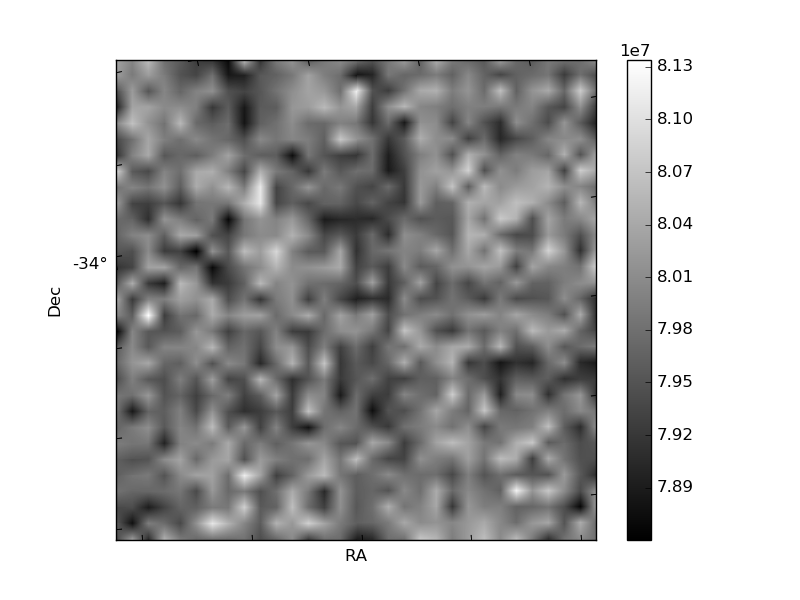
Histogram calculated using DETX and DETY for each event in the final _common_clean file
| Quadrant A | 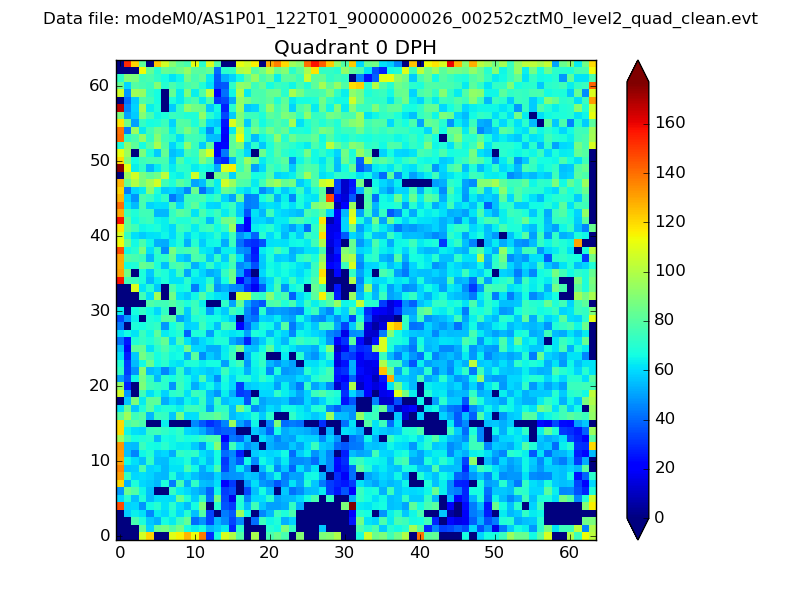 |
 |
Quadrant B |
|---|---|---|---|
| Quadrant D | 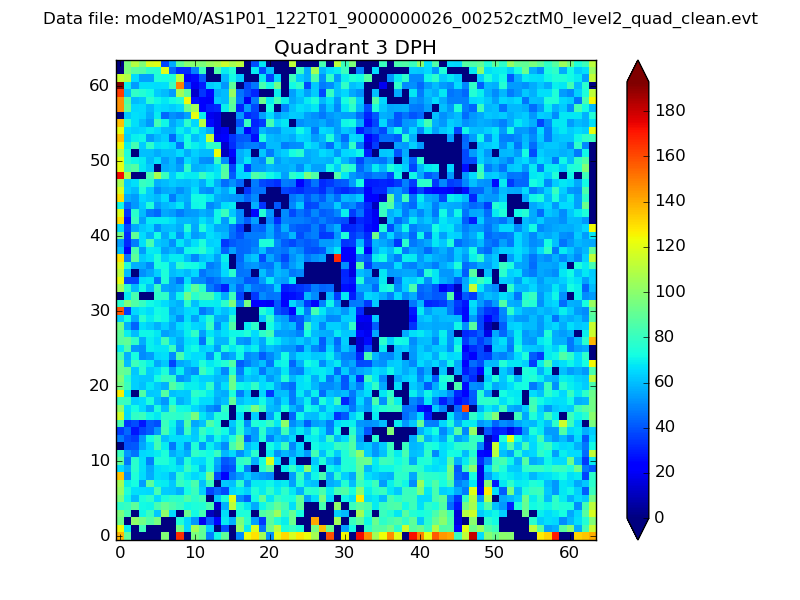 |
 |
Quadrant C |
| Plot type | Count rate plots | Images |
|---|---|---|
| Comparison with Poisson distribution Blue bars denote a histogram of data divided into 1 sec bins. Red curve is a Poisson curve with rate = median count rate of data. |
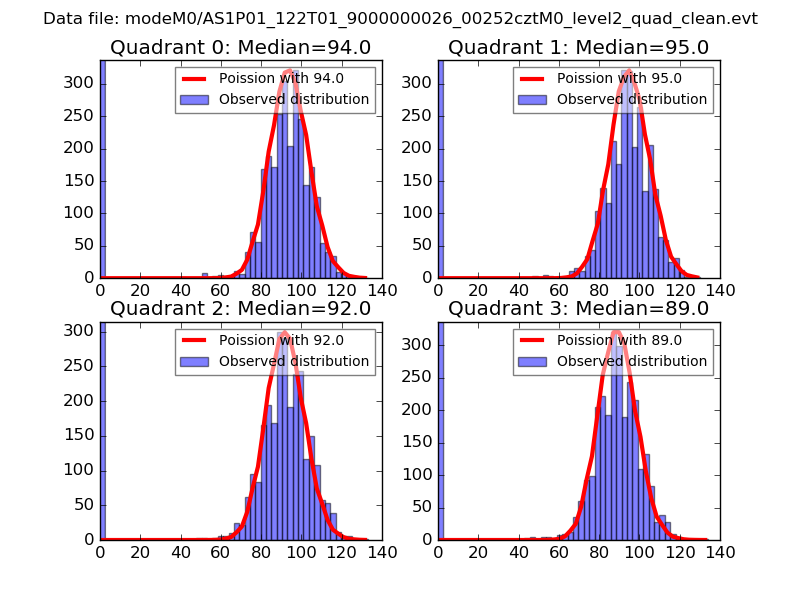 |
 |
| Quadrant-wise count rates Data is divided into 100 sec bins |
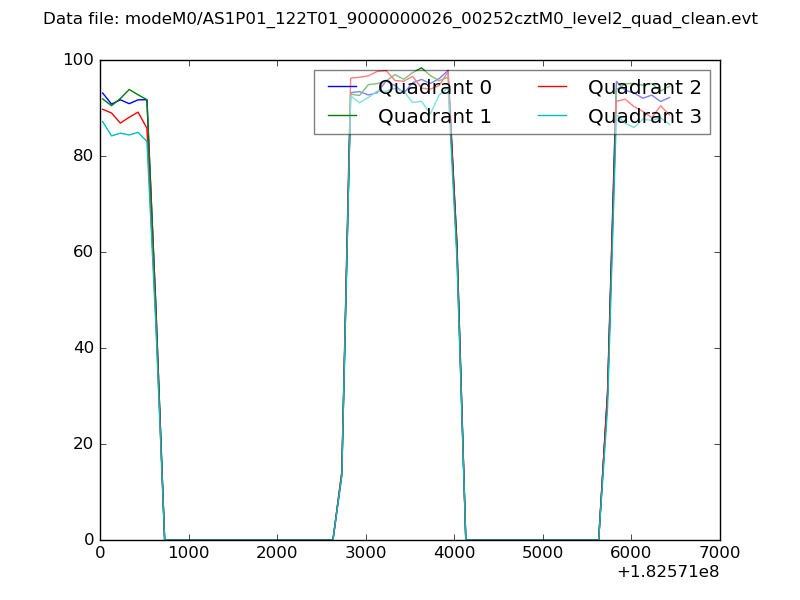 |
|
| Module-wise count rates for Quadrant A Data is divided into 100 sec bins |
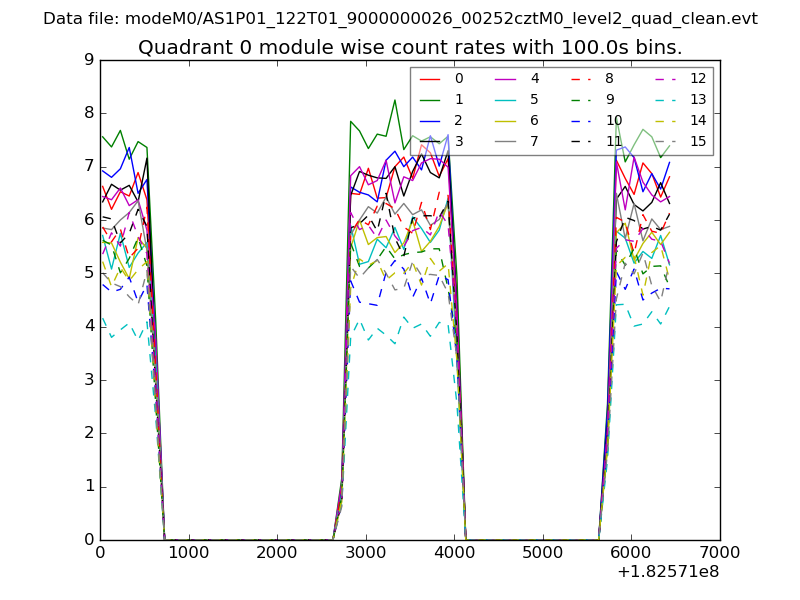 |
 |
| Module-wise count rates for Quadrant B Data is divided into 100 sec bins |
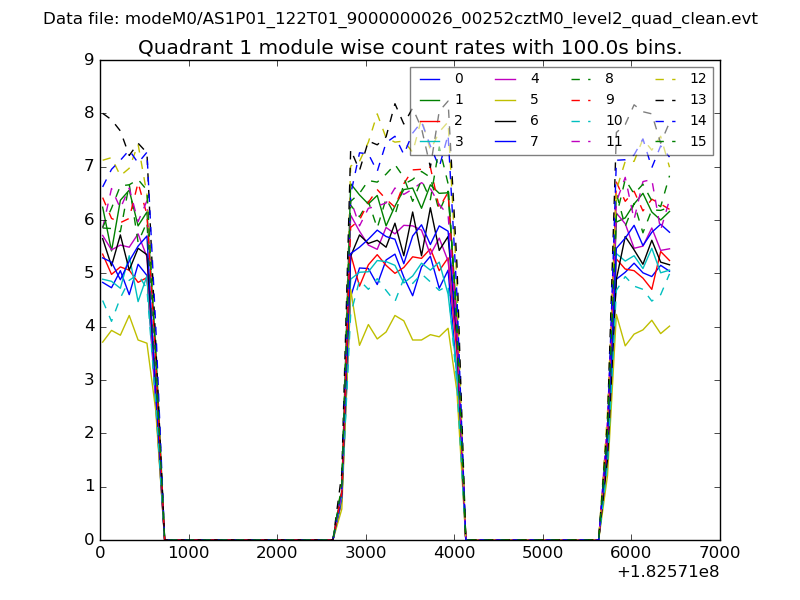 |
 |
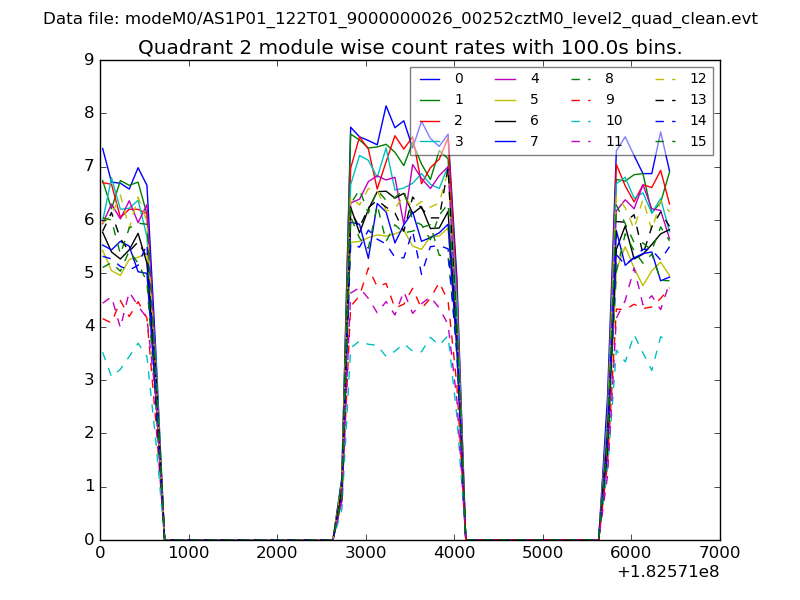
| Module-wise count rates for Quadrant C Data is divided into 100 sec bins |
 |
 |
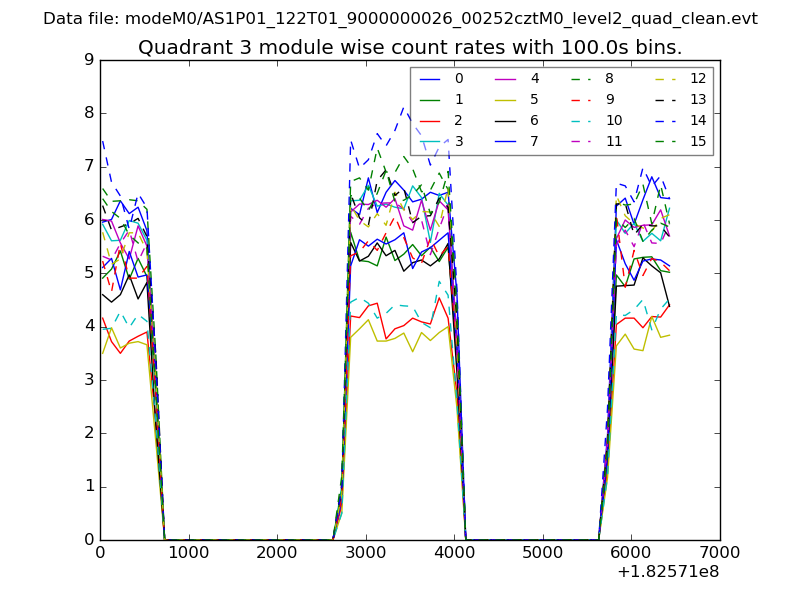
| Module-wise count rates for Quadrant D Data is divided into 100 sec bins |
 |
 |
| Parameter | Plot |
|---|---|
| CZT HV Monitor | 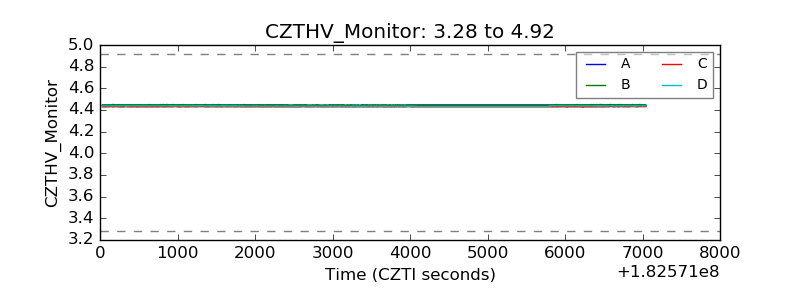 |
| D_VDD |  |
| Temperature 1 | 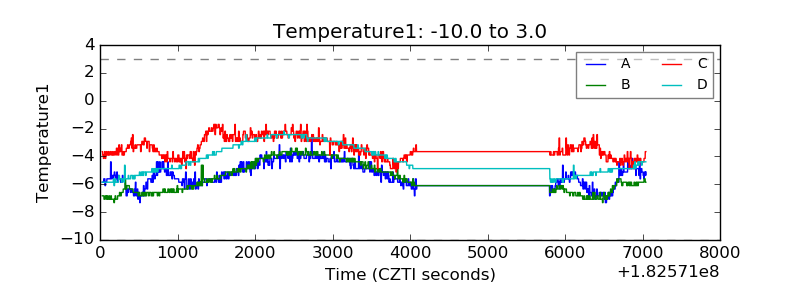 |
| Veto HV Monitor | 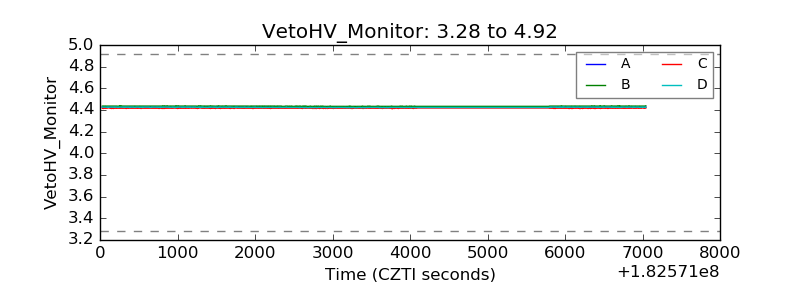 |
| Veto LLD | 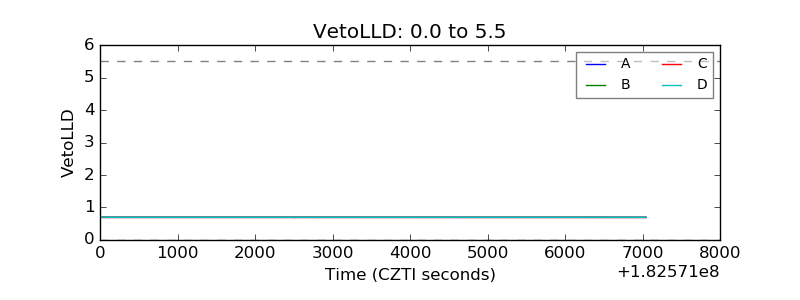 |
| Alpha Counter | 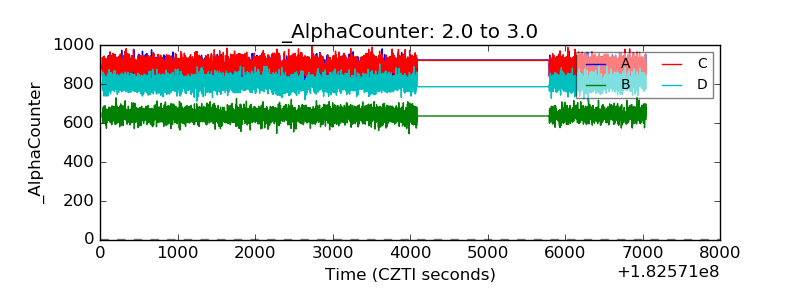 |
| _CPM_Rate | 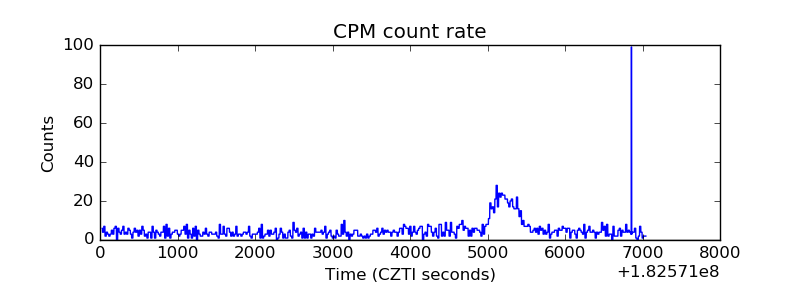 |
| CZT Counter | 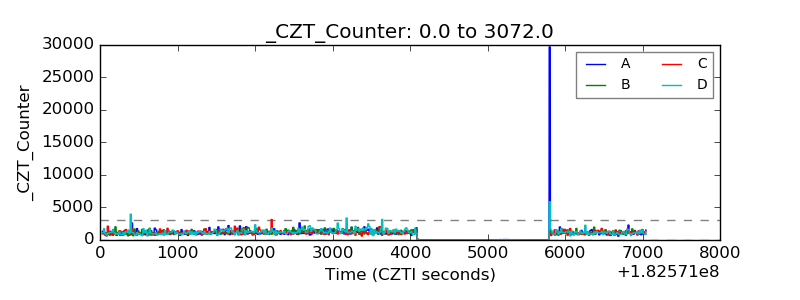 |
| +2.5 Volts monitor |  |
| +5 Volts monitor |  |
| _ROLL_ROT | 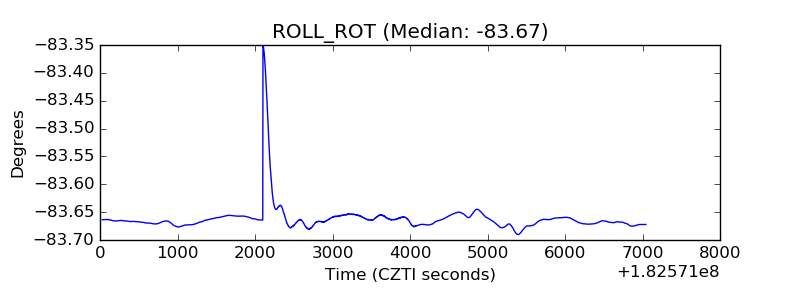 |
| _Roll_DEC | 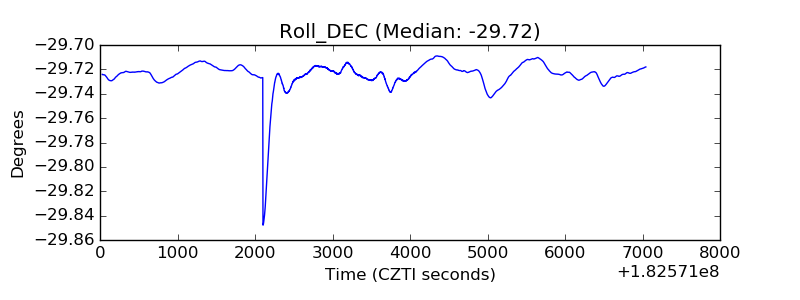 |
| _Roll_RA |  |
| Veto Counter | 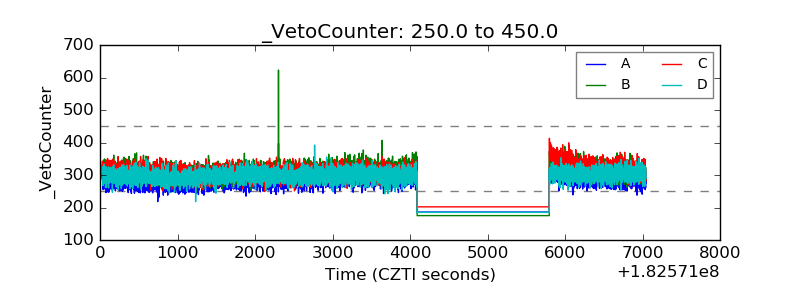 |