| Param | Original file | Final file |
|---|---|---|
| Filename | modeM0/AS1P01_122T02_9000000028_00260cztM0_level2.evt | modeM0/AS1P01_122T02_9000000028_00260cztM0_level2_quad_clean.evt |
| Size (bytes) | 920,767,680 | 67,173,120 |
| Size | 878.1 MB | 64.1 MB |
| Events in quadrant A | 6,590,318 | 422,073 |
| Events in quadrant B | 7,338,121 | 412,270 |
| Events in quadrant C | 6,287,070 | 414,006 |
| Events in quadrant D | 7,303,761 | 399,116 |
| Mode SS | |||
|---|---|---|---|
| Quadrant | BADHDUFLAG | Total packets | Discarded packets |
| A | 0 | 112 | 0 |
| B | 0 | 112 | 0 |
| C | 0 | 112 | 0 |
| D | 0 | 112 | 0 |
| Mode M0 | |||
|---|---|---|---|
| Quadrant | BADHDUFLAG | Total packets | Discarded packets |
| A | 0 | 23481 | 2 |
| B | 0 | 25739 | 1 |
| C | 0 | 22617 | 1 |
| D | 0 | 25592 | 1 |
| Mode M9 | |||
|---|---|---|---|
| Quadrant | BADHDUFLAG | Total packets | Discarded packets |
| A | 0 | 17 | 0 |
| B | 0 | 17 | 0 |
| C | 0 | 17 | 0 |
| D | 0 | 17 | 0 |
| Quadrant | Total seconds | Saturated seconds | Saturation percentage |
|---|---|---|---|
| A | 5523 | 3 | 0.054318% |
| B | 5523 | 199 | 3.603114% |
| C | 5523 | 6 | 0.108637% |
| D | 5523 | 68 | 1.231215% |
Noise dominated data is calculated using 1-second bins in cleaned event files. If a bin has >2000 counts, and if more than 50% of those come from <1% of pixels, then it is considered to be noise-dominated and hence unusable.
| Quadrant | # 1 sec bins | Bins with >0 counts | Bins with >2000 counts | High rate bins dominated by noise | Noise dominated (total time) | Noise dominated (detector-on time) | Marked lightcurve |
|---|---|---|---|---|---|---|---|
| A | 7228 | 5524 | 125 | 125 | 1.73% | 2.26% | 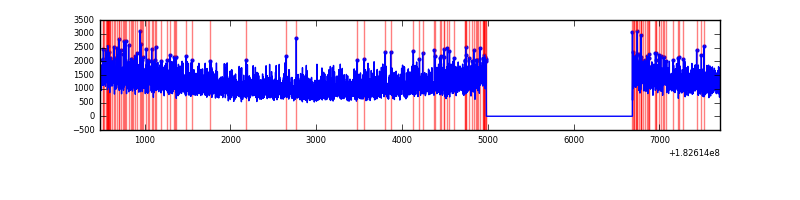 |
| B | 7228 | 5524 | 358 | 358 | 4.95% | 6.48% | 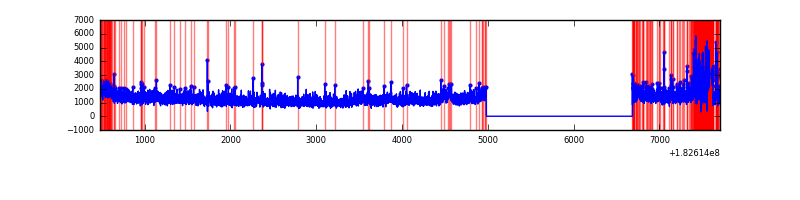 |
| C | 7228 | 5524 | 93 | 93 | 1.29% | 1.68% | 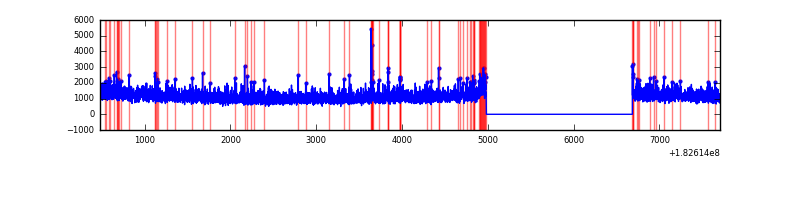 |
| D | 7228 | 5524 | 448 | 448 | 6.20% | 8.11% | 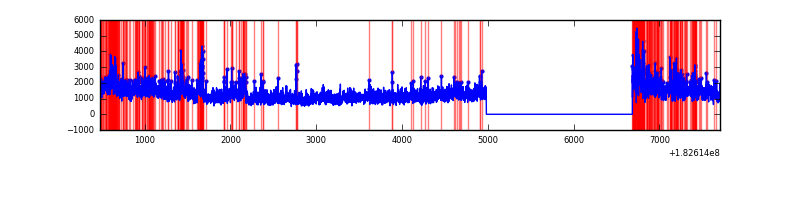 |
Top three noisy pixels from each quadrant. If the there are fewer than three noisy pixels in the level2.evt file, extra rows are filled as -1
| Pixel properties | Quadrant properties | ||||||
|---|---|---|---|---|---|---|---|
| Quadrant | DetID | PixID | Counts | Sigma | Mean | Median | Sigma |
| A | 15 | 250 | 19096 | 47.3 | 1693 | 1680 | 368.2 |
| A | 11 | 242 | 13813 | 32.95 | 1693 | 1680 | 368.2 |
| A | 0 | 96 | 7002 | 14.45 | 1693 | 1680 | 368.2 |
| B | 8 | 9 | 527695 | 1346.72 | 1678 | 1691 | 390.6 |
| B | 0 | 207 | 127038 | 320.92 | 1678 | 1691 | 390.6 |
| B | 10 | 14 | 87320 | 219.23 | 1678 | 1691 | 390.6 |
| C | 3 | 159 | 130317 | 297.48 | 1563 | 1624 | 432.6 |
| C | 0 | 206 | 7608 | 13.83 | 1563 | 1624 | 432.6 |
| C | 10 | 19 | 7261 | 13.03 | 1563 | 1624 | 432.6 |
| D | 10 | 154 | 976595 | 2100.14 | 1487 | 1543 | 464.3 |
| D | 1 | 4 | 355480 | 762.34 | 1487 | 1543 | 464.3 |
| D | 1 | 5 | 113728 | 241.63 | 1487 | 1543 | 464.3 |
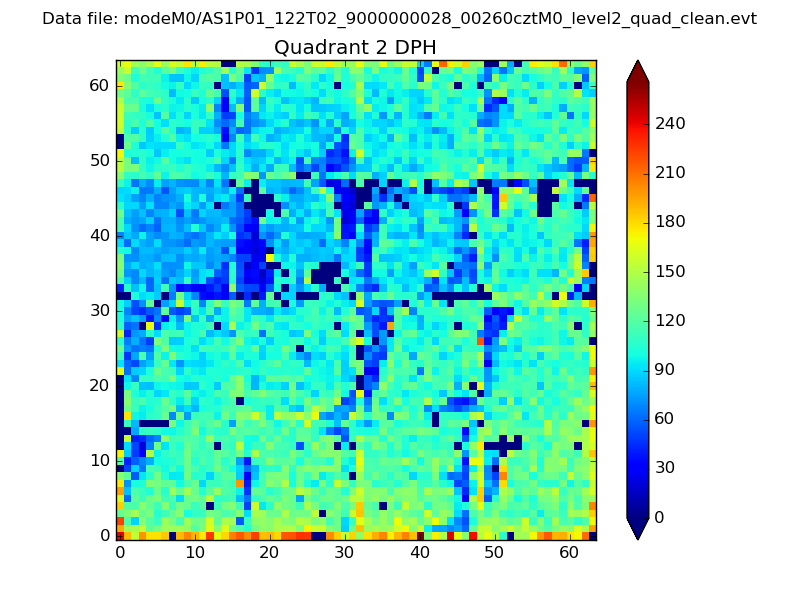
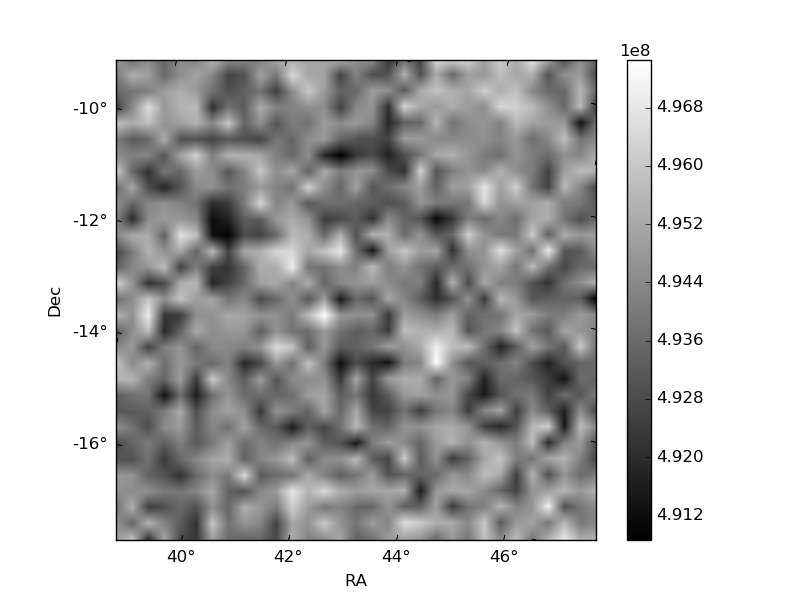
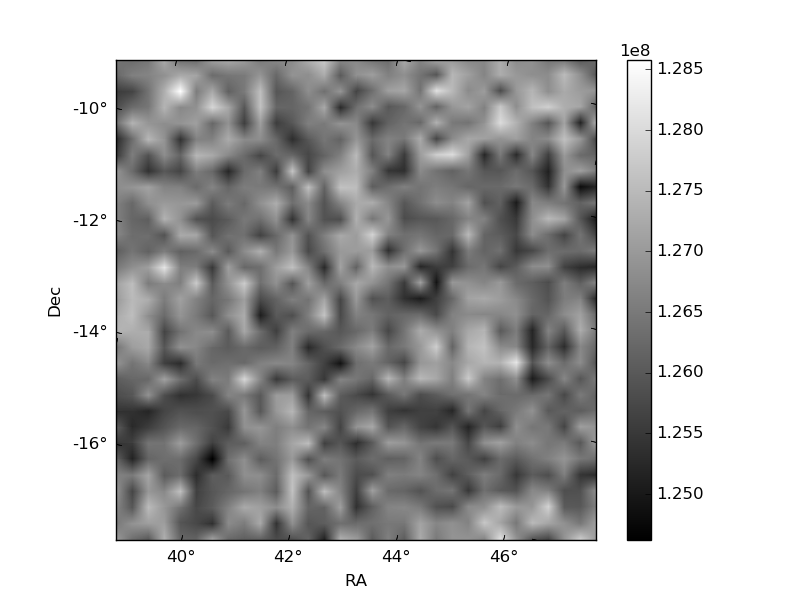
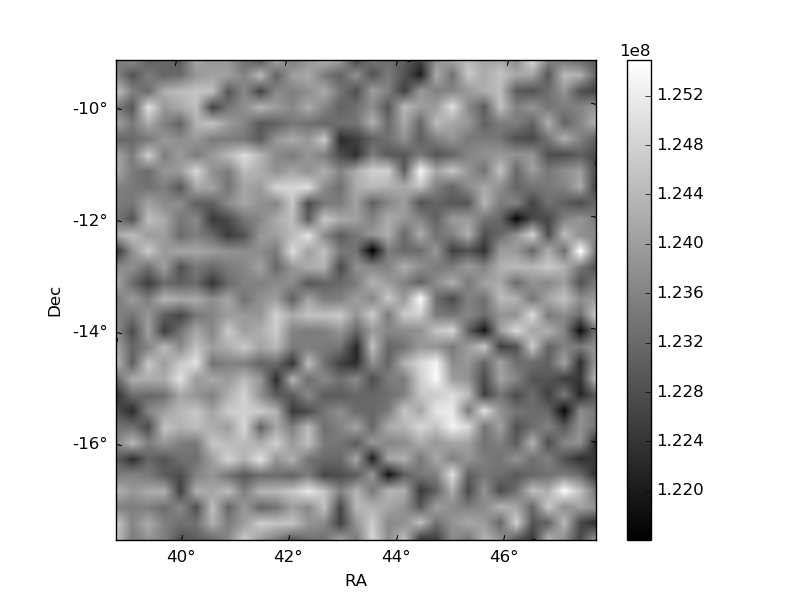
Histogram calculated using DETX and DETY for each event in the final _common_clean file
| Quadrant A | 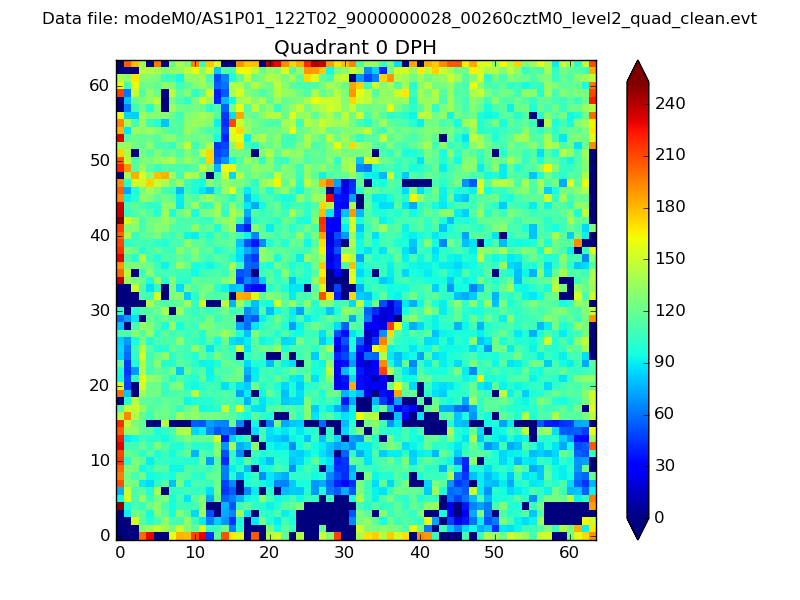 |
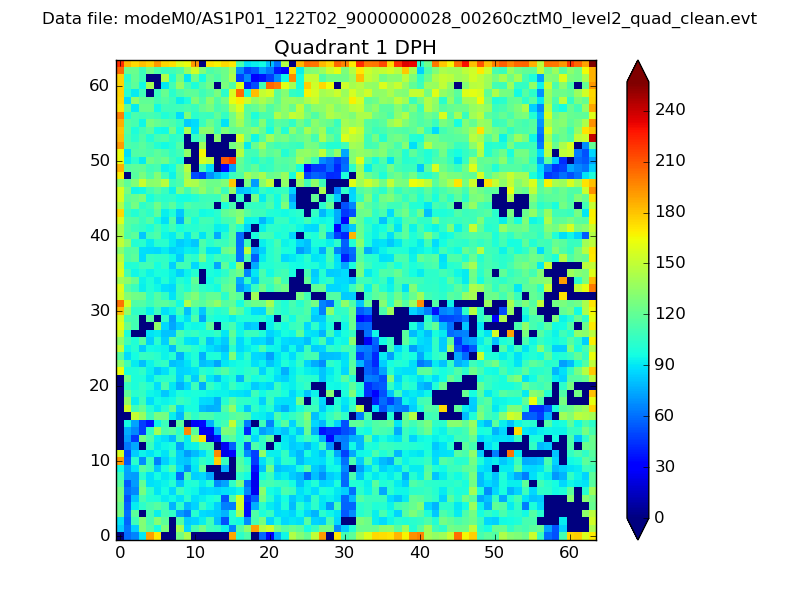 |
Quadrant B |
|---|---|---|---|
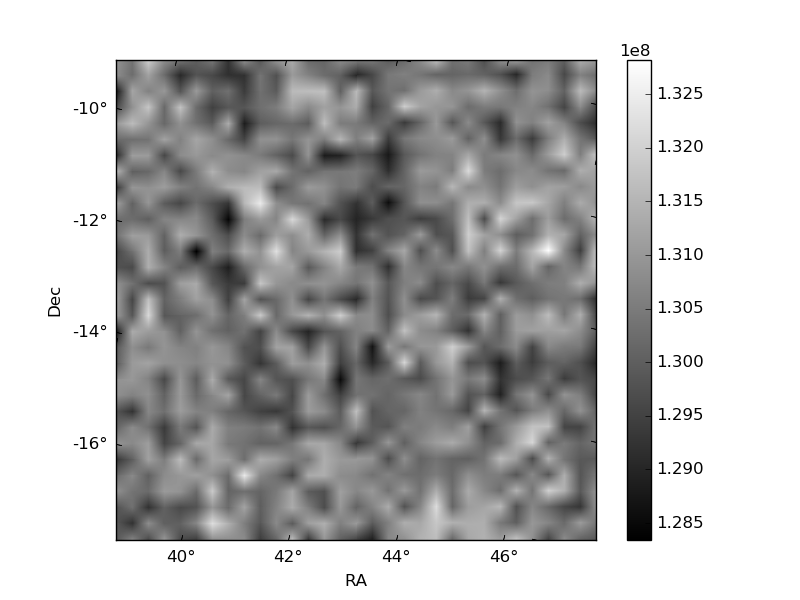
| Quadrant D | 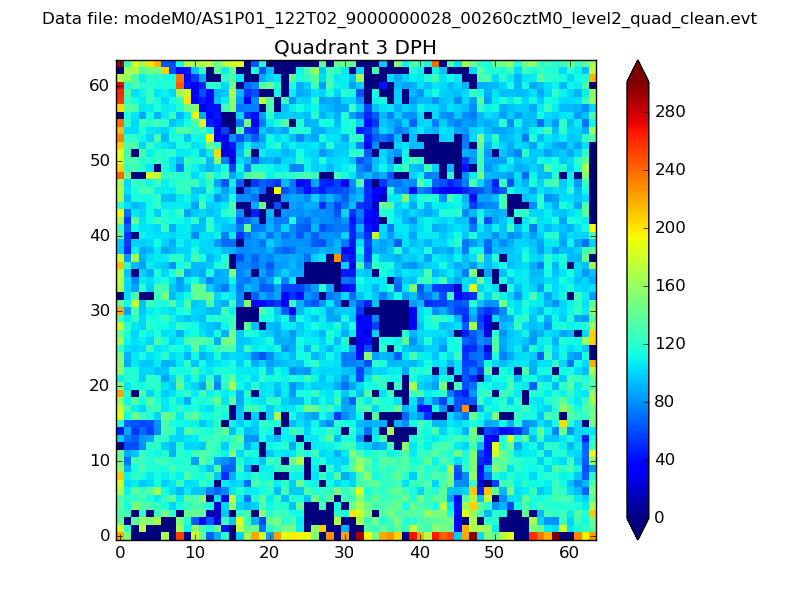 |
 |
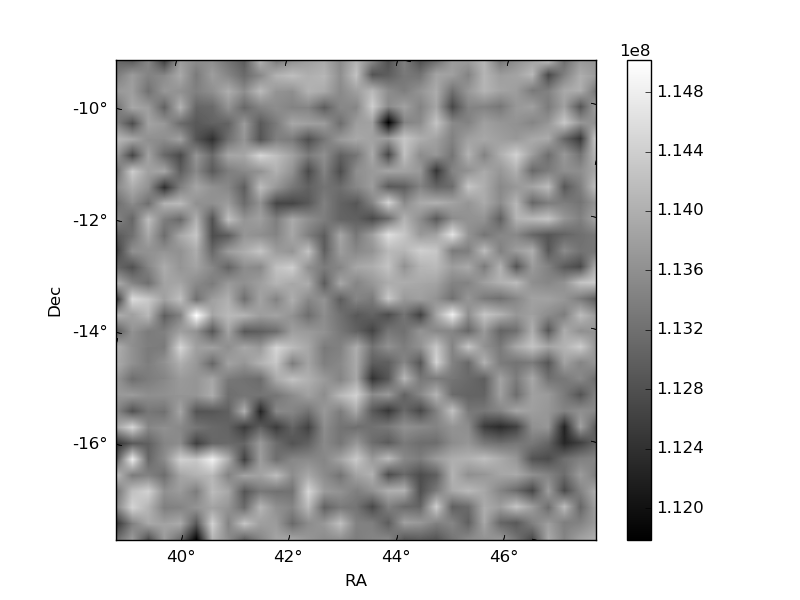
Quadrant C |
| Plot type | Count rate plots | Images |
|---|---|---|
| Comparison with Poisson distribution Blue bars denote a histogram of data divided into 1 sec bins. Red curve is a Poisson curve with rate = median count rate of data. |
 |
 |
| Quadrant-wise count rates Data is divided into 100 sec bins |
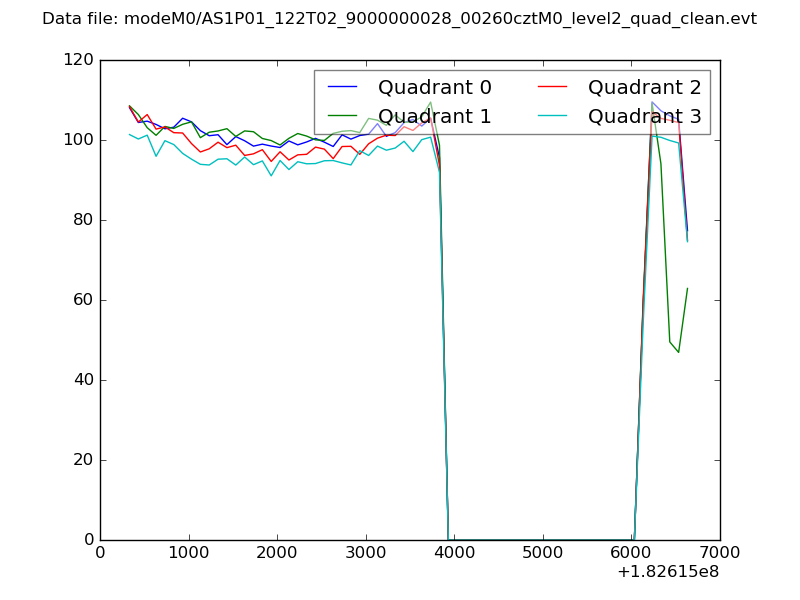 |
|
| Module-wise count rates for Quadrant A Data is divided into 100 sec bins |
 |
 |
| Module-wise count rates for Quadrant B Data is divided into 100 sec bins |
 |
 |
| Module-wise count rates for Quadrant C Data is divided into 100 sec bins |
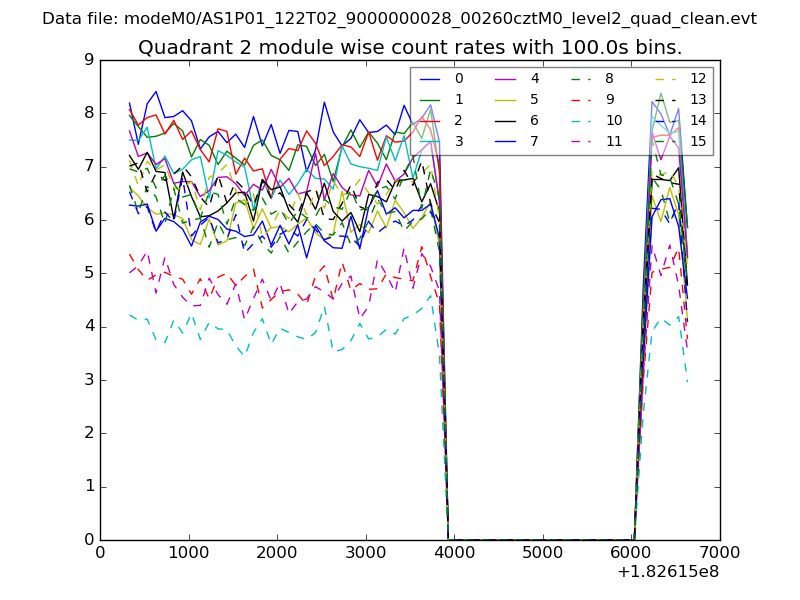 |
 |
| Module-wise count rates for Quadrant D Data is divided into 100 sec bins |
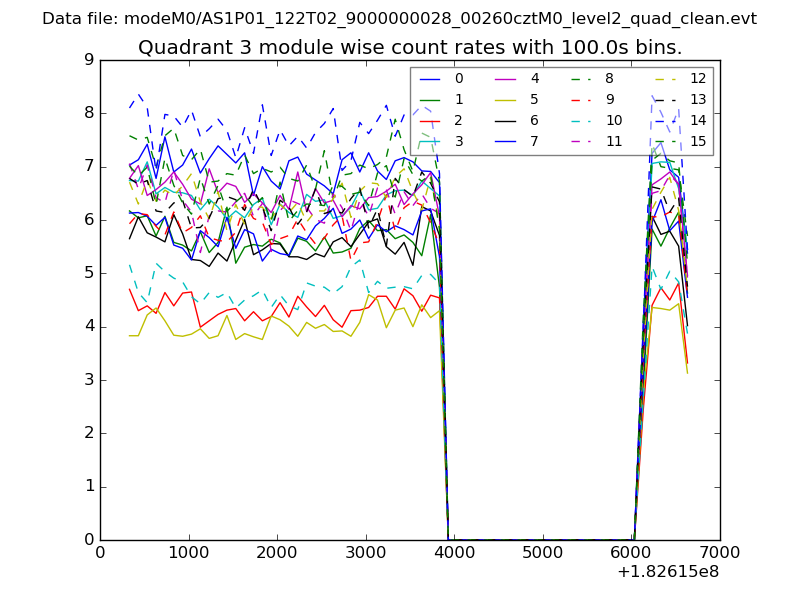 |
 |
| Parameter | Plot |
|---|---|
| CZT HV Monitor | 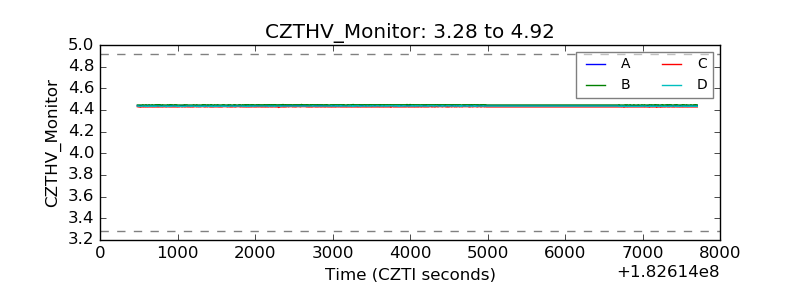 |
| D_VDD | 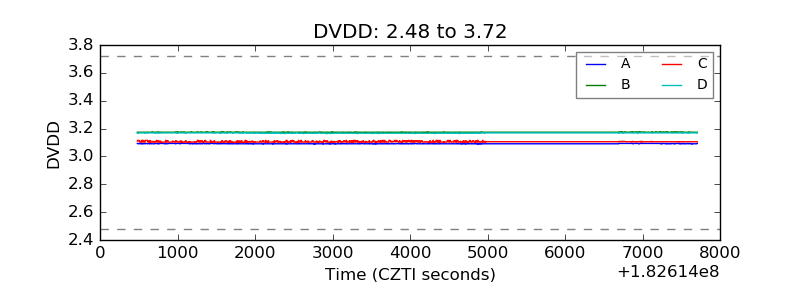 |
| Temperature 1 |  |
| Veto HV Monitor | 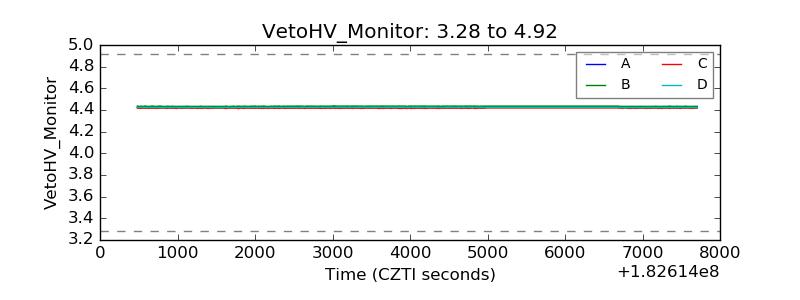 |
| Veto LLD |  |
| Alpha Counter | 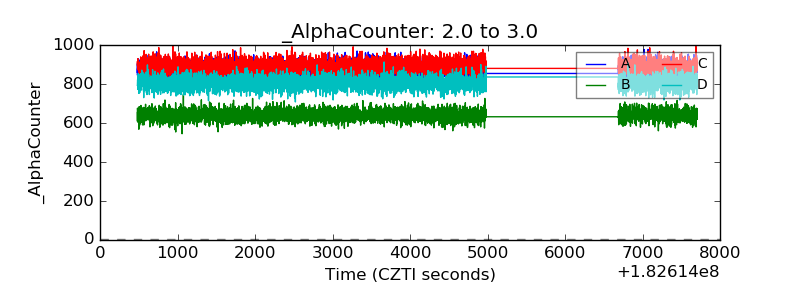 |
| _CPM_Rate | 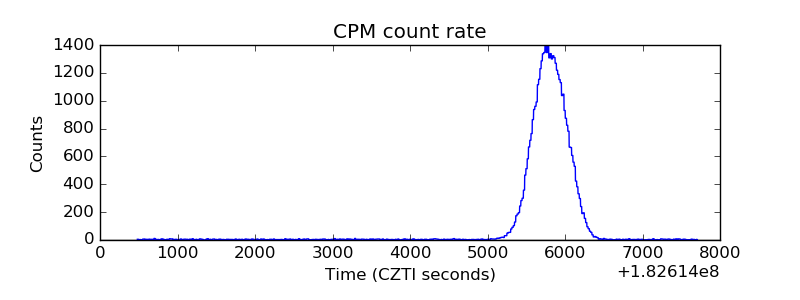 |
| CZT Counter | 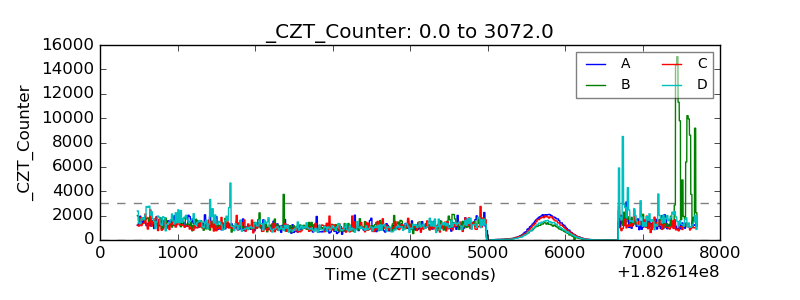 |
| +2.5 Volts monitor |  |
| +5 Volts monitor |  |
| _ROLL_ROT | 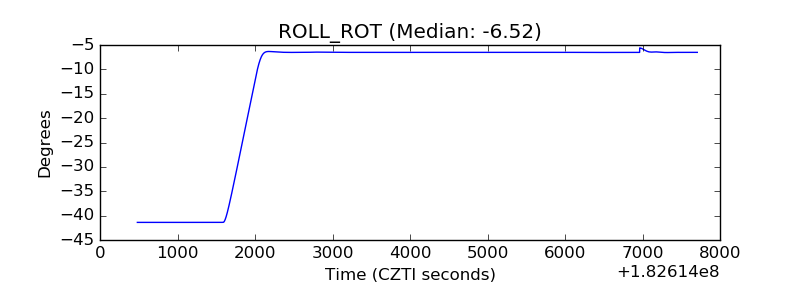 |
| _Roll_DEC |  |
| _Roll_RA | 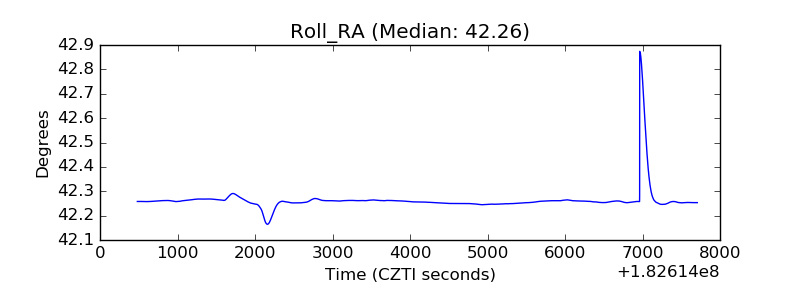 |
| Veto Counter | 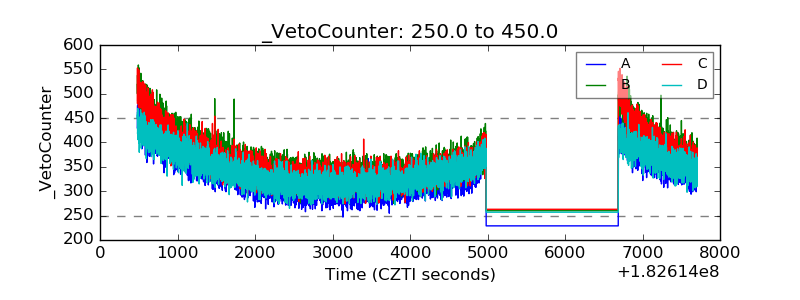 |