| Param | Original file | Final file |
|---|---|---|
| Filename | modeM0/AS1P01_122T02_9000000028_00261cztM0_level2.evt | modeM0/AS1P01_122T02_9000000028_00261cztM0_level2_quad_clean.evt |
| Size (bytes) | 1,121,731,200 | 67,343,040 |
| Size | 1.0 GB | 64.2 MB |
| Events in quadrant A | 6,502,277 | 458,880 |
| Events in quadrant B | 13,756,115 | 305,882 |
| Events in quadrant C | 6,274,897 | 450,291 |
| Events in quadrant D | 7,071,169 | 434,538 |
| Mode SS | |||
|---|---|---|---|
| Quadrant | BADHDUFLAG | Total packets | Discarded packets |
| A | 0 | 112 | 0 |
| B | 0 | 112 | 0 |
| C | 0 | 112 | 0 |
| D | 0 | 112 | 0 |
| Mode M0 | |||
|---|---|---|---|
| Quadrant | BADHDUFLAG | Total packets | Discarded packets |
| A | 0 | 23265 | 3 |
| B | 0 | 45256 | 2 |
| C | 0 | 22565 | 2 |
| D | 0 | 24972 | 2 |
| Mode M9 | |||
|---|---|---|---|
| Quadrant | BADHDUFLAG | Total packets | Discarded packets |
| A | 0 | 18 | 0 |
| B | 0 | 18 | 0 |
| C | 0 | 18 | 0 |
| D | 0 | 18 | 0 |
| Quadrant | Total seconds | Saturated seconds | Saturation percentage |
|---|---|---|---|
| A | 5552 | 4 | 0.072046% |
| B | 5552 | 3023 | 54.448847% |
| C | 5552 | 4 | 0.072046% |
| D | 5552 | 55 | 0.990634% |
Noise dominated data is calculated using 1-second bins in cleaned event files. If a bin has >2000 counts, and if more than 50% of those come from <1% of pixels, then it is considered to be noise-dominated and hence unusable.
| Quadrant | # 1 sec bins | Bins with >0 counts | Bins with >2000 counts | High rate bins dominated by noise | Noise dominated (total time) | Noise dominated (detector-on time) | Marked lightcurve |
|---|---|---|---|---|---|---|---|
| A | 7257 | 5553 | 113 | 113 | 1.56% | 2.03% | 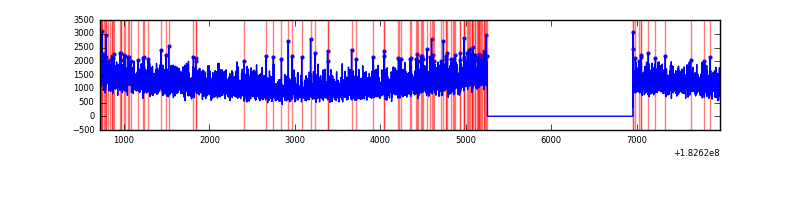 |
| B | 7257 | 5553 | 3632 | 3632 | 50.05% | 65.41% | 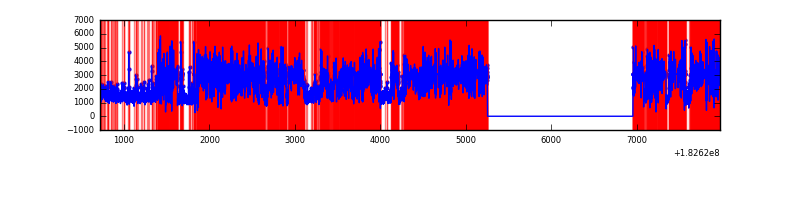 |
| C | 7257 | 5553 | 67 | 67 | 0.92% | 1.21% | 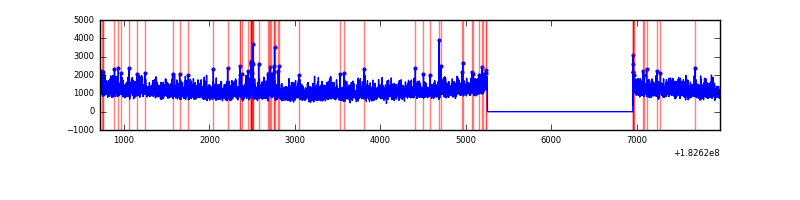 |
| D | 7257 | 5553 | 348 | 348 | 4.80% | 6.27% | 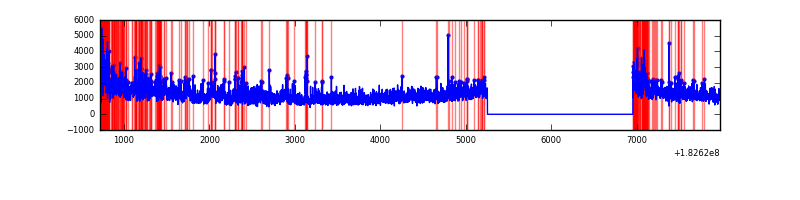 |
Top three noisy pixels from each quadrant. If the there are fewer than three noisy pixels in the level2.evt file, extra rows are filled as -1
| Pixel properties | Quadrant properties | ||||||
|---|---|---|---|---|---|---|---|
| Quadrant | DetID | PixID | Counts | Sigma | Mean | Median | Sigma |
| A | 15 | 250 | 16768 | 41.38 | 1669 | 1656 | 365.2 |
| A | 0 | 96 | 9288 | 20.9 | 1669 | 1656 | 365.2 |
| A | 15 | 17 | 9054 | 20.26 | 1669 | 1656 | 365.2 |
| B | 8 | 9 | 7820531 | 26392.03 | 1272 | 1275 | 296.3 |
| B | 0 | 207 | 864624 | 2914.03 | 1272 | 1275 | 296.3 |
| B | 8 | 54 | 60982 | 201.53 | 1272 | 1275 | 296.3 |
| C | 3 | 159 | 174335 | 401.96 | 1544 | 1605 | 429.7 |
| C | 1 | 192 | 17026 | 35.89 | 1544 | 1605 | 429.7 |
| C | 2 | 192 | 11563 | 23.17 | 1544 | 1605 | 429.7 |
| D | 10 | 154 | 743001 | 1609.33 | 1468 | 1522 | 460.7 |
| D | 1 | 4 | 323222 | 698.23 | 1468 | 1522 | 460.7 |
| D | 1 | 5 | 162587 | 349.58 | 1468 | 1522 | 460.7 |
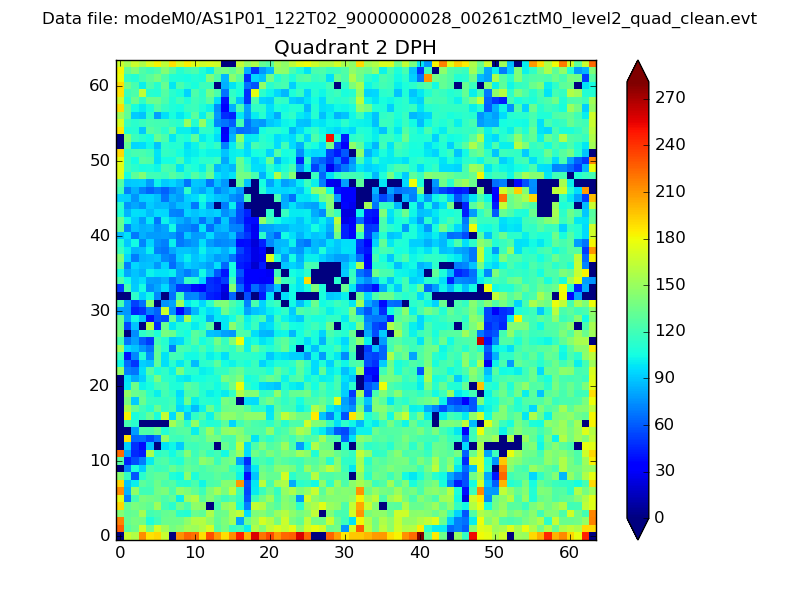
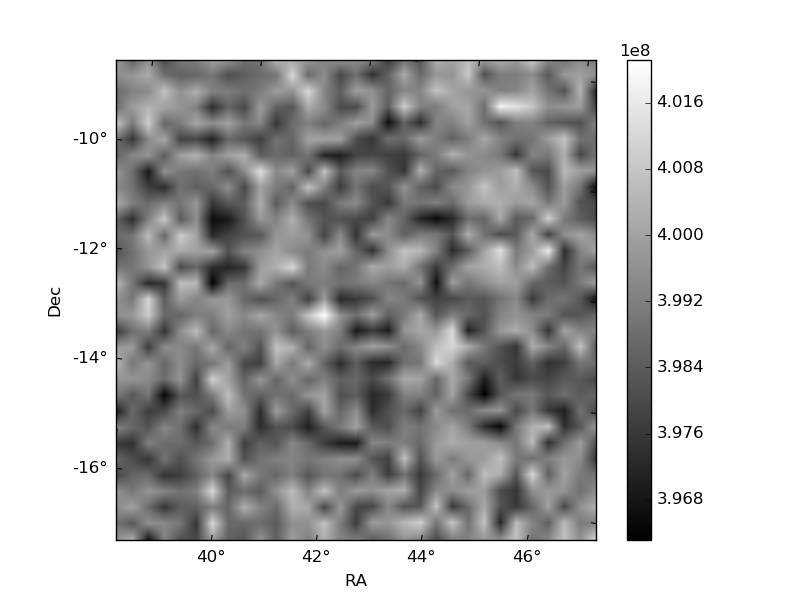
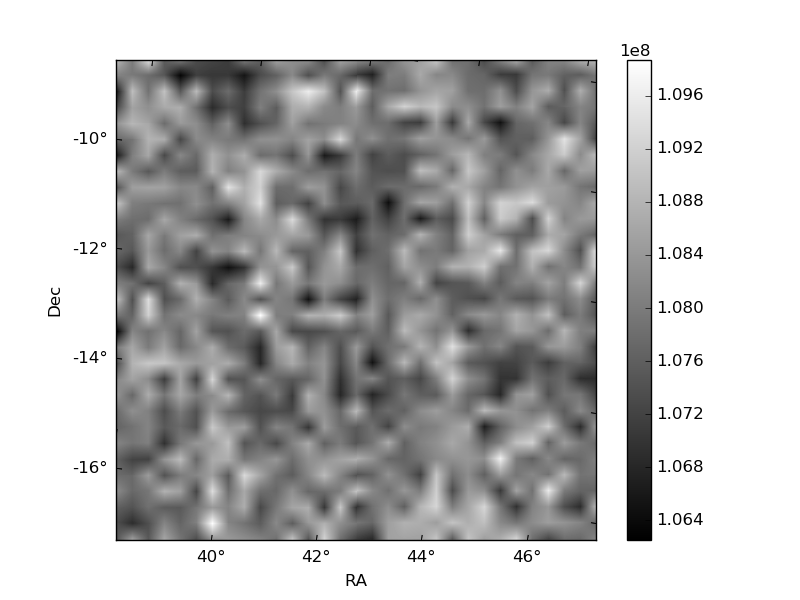
Histogram calculated using DETX and DETY for each event in the final _common_clean file
| Quadrant A | 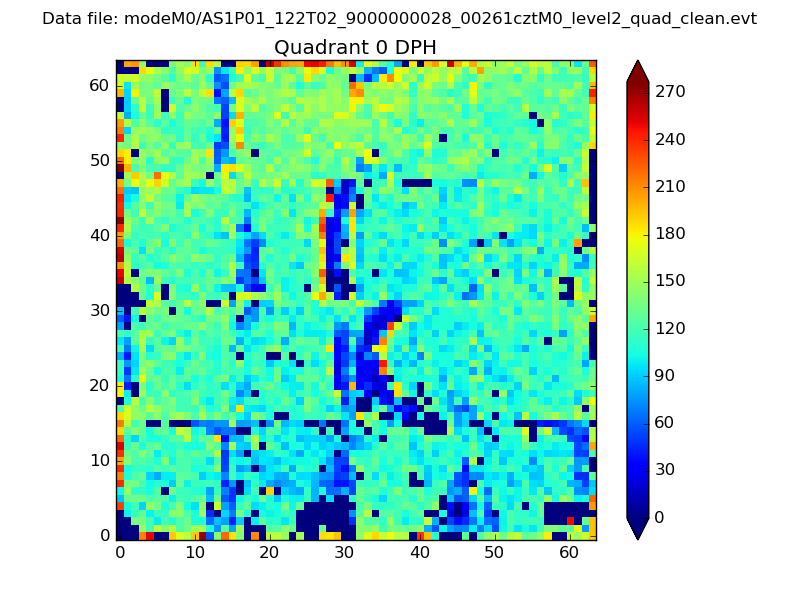 |
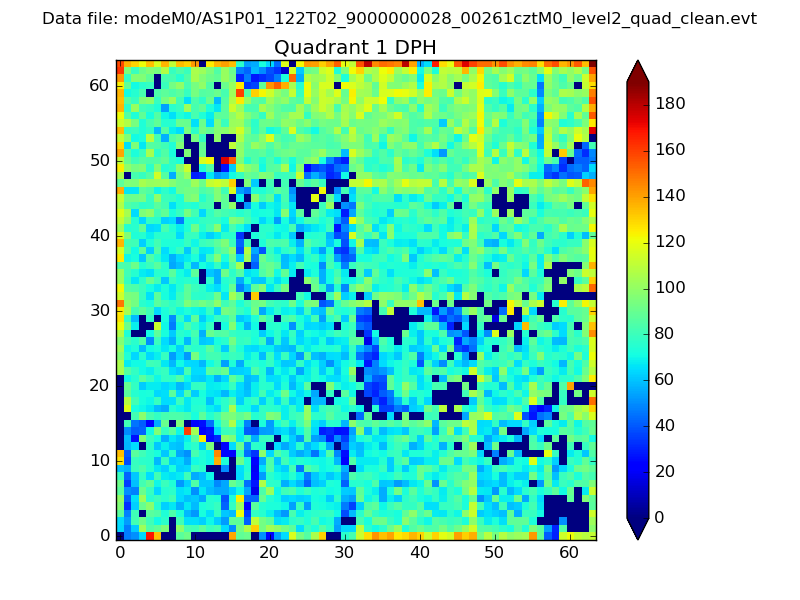 |
Quadrant B |
|---|---|---|---|
| Quadrant D | 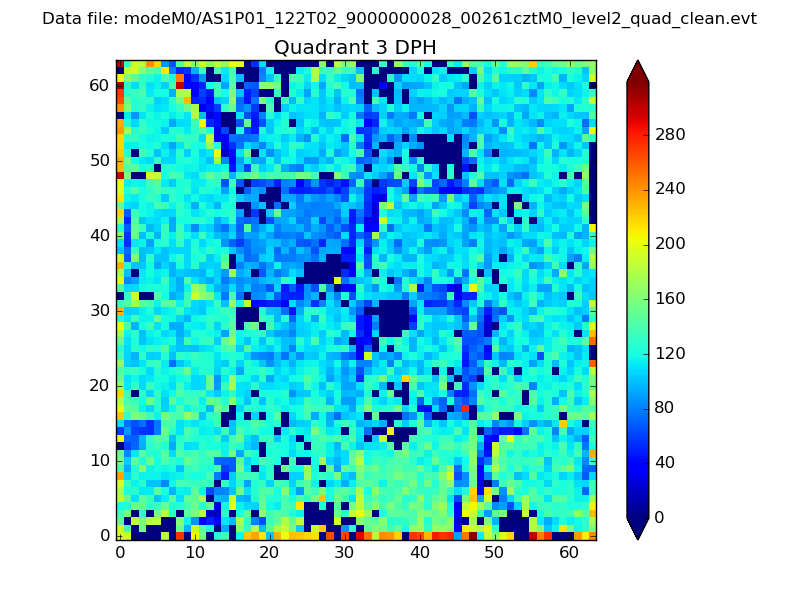 |
 |
Quadrant C |
| Plot type | Count rate plots | Images |
|---|---|---|
| Comparison with Poisson distribution Blue bars denote a histogram of data divided into 1 sec bins. Red curve is a Poisson curve with rate = median count rate of data. |
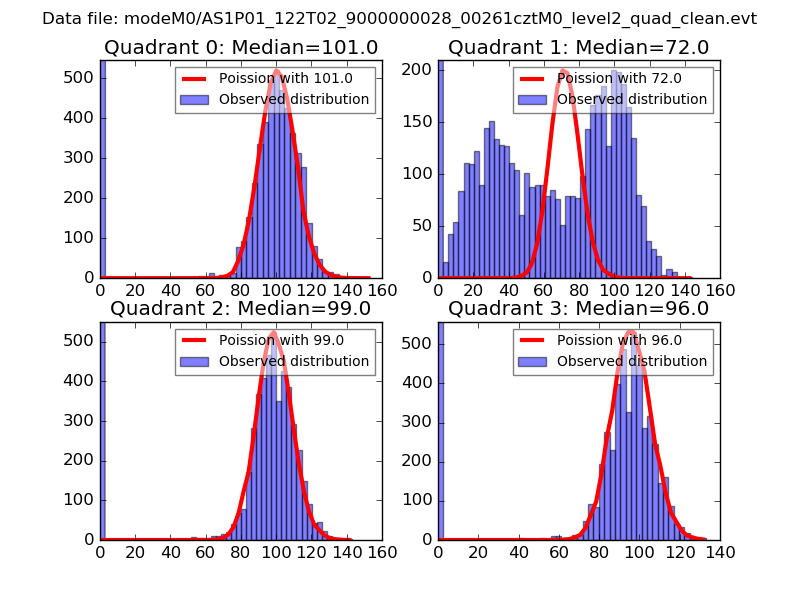 |
 |
| Quadrant-wise count rates Data is divided into 100 sec bins |
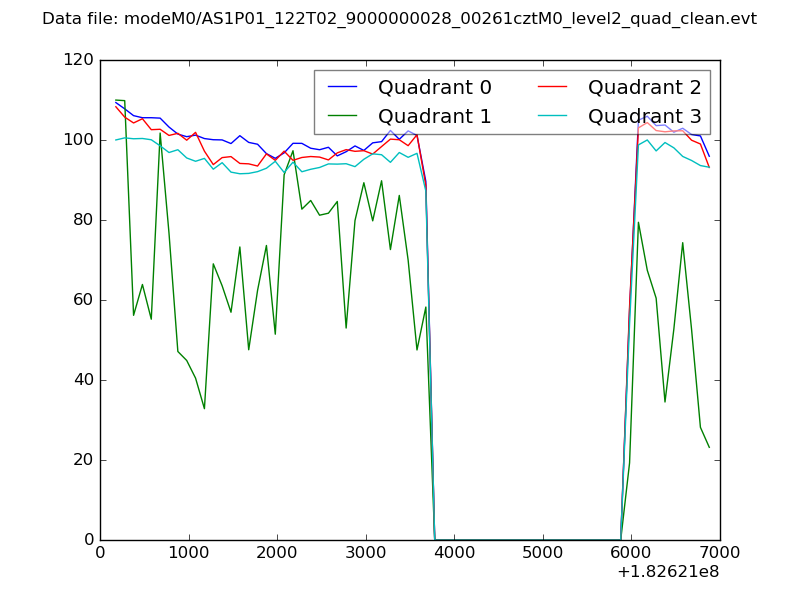 |
|
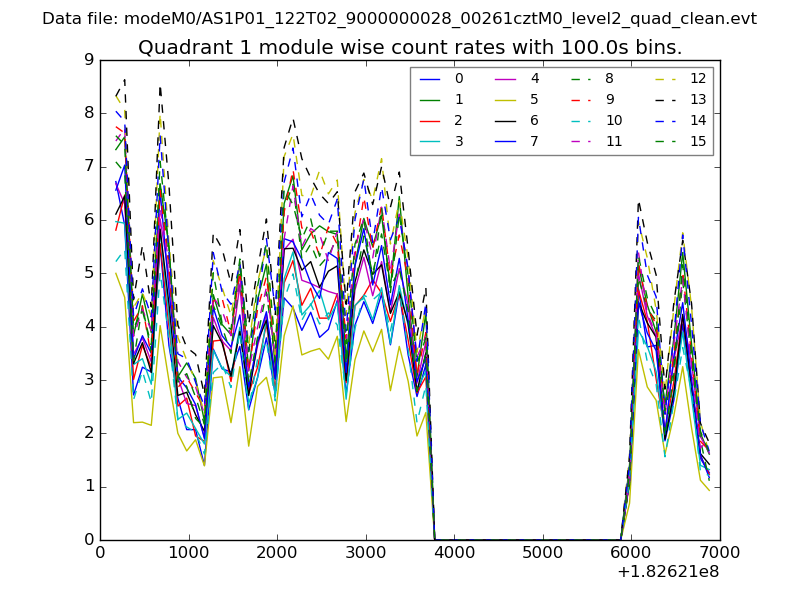
| Module-wise count rates for Quadrant A Data is divided into 100 sec bins |
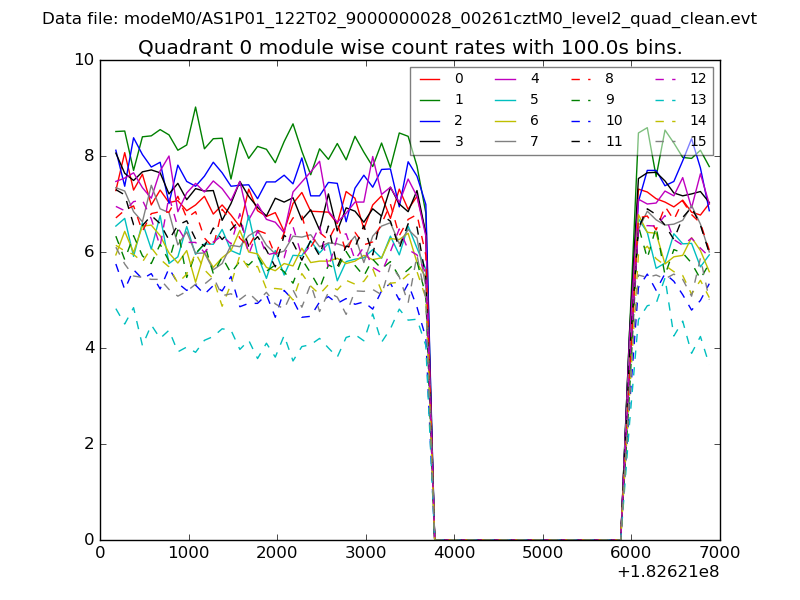 |
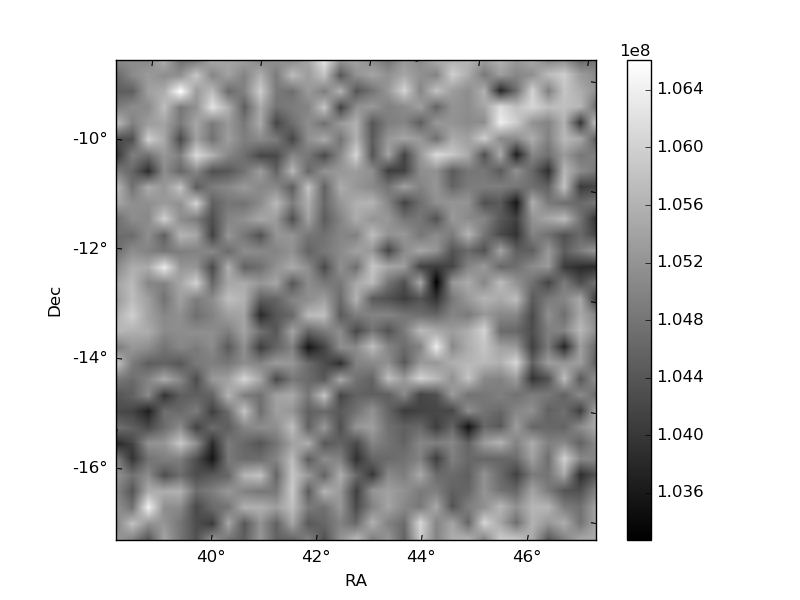 |
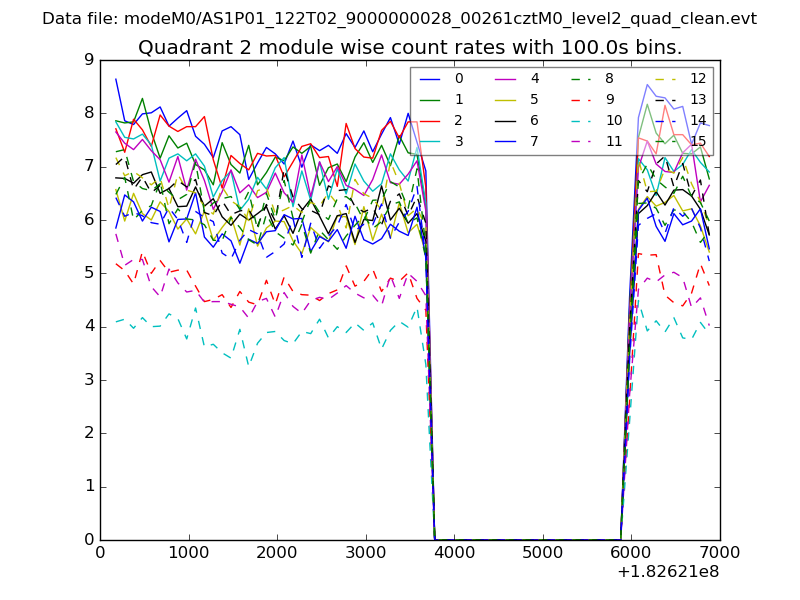
| Module-wise count rates for Quadrant B Data is divided into 100 sec bins |
 |
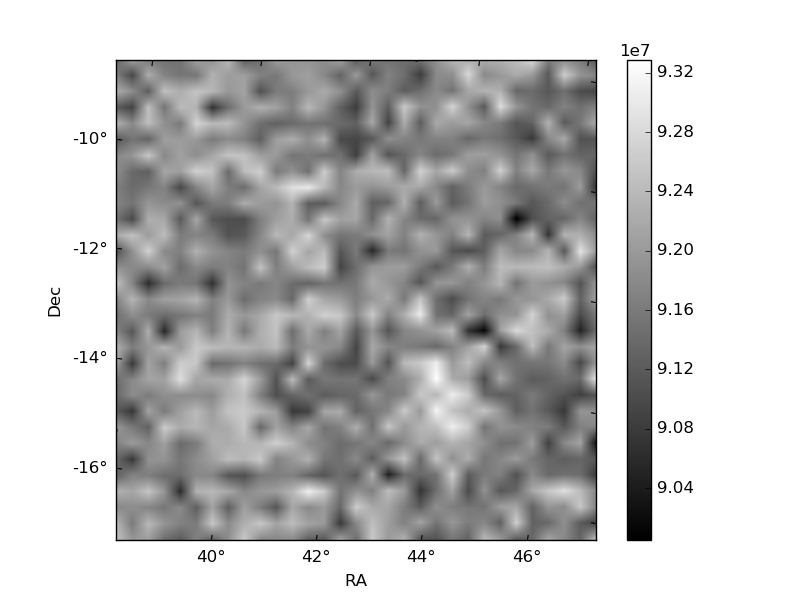 |
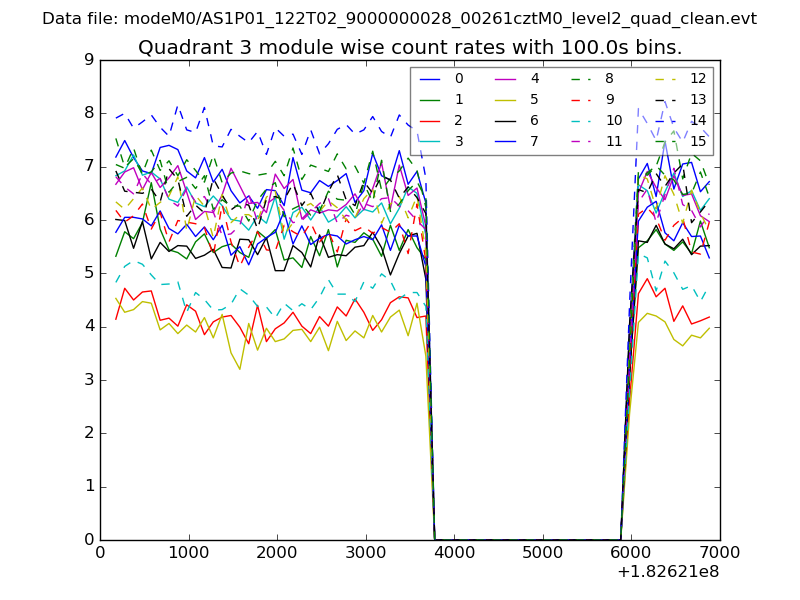
| Module-wise count rates for Quadrant C Data is divided into 100 sec bins |
 |
 |
| Module-wise count rates for Quadrant D Data is divided into 100 sec bins |
 |
 |
| Parameter | Plot |
|---|---|
| CZT HV Monitor | 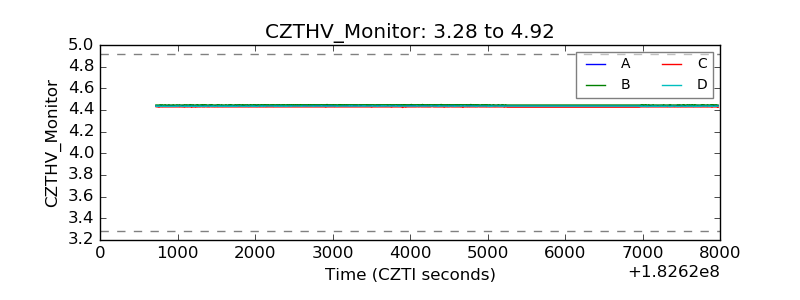 |
| D_VDD | 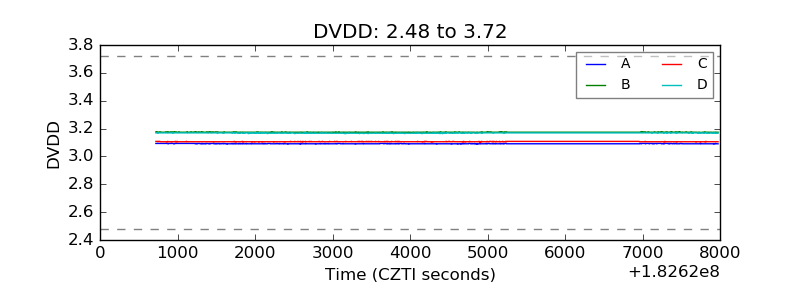 |
| Temperature 1 | 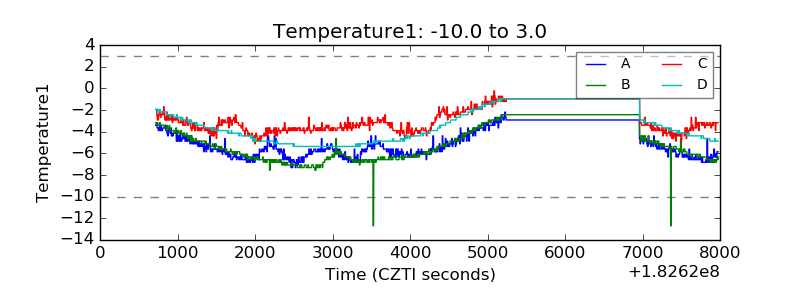 |
| Veto HV Monitor | 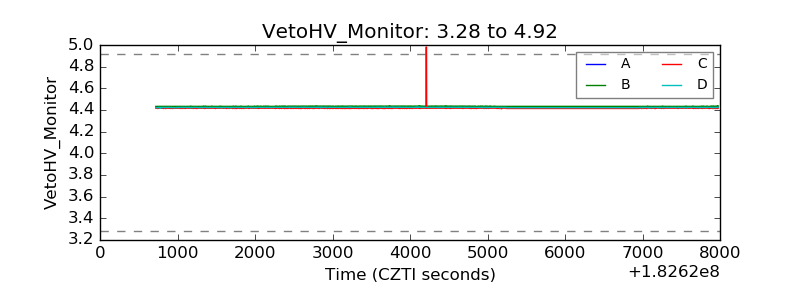 |
| Veto LLD |  |
| Alpha Counter | 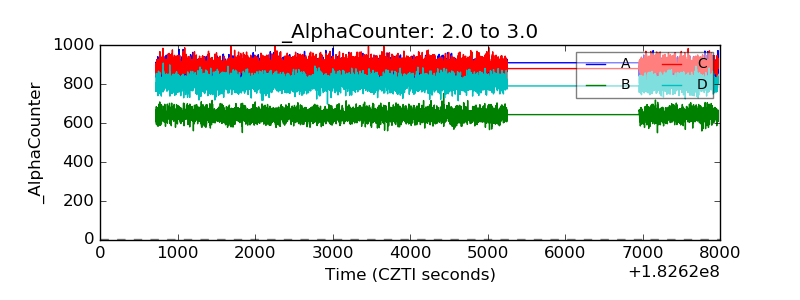 |
| _CPM_Rate | 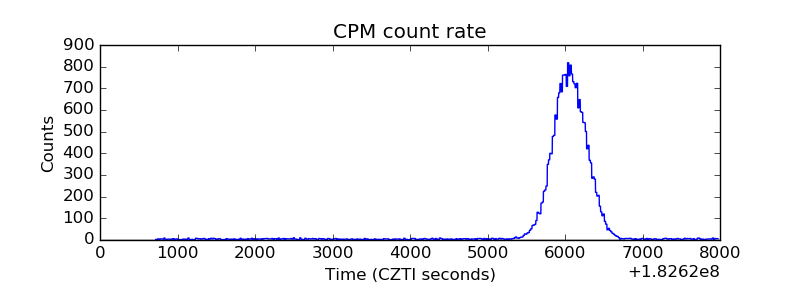 |
| CZT Counter | 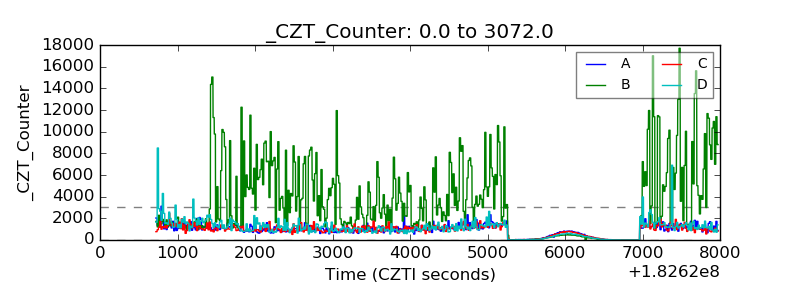 |
| +2.5 Volts monitor |  |
| +5 Volts monitor |  |
| _ROLL_ROT | 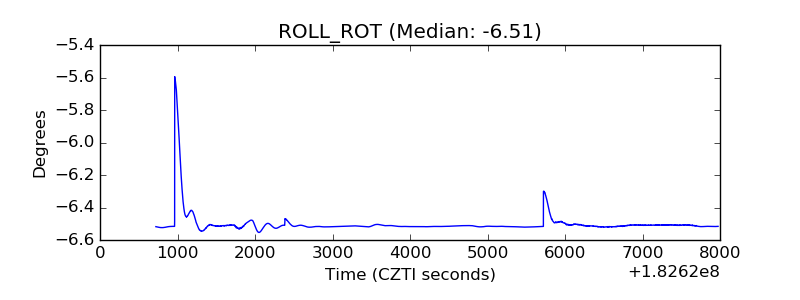 |
| _Roll_DEC | 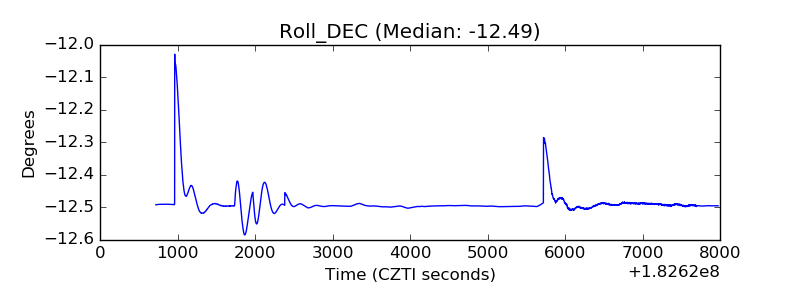 |
| _Roll_RA | 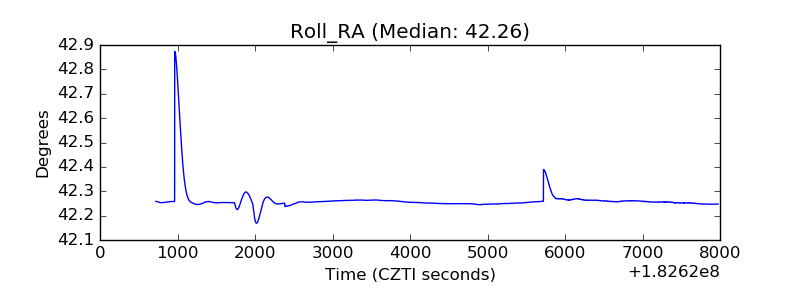 |
| Veto Counter | 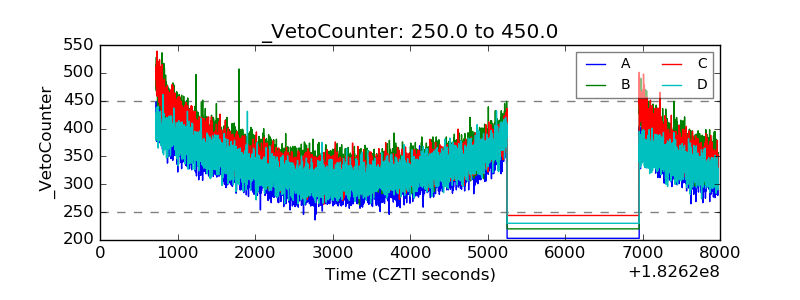 |