| Param | Original file | Final file |
|---|---|---|
| Filename | modeM0/AS1P01_122T02_9000000028_00264cztM0_level2.evt | modeM0/AS1P01_122T02_9000000028_00264cztM0_level2_quad_clean.evt |
| Size (bytes) | 750,162,240 | 46,261,440 |
| Size | 715.4 MB | 44.1 MB |
| Events in quadrant A | 5,485,043 | 270,128 |
| Events in quadrant B | 5,830,599 | 276,795 |
| Events in quadrant C | 5,373,694 | 267,065 |
| Events in quadrant D | 5,717,803 | 257,345 |
| Mode SS | |||
|---|---|---|---|
| Quadrant | BADHDUFLAG | Total packets | Discarded packets |
| A | 0 | 105 | 7 |
| B | 0 | 103 | 7 |
| C | 0 | 103 | 5 |
| D | 0 | 105 | 7 |
| Mode M0 | |||
|---|---|---|---|
| Quadrant | BADHDUFLAG | Total packets | Discarded packets |
| A | 0 | 20852 | 1232 |
| B | 0 | 21844 | 1172 |
| C | 0 | 20517 | 1242 |
| D | 0 | 21581 | 1257 |
| Mode M9 | |||
|---|---|---|---|
| Quadrant | BADHDUFLAG | Total packets | Discarded packets |
| A | 0 | 18 | 0 |
| B | 0 | 18 | 0 |
| C | 0 | 18 | 0 |
| D | 0 | 19 | 0 |
| Quadrant | Total seconds | Saturated seconds | Saturation percentage |
|---|---|---|---|
| A | 4675 | 4 | 0.085561% |
| B | 4687 | 9 | 0.192020% |
| C | 4672 | 11 | 0.235445% |
| D | 4673 | 13 | 0.278194% |
Noise dominated data is calculated using 1-second bins in cleaned event files. If a bin has >2000 counts, and if more than 50% of those come from <1% of pixels, then it is considered to be noise-dominated and hence unusable.
| Quadrant | # 1 sec bins | Bins with >0 counts | Bins with >2000 counts | High rate bins dominated by noise | Noise dominated (total time) | Noise dominated (detector-on time) | Marked lightcurve |
|---|---|---|---|---|---|---|---|
| A | 7341 | 4701 | 97 | 97 | 1.32% | 2.06% | 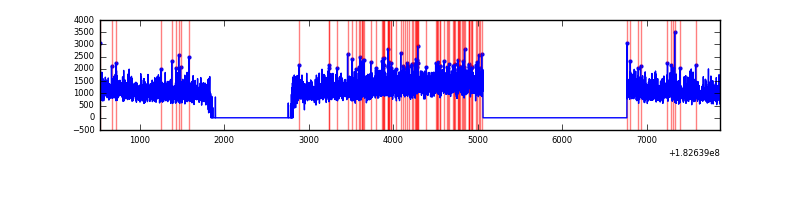 |
| B | 7341 | 4714 | 189 | 189 | 2.57% | 4.01% | 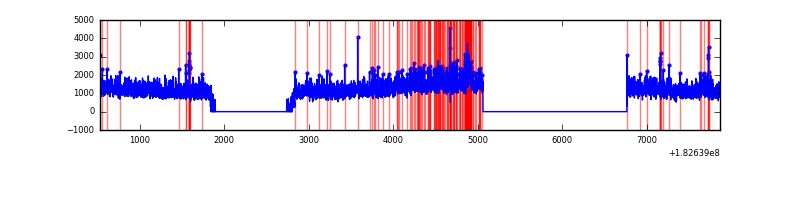 |
| C | 7341 | 4695 | 107 | 107 | 1.46% | 2.28% | 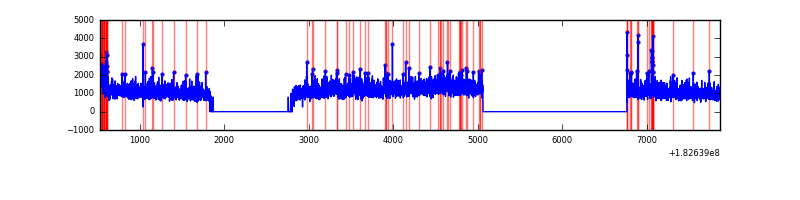 |
| D | 7341 | 4695 | 192 | 192 | 2.62% | 4.09% | 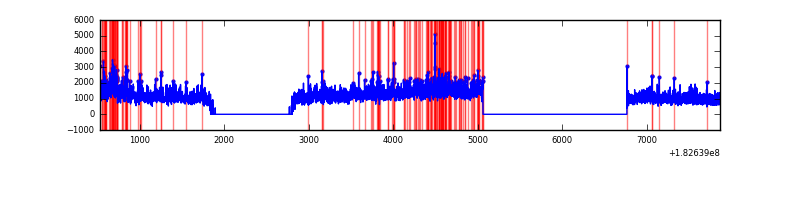 |
Top three noisy pixels from each quadrant. If the there are fewer than three noisy pixels in the level2.evt file, extra rows are filled as -1
| Pixel properties | Quadrant properties | ||||||
|---|---|---|---|---|---|---|---|
| Quadrant | DetID | PixID | Counts | Sigma | Mean | Median | Sigma |
| A | 15 | 250 | 19165 | 57.66 | 1401 | 1390 | 308.3 |
| A | 13 | 17 | 15734 | 46.53 | 1401 | 1390 | 308.3 |
| A | 12 | 149 | 15282 | 45.06 | 1401 | 1390 | 308.3 |
| B | 7 | 220 | 117746 | 348.85 | 1417 | 1425 | 333.4 |
| B | 8 | 6 | 64043 | 187.79 | 1417 | 1425 | 333.4 |
| B | 8 | 82 | 47890 | 139.35 | 1417 | 1425 | 333.4 |
| C | 9 | 68 | 127025 | 345.9 | 1292 | 1344 | 363.3 |
| C | 9 | 54 | 66089 | 178.19 | 1292 | 1344 | 363.3 |
| C | 1 | 192 | 34882 | 92.3 | 1292 | 1344 | 363.3 |
| D | 10 | 154 | 431133 | 1111.98 | 1239 | 1288 | 386.6 |
| D | 12 | 196 | 147640 | 378.6 | 1239 | 1288 | 386.6 |
| D | 1 | 4 | 117565 | 300.8 | 1239 | 1288 | 386.6 |
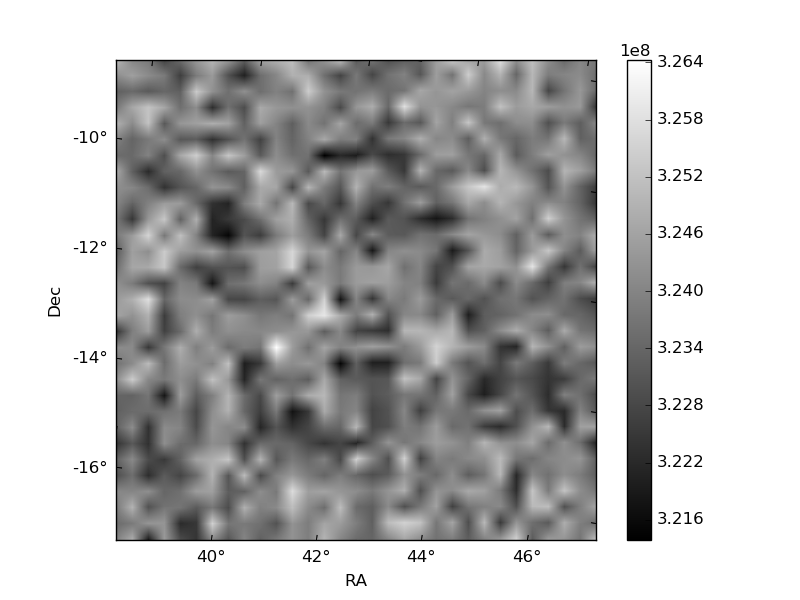
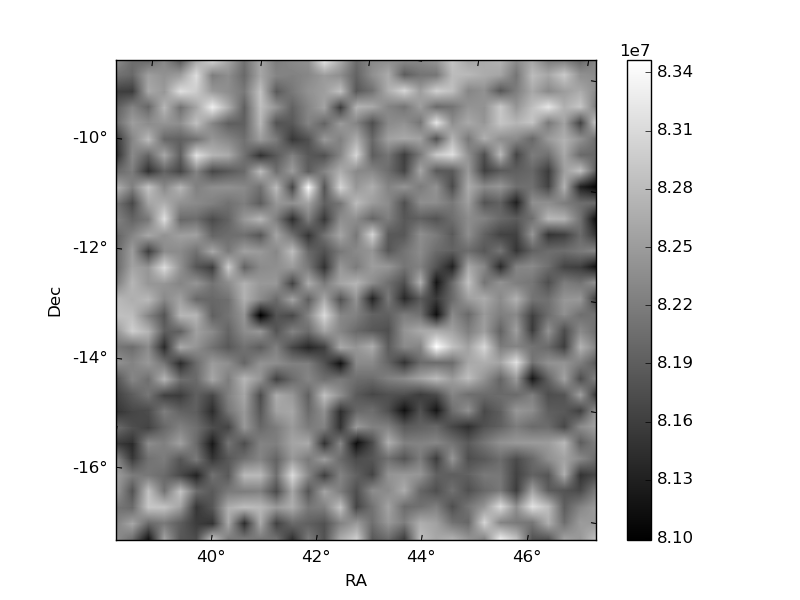
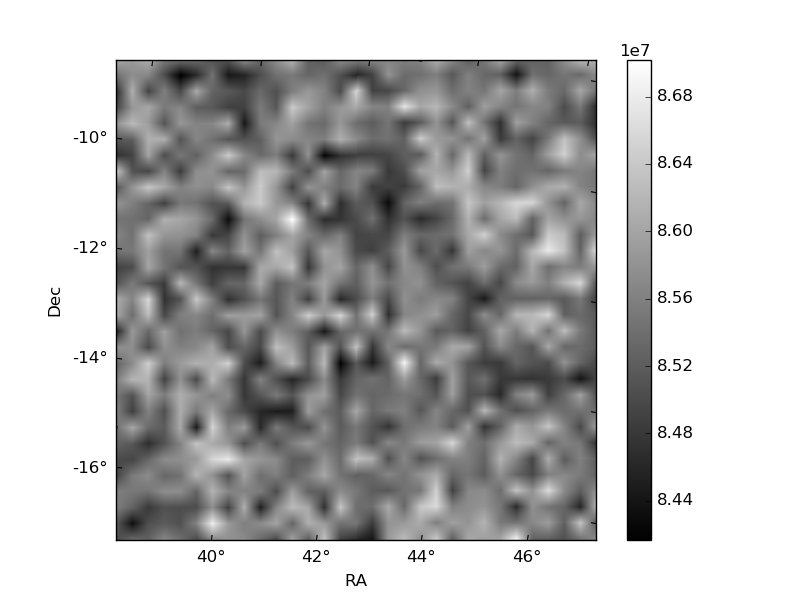
Histogram calculated using DETX and DETY for each event in the final _common_clean file
| Quadrant A | 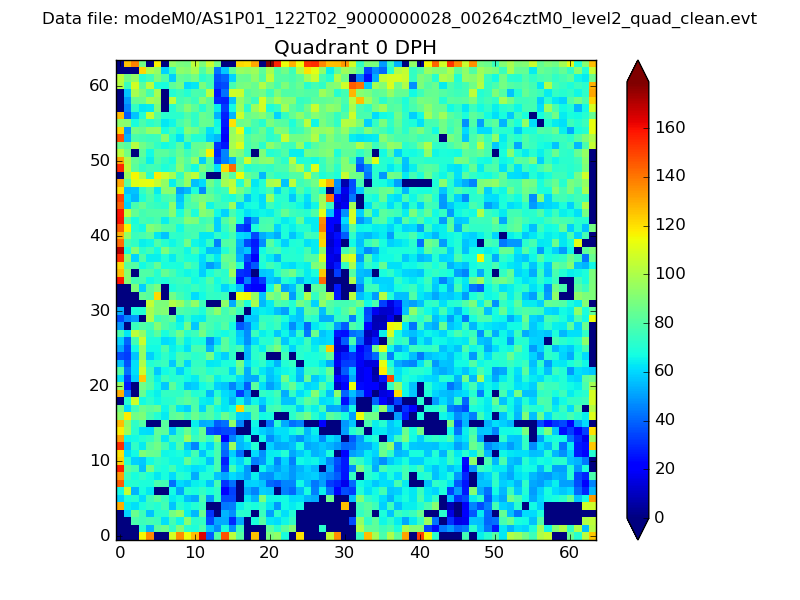 |
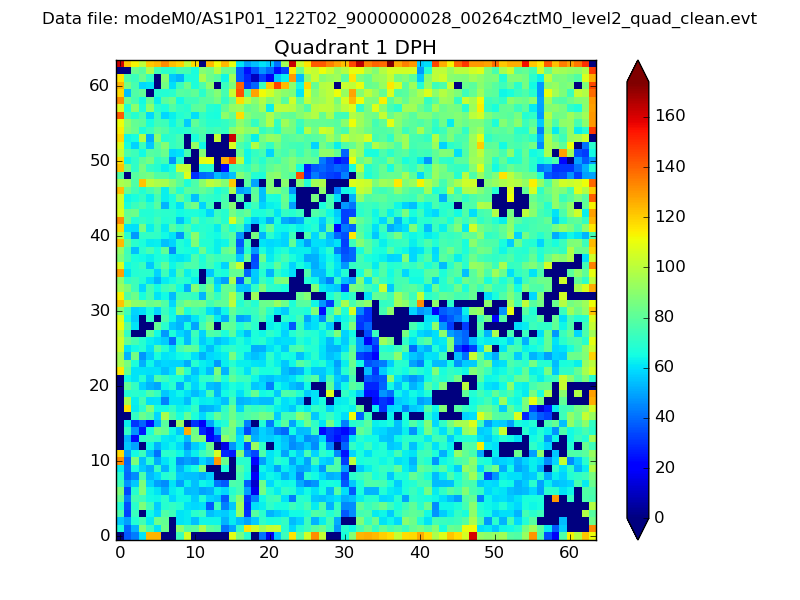 |
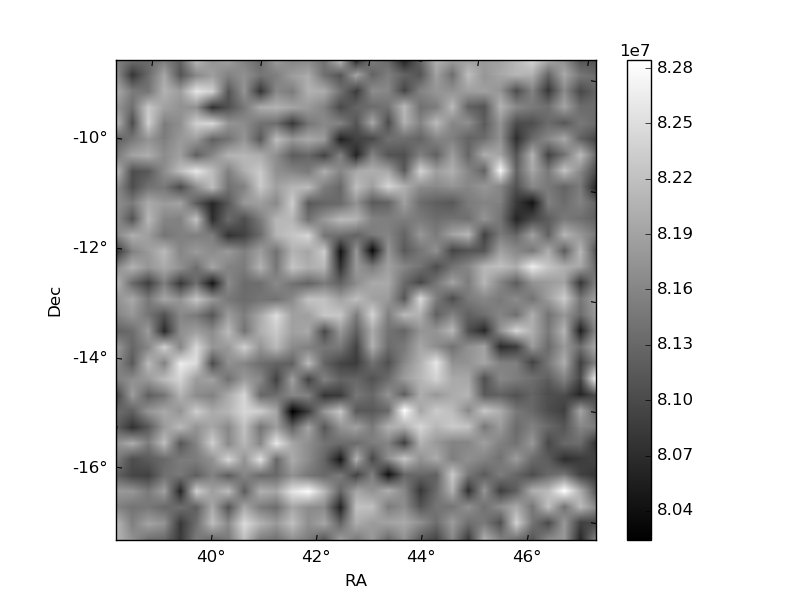
Quadrant B |
|---|---|---|---|
| Quadrant D | 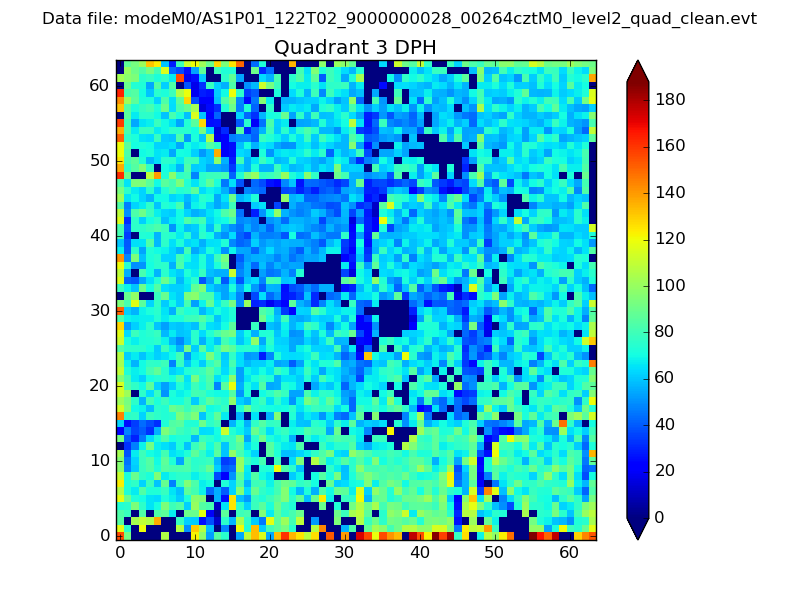 |
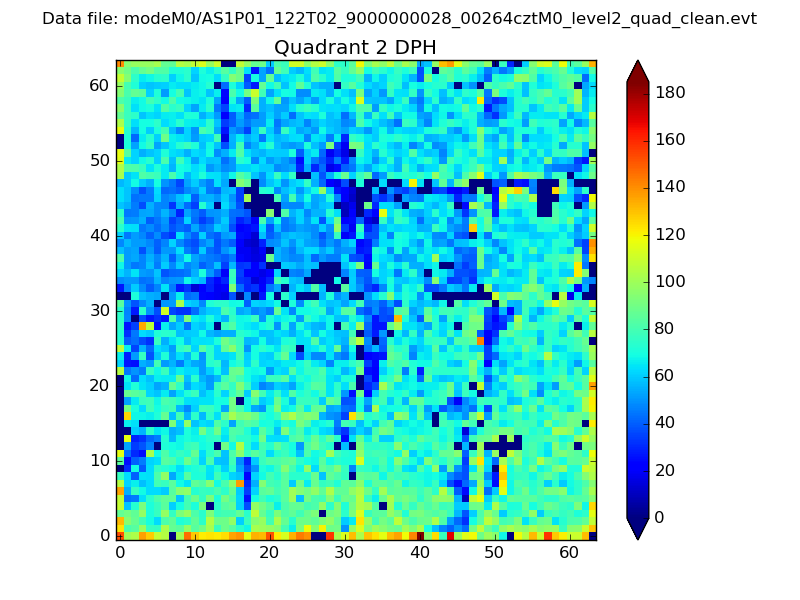 |
Quadrant C |
| Plot type | Count rate plots | Images |
|---|---|---|
| Comparison with Poisson distribution Blue bars denote a histogram of data divided into 1 sec bins. Red curve is a Poisson curve with rate = median count rate of data. |
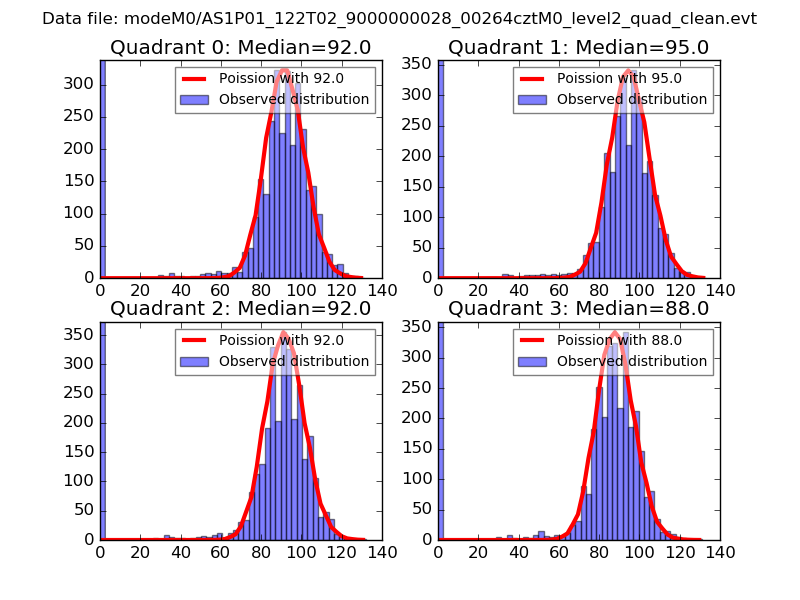 |
 |
| Quadrant-wise count rates Data is divided into 100 sec bins |
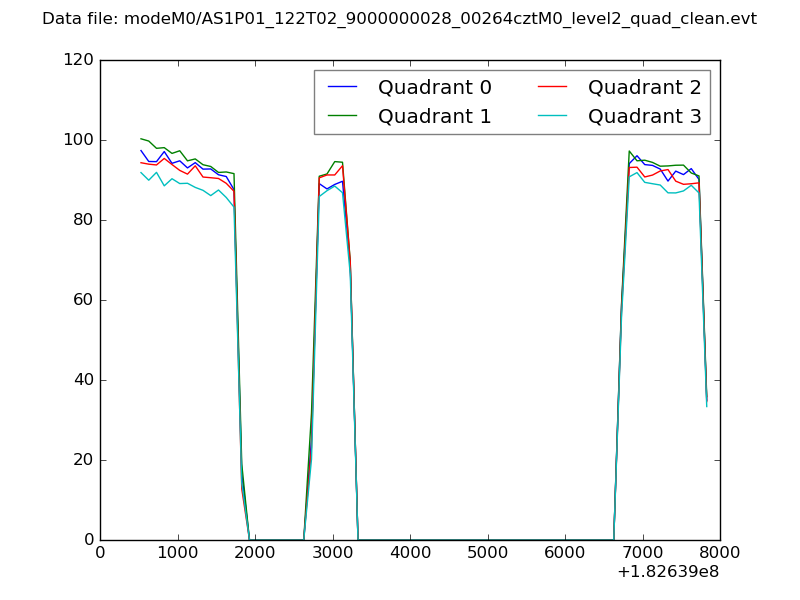 |
|
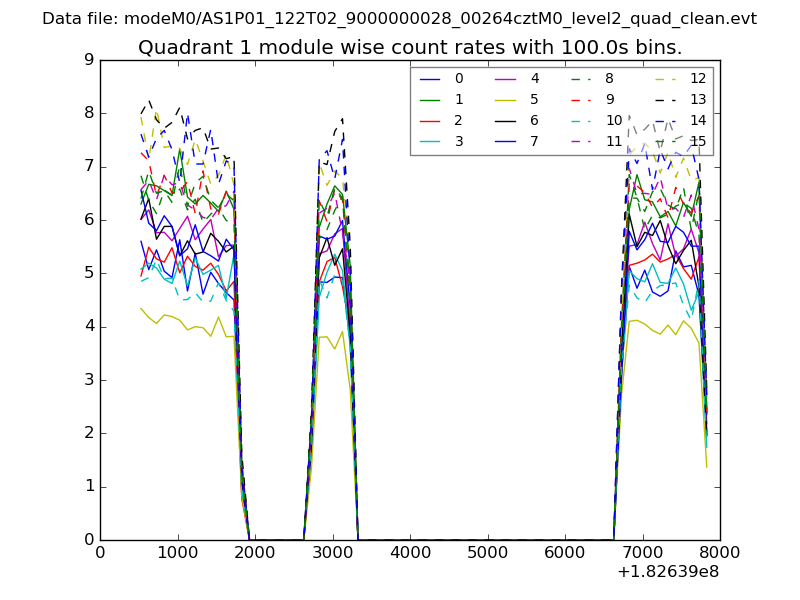
| Module-wise count rates for Quadrant A Data is divided into 100 sec bins |
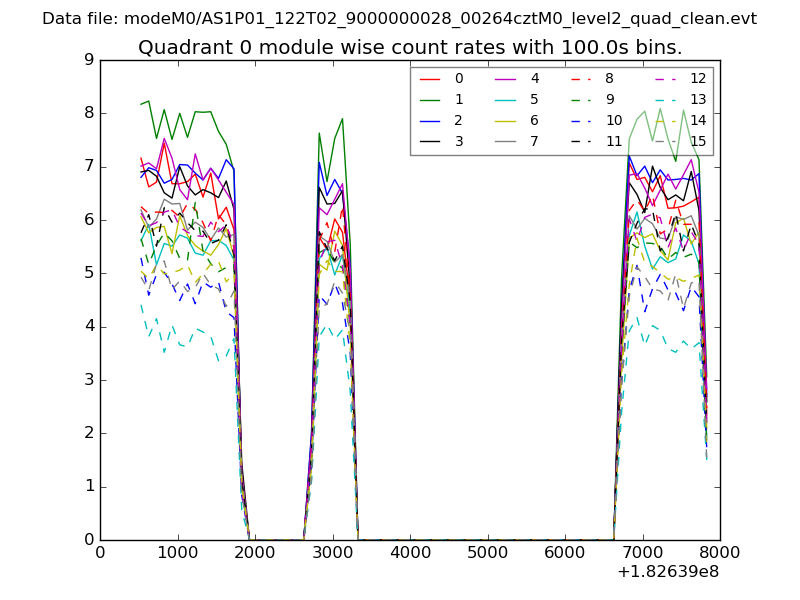 |
 |
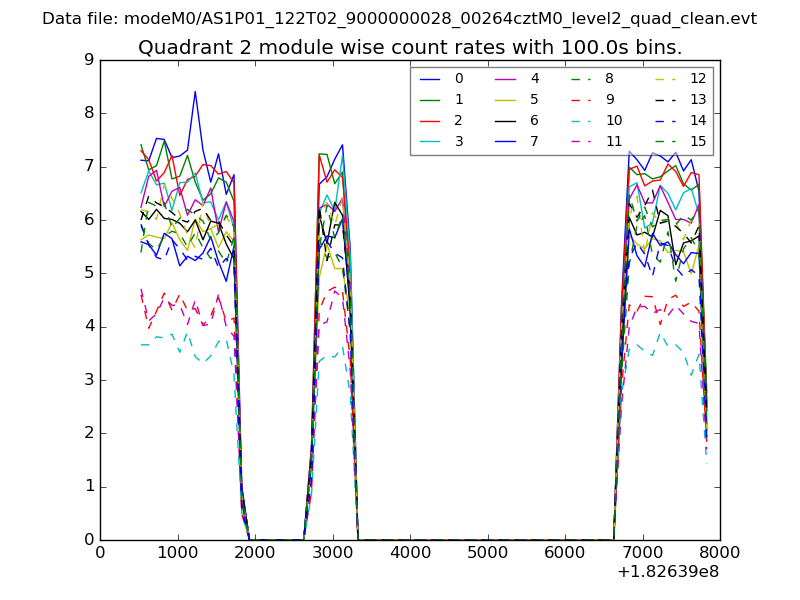
| Module-wise count rates for Quadrant B Data is divided into 100 sec bins |
 |
 |
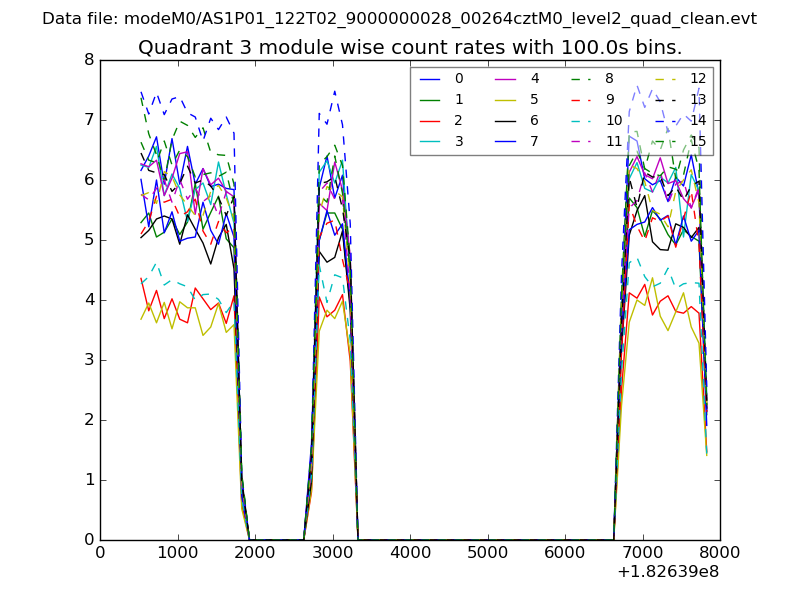
| Module-wise count rates for Quadrant C Data is divided into 100 sec bins |
 |
 |
| Module-wise count rates for Quadrant D Data is divided into 100 sec bins |
 |
 |
| Parameter | Plot |
|---|---|
| CZT HV Monitor | 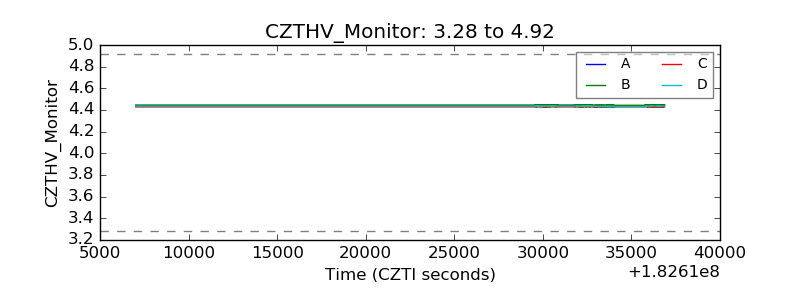 |
| D_VDD | 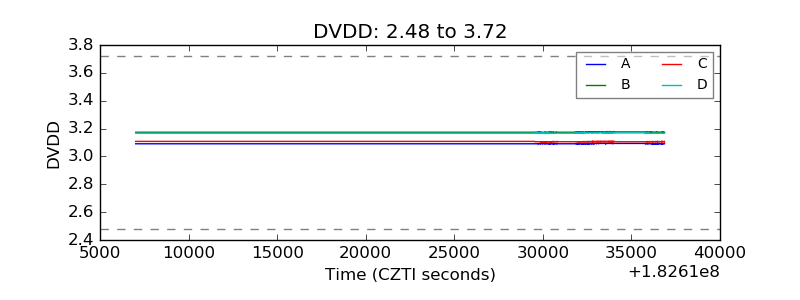 |
| Temperature 1 | 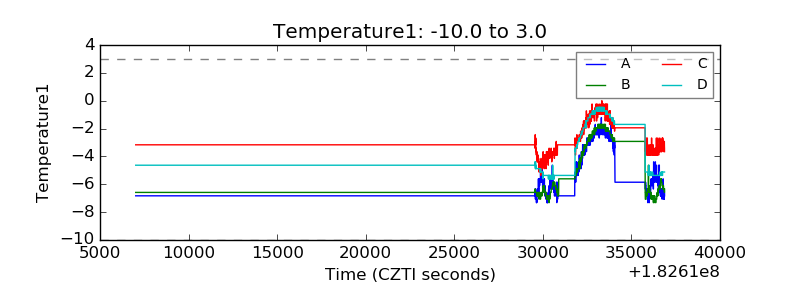 |
| Veto HV Monitor |  |
| Veto LLD | 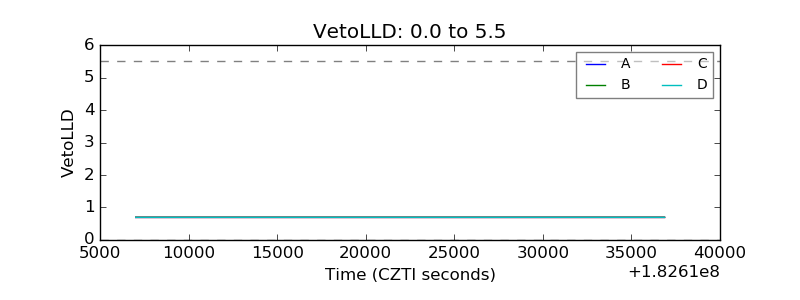 |
| Alpha Counter | 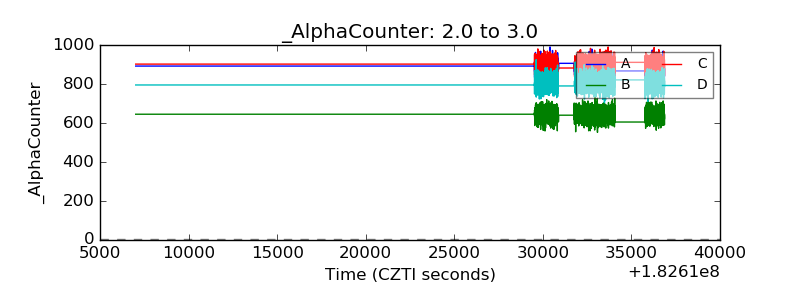 |
| _CPM_Rate | 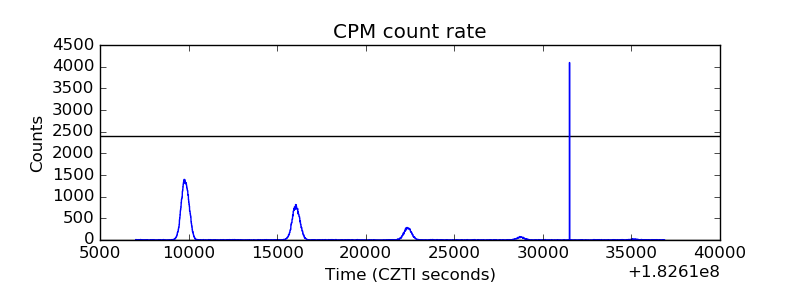 |
| CZT Counter |  |
| +2.5 Volts monitor |  |
| +5 Volts monitor |  |
| _ROLL_ROT | 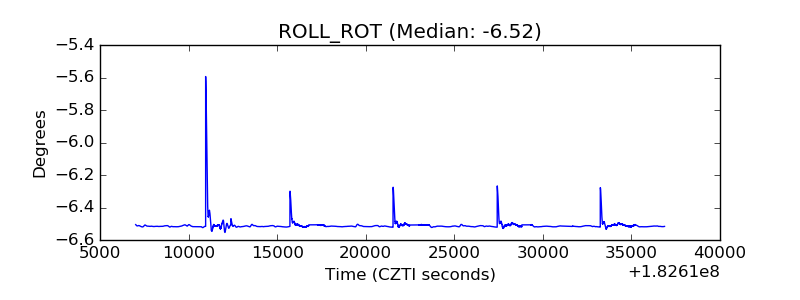 |
| _Roll_DEC | 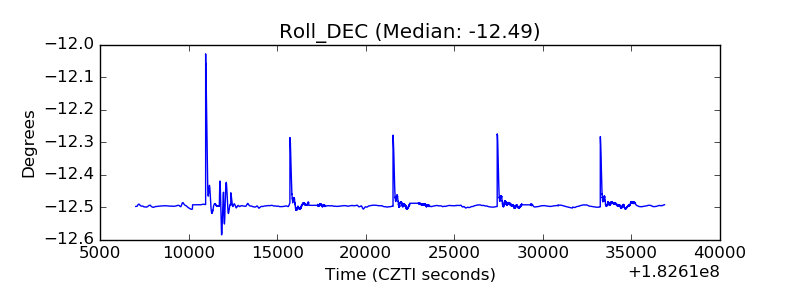 |
| _Roll_RA | 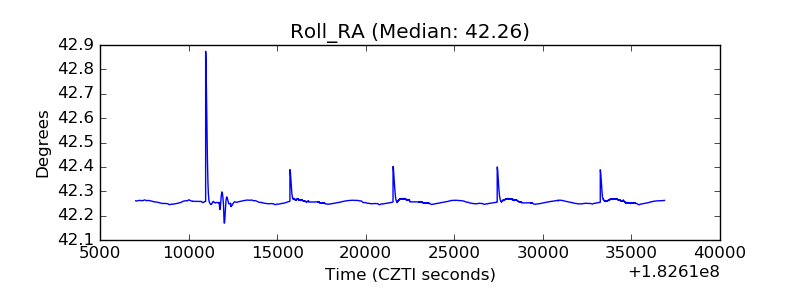 |
| Veto Counter | 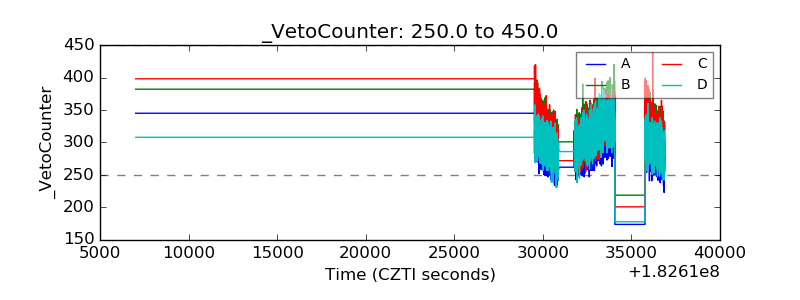 |