| Param | Original file | Final file |
|---|---|---|
| Filename | modeM0/AS1P01_126T01_9000000030_00270cztM0_level2.evt | modeM0/AS1P01_126T01_9000000030_00270cztM0_level2_quad_clean.evt |
| Size (bytes) | 2,242,183,680 | 114,183,360 |
| Size | 2.1 GB | 108.9 MB |
| Events in quadrant A | 16,315,369 | 636,364 |
| Events in quadrant B | 18,220,780 | 633,964 |
| Events in quadrant C | 14,828,369 | 646,400 |
| Events in quadrant D | 17,655,058 | 613,040 |
| Mode M0 | |||
|---|---|---|---|
| Quadrant | BADHDUFLAG | Total packets | Discarded packets |
| A | 0 | 58014 | 4 |
| B | 0 | 63726 | 3 |
| C | 0 | 53580 | 3 |
| D | 0 | 62008 | 3 |
| Mode M9 | |||
|---|---|---|---|
| Quadrant | BADHDUFLAG | Total packets | Discarded packets |
| A | 0 | 52 | 0 |
| B | 0 | 52 | 0 |
| C | 0 | 52 | 0 |
| D | 0 | 52 | 0 |
| Mode SS | |||
|---|---|---|---|
| Quadrant | BADHDUFLAG | Total packets | Discarded packets |
| A | 0 | 274 | 0 |
| B | 0 | 274 | 0 |
| C | 0 | 274 | 0 |
| D | 0 | 274 | 0 |
| Quadrant | Total seconds | Saturated seconds | Saturation percentage |
|---|---|---|---|
| A | 13427 | 8 | 0.059581% |
| B | 13427 | 362 | 2.696060% |
| C | 13427 | 9 | 0.067029% |
| D | 13427 | 367 | 2.733299% |
Noise dominated data is calculated using 1-second bins in cleaned event files. If a bin has >2000 counts, and if more than 50% of those come from <1% of pixels, then it is considered to be noise-dominated and hence unusable.
| Quadrant | # 1 sec bins | Bins with >0 counts | Bins with >2000 counts | High rate bins dominated by noise | Noise dominated (total time) | Noise dominated (detector-on time) | Marked lightcurve |
|---|---|---|---|---|---|---|---|
| A | 18630 | 13430 | 314 | 314 | 1.69% | 2.34% | 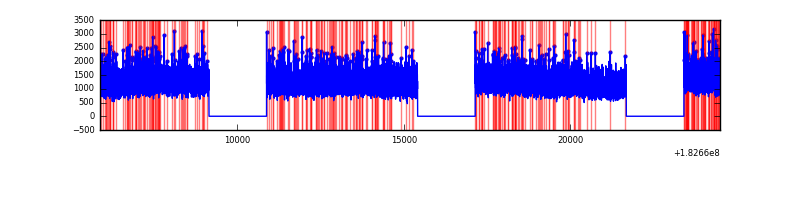 |
| B | 18630 | 13430 | 977 | 977 | 5.24% | 7.27% | 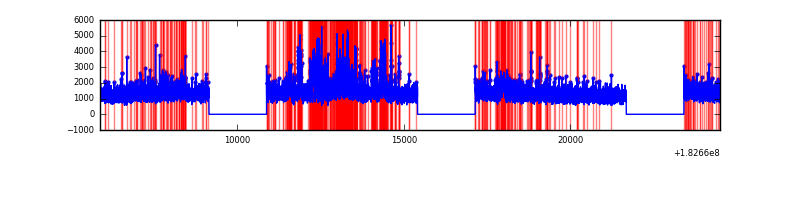 |
| C | 18630 | 13430 | 123 | 123 | 0.66% | 0.92% | 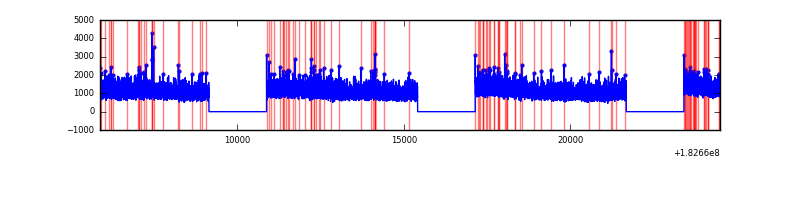 |
| D | 18630 | 13430 | 1081 | 1081 | 5.80% | 8.05% | 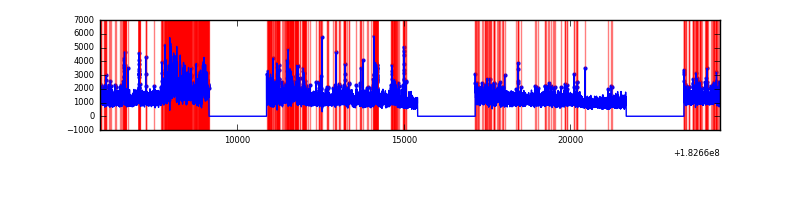 |
Top three noisy pixels from each quadrant. If the there are fewer than three noisy pixels in the level2.evt file, extra rows are filled as -1
| Pixel properties | Quadrant properties | ||||||
|---|---|---|---|---|---|---|---|
| Quadrant | DetID | PixID | Counts | Sigma | Mean | Median | Sigma |
| A | 15 | 250 | 40572 | 39.13 | 4193 | 4152 | 930.8 |
| A | 11 | 242 | 18008 | 14.89 | 4193 | 4152 | 930.8 |
| A | 15 | 127 | 15168 | 11.84 | 4193 | 4152 | 930.8 |
| B | 2 | 32 | 1718078 | 1761.9 | 4119 | 4149 | 972.8 |
| B | 8 | 9 | 374354 | 380.57 | 4119 | 4149 | 972.8 |
| B | 5 | 46 | 190877 | 191.95 | 4119 | 4149 | 972.8 |
| C | 2 | 192 | 26229 | 21.19 | 3763 | 3896 | 1054.1 |
| C | 3 | 159 | 18030 | 13.41 | 3763 | 3896 | 1054.1 |
| C | 7 | 221 | 10331 | 6.1 | 3763 | 3896 | 1054.1 |
| D | 13 | 7 | 2337677 | 2056.51 | 3621 | 3773 | 1134.9 |
| D | 10 | 154 | 665592 | 583.16 | 3621 | 3773 | 1134.9 |
| D | 1 | 5 | 251737 | 218.49 | 3621 | 3773 | 1134.9 |
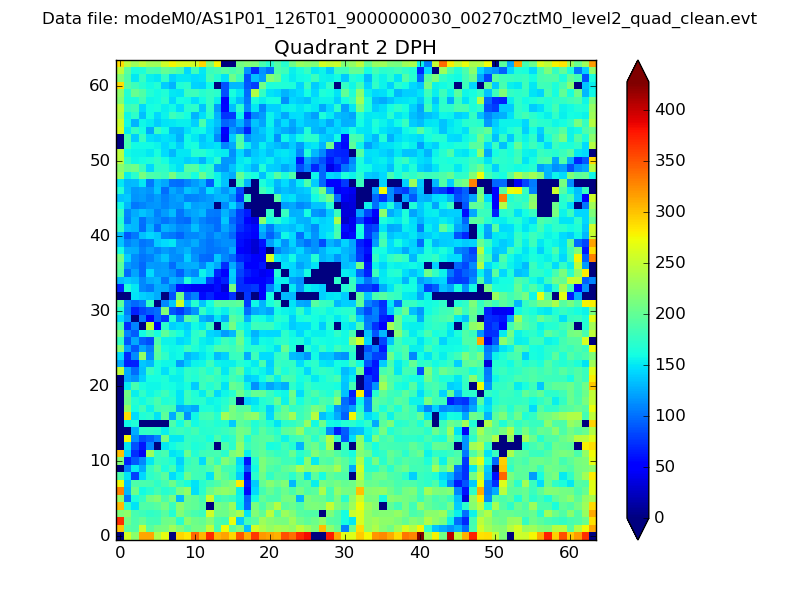
Histogram calculated using DETX and DETY for each event in the final _common_clean file
| Quadrant A | 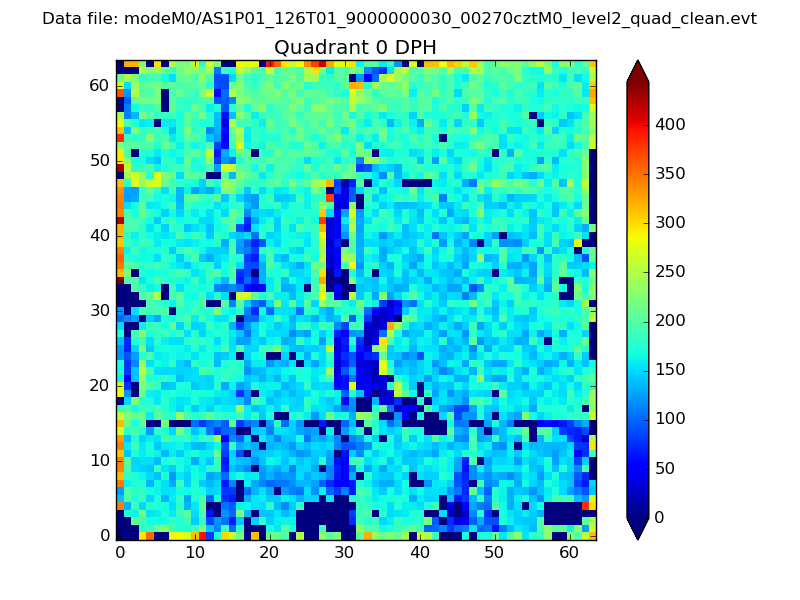 |
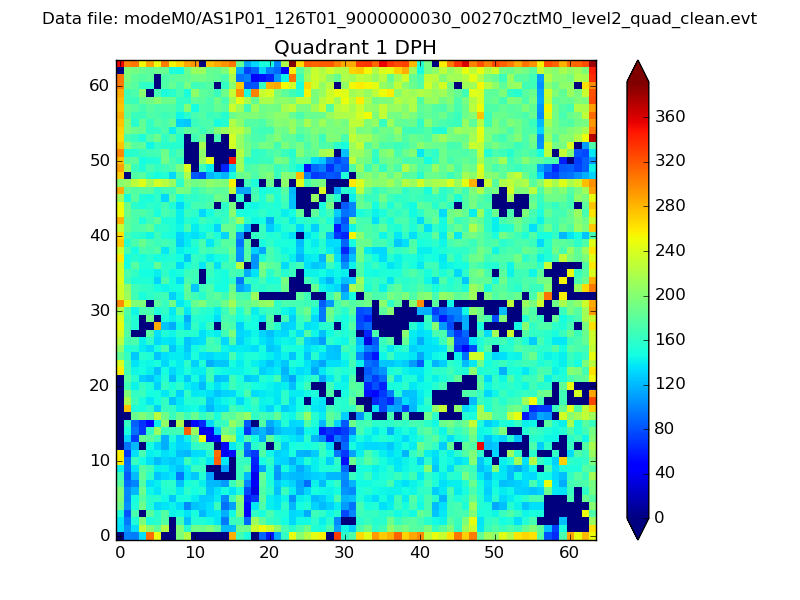 |
Quadrant B |
|---|---|---|---|
| Quadrant D | 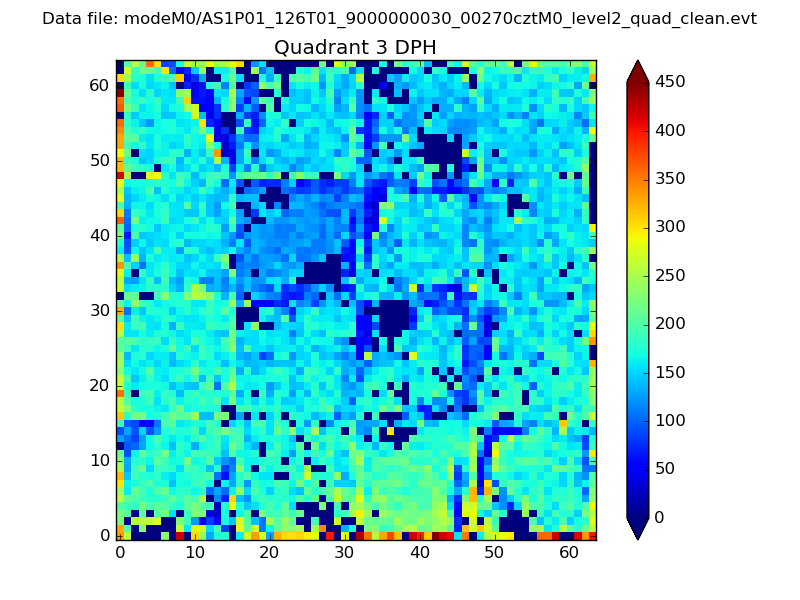 |
 |
Quadrant C |
| Plot type | Count rate plots | Images |
|---|---|---|
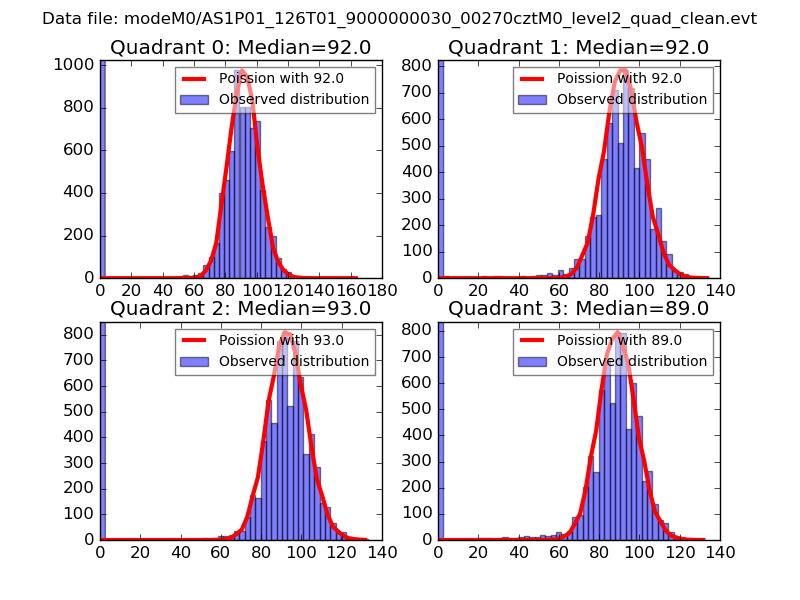
| Comparison with Poisson distribution Blue bars denote a histogram of data divided into 1 sec bins. Red curve is a Poisson curve with rate = median count rate of data. |
 |
 |
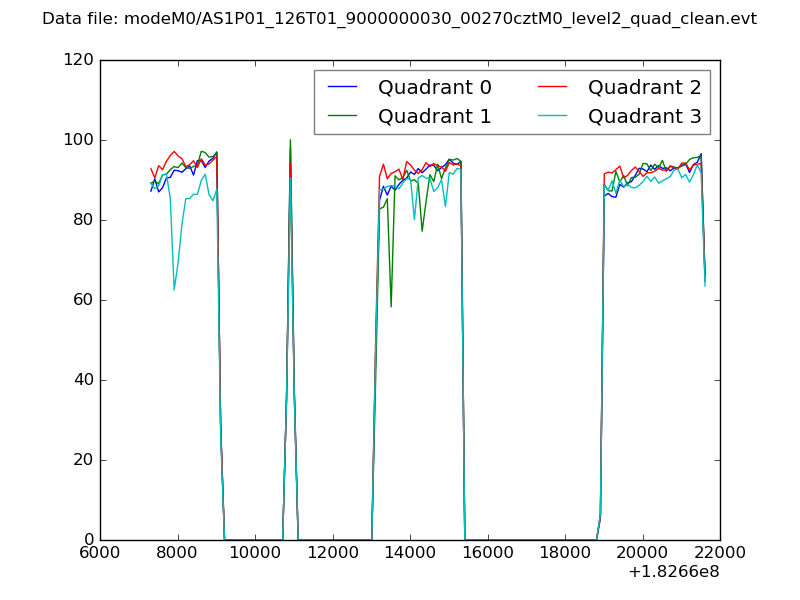
| Quadrant-wise count rates Data is divided into 100 sec bins |
 |
|
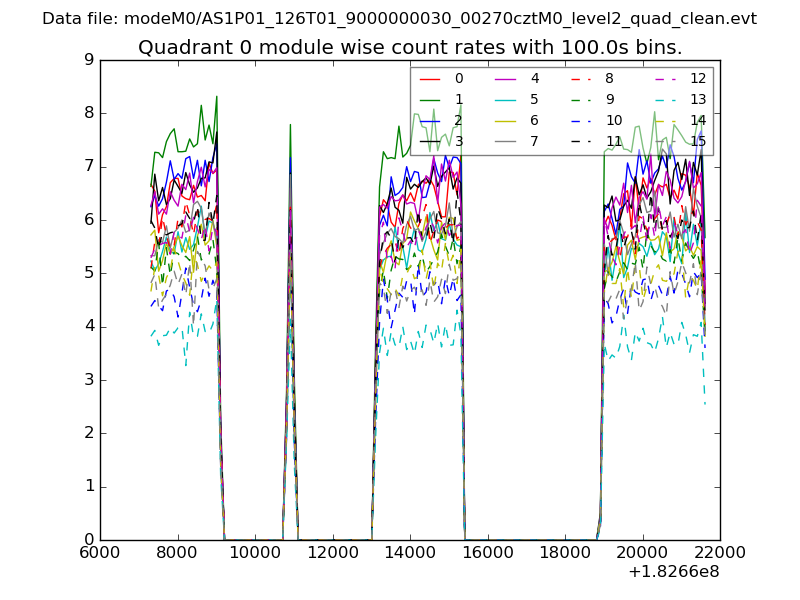
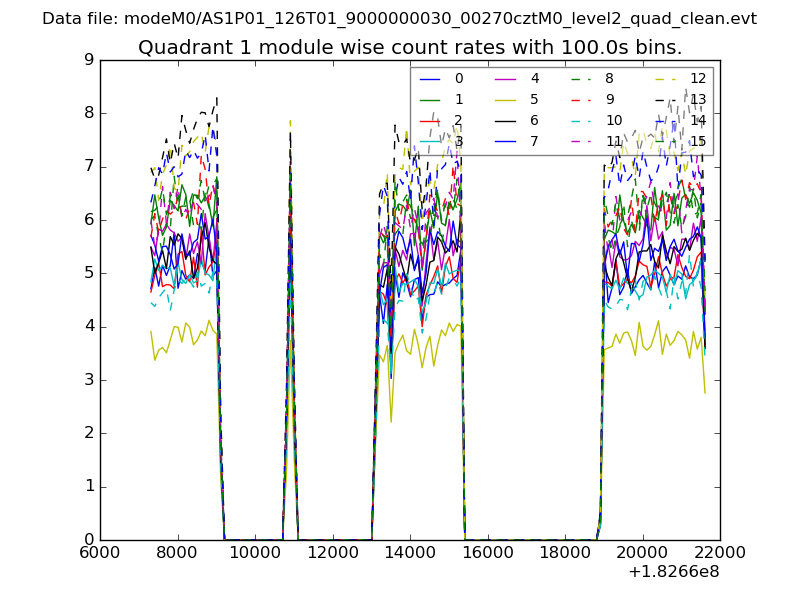
| Module-wise count rates for Quadrant A Data is divided into 100 sec bins |
 |
 |
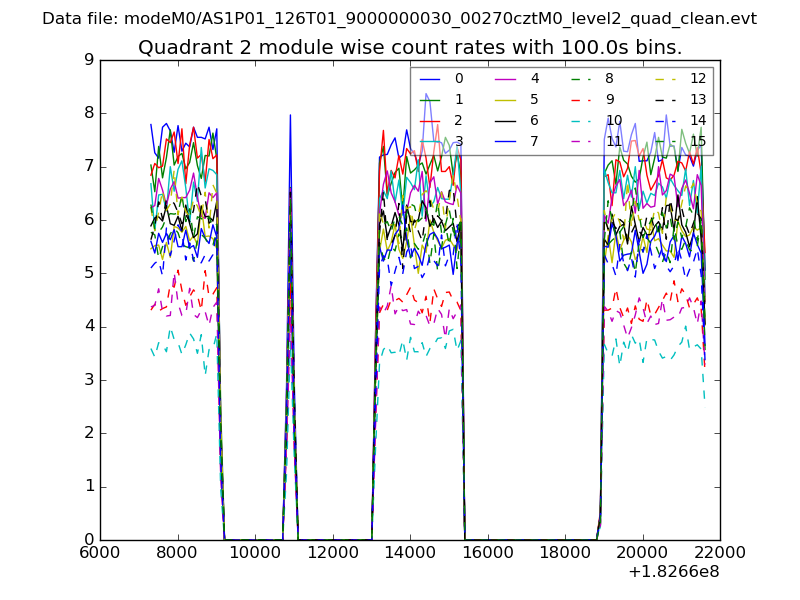
| Module-wise count rates for Quadrant B Data is divided into 100 sec bins |
 |
 |
| Module-wise count rates for Quadrant C Data is divided into 100 sec bins |
 |
 |
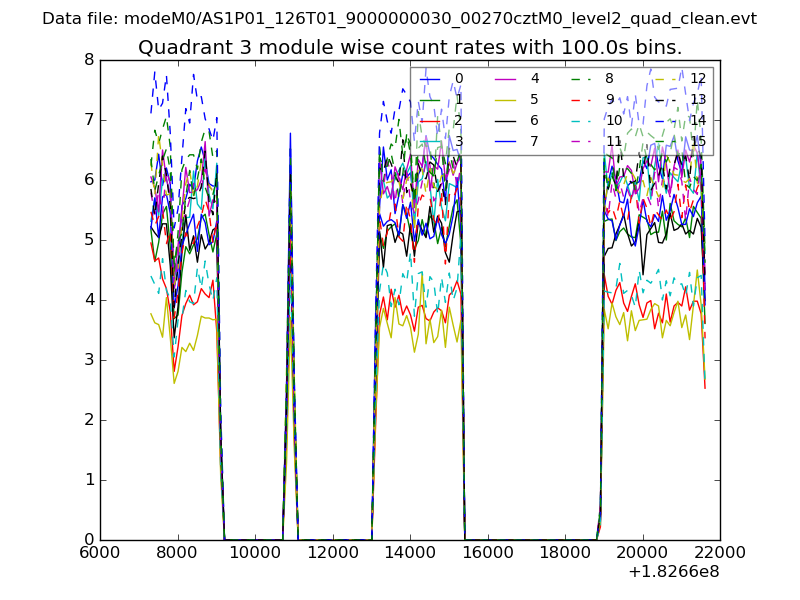
| Module-wise count rates for Quadrant D Data is divided into 100 sec bins |
 |
 |
| Parameter | Plot |
|---|---|
| CZT HV Monitor | 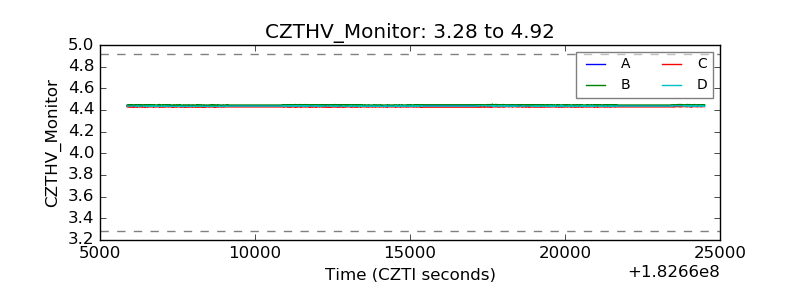 |
| D_VDD |  |
| Temperature 1 |  |
| Veto HV Monitor | 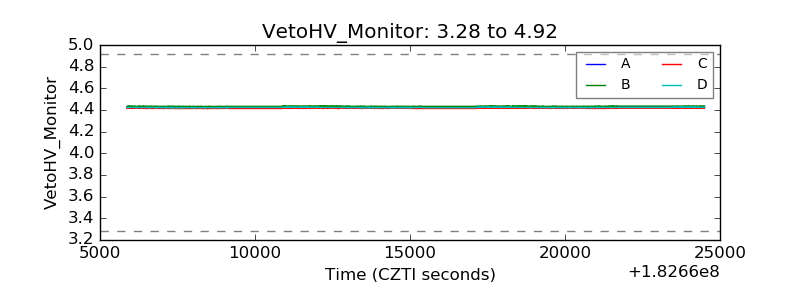 |
| Veto LLD | 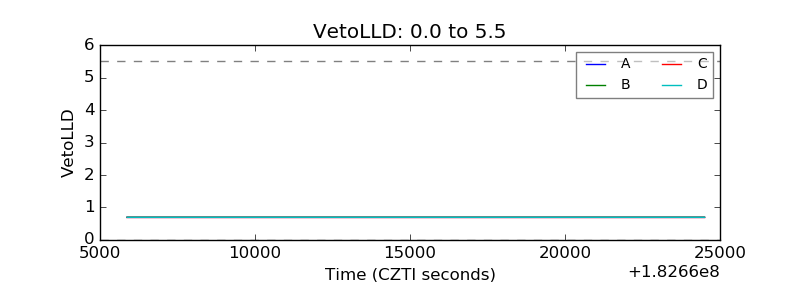 |
| Alpha Counter | 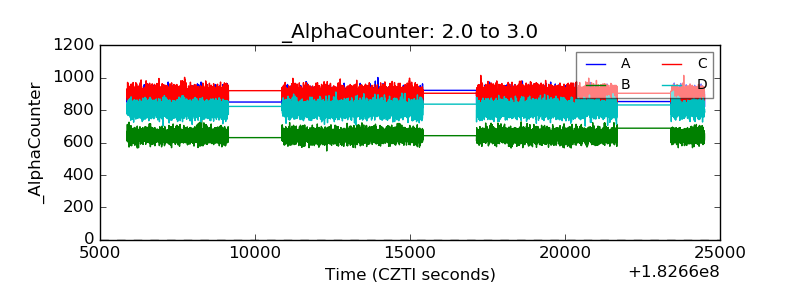 |
| _CPM_Rate | 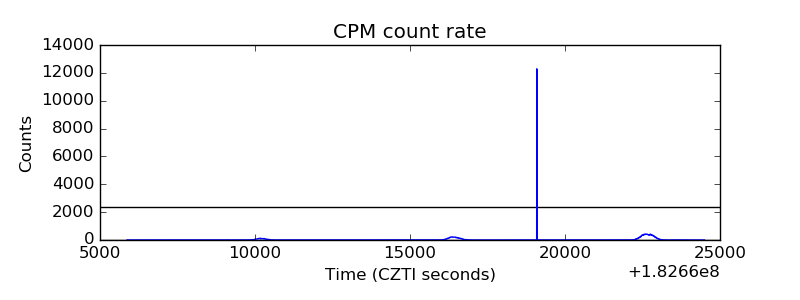 |
| CZT Counter | 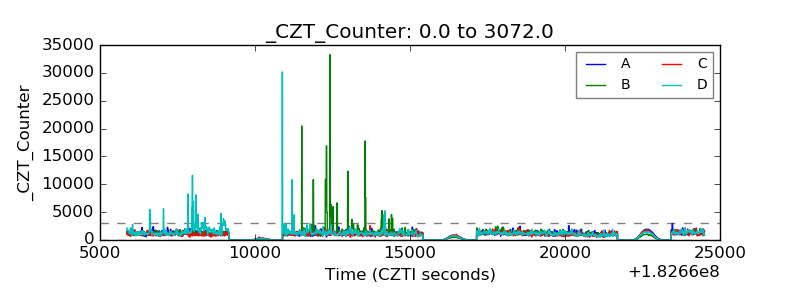 |
| +2.5 Volts monitor |  |
| +5 Volts monitor | 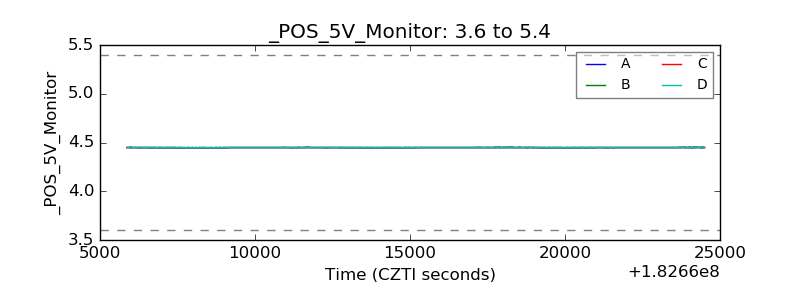 |
| _ROLL_ROT | 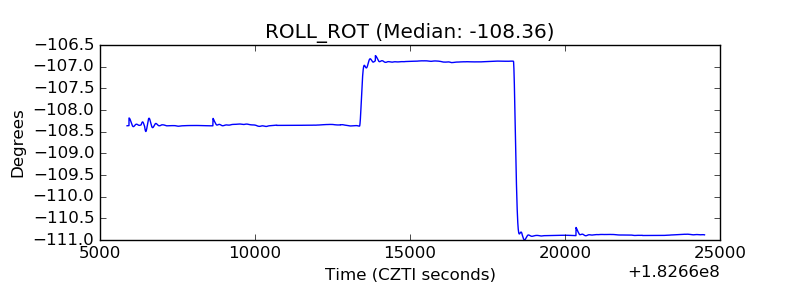 |
| _Roll_DEC |  |
| _Roll_RA | 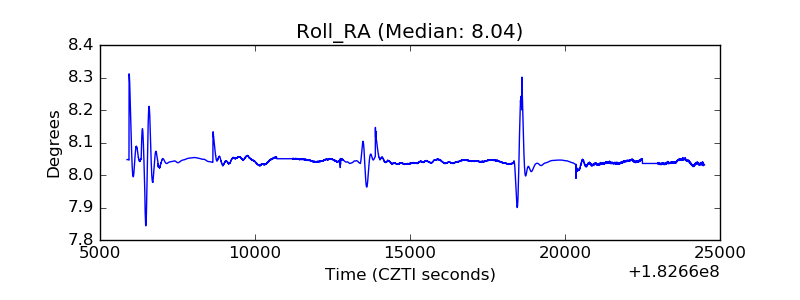 |
| Veto Counter | 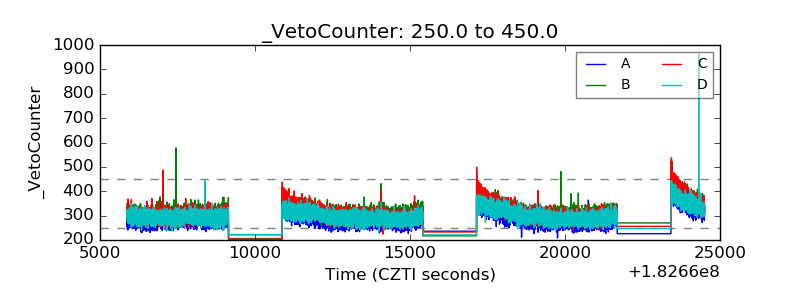 |