| Param | Original file | Final file |
|---|---|---|
| Filename | modeM0/AS1P01_126T01_9000000030_00273cztM0_level2.evt | modeM0/AS1P01_126T01_9000000030_00273cztM0_level2_quad_clean.evt |
| Size (bytes) | 891,970,560 | 64,229,760 |
| Size | 850.6 MB | 61.3 MB |
| Events in quadrant A | 6,840,112 | 389,539 |
| Events in quadrant B | 6,827,873 | 396,436 |
| Events in quadrant C | 6,182,043 | 389,181 |
| Events in quadrant D | 6,792,581 | 379,022 |
| Mode M0 | |||
|---|---|---|---|
| Quadrant | BADHDUFLAG | Total packets | Discarded packets |
| A | 0 | 24264 | 3 |
| B | 0 | 24227 | 2 |
| C | 0 | 22349 | 2 |
| D | 0 | 24172 | 2 |
| Mode M9 | |||
|---|---|---|---|
| Quadrant | BADHDUFLAG | Total packets | Discarded packets |
| A | 0 | 21 | 0 |
| B | 0 | 21 | 0 |
| C | 0 | 21 | 0 |
| D | 0 | 22 | 0 |
| Mode SS | |||
|---|---|---|---|
| Quadrant | BADHDUFLAG | Total packets | Discarded packets |
| A | 0 | 112 | 0 |
| B | 0 | 112 | 0 |
| C | 0 | 112 | 0 |
| D | 0 | 112 | 0 |
| Quadrant | Total seconds | Saturated seconds | Saturation percentage |
|---|---|---|---|
| A | 5588 | 8 | 0.143164% |
| B | 5588 | 3 | 0.053686% |
| C | 5588 | 14 | 0.250537% |
| D | 5588 | 26 | 0.465283% |
Noise dominated data is calculated using 1-second bins in cleaned event files. If a bin has >2000 counts, and if more than 50% of those come from <1% of pixels, then it is considered to be noise-dominated and hence unusable.
| Quadrant | # 1 sec bins | Bins with >0 counts | Bins with >2000 counts | High rate bins dominated by noise | Noise dominated (total time) | Noise dominated (detector-on time) | Marked lightcurve |
|---|---|---|---|---|---|---|---|
| A | 7293 | 5589 | 180 | 180 | 2.47% | 3.22% | 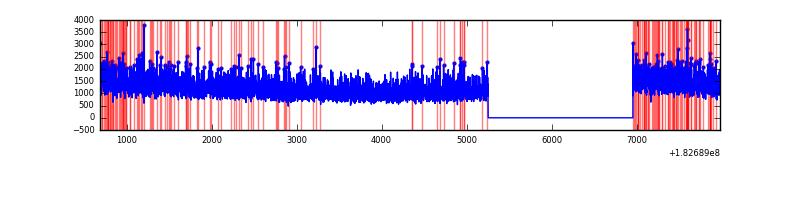 |
| B | 7293 | 5589 | 97 | 97 | 1.33% | 1.74% | 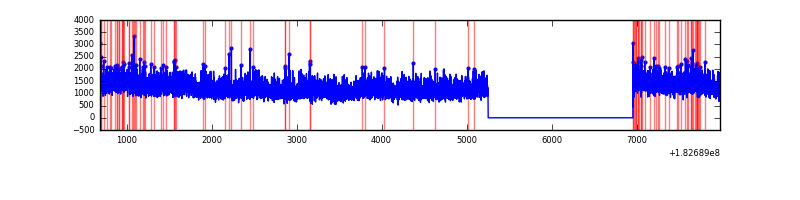 |
| C | 7293 | 5589 | 70 | 70 | 0.96% | 1.25% | 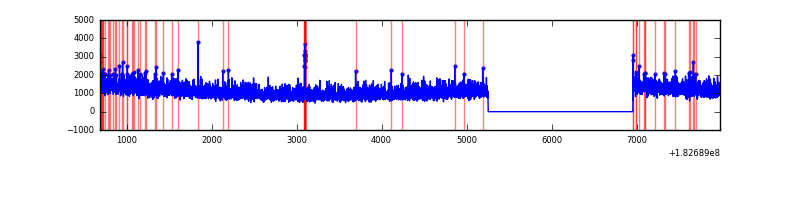 |
| D | 7293 | 5589 | 252 | 252 | 3.46% | 4.51% | 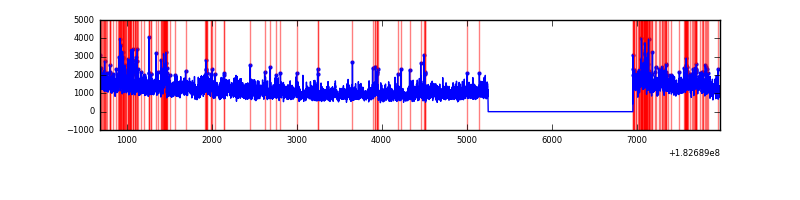 |
Top three noisy pixels from each quadrant. If the there are fewer than three noisy pixels in the level2.evt file, extra rows are filled as -1
| Pixel properties | Quadrant properties | ||||||
|---|---|---|---|---|---|---|---|
| Quadrant | DetID | PixID | Counts | Sigma | Mean | Median | Sigma |
| A | 15 | 66 | 21044 | 49.24 | 1758 | 1742 | 392.0 |
| A | 12 | 149 | 8291 | 16.71 | 1758 | 1742 | 392.0 |
| A | 13 | 239 | 5668 | 10.02 | 1758 | 1742 | 392.0 |
| B | 0 | 157 | 102023 | 245.57 | 1746 | 1760 | 408.3 |
| B | 5 | 46 | 20472 | 45.83 | 1746 | 1760 | 408.3 |
| B | 5 | 2 | 13027 | 27.6 | 1746 | 1760 | 408.3 |
| C | 7 | 221 | 32115 | 70.23 | 1552 | 1605 | 434.4 |
| C | 3 | 159 | 22270 | 47.57 | 1552 | 1605 | 434.4 |
| C | 1 | 1 | 12388 | 24.82 | 1552 | 1605 | 434.4 |
| D | 13 | 7 | 250723 | 525.16 | 1513 | 1571 | 474.4 |
| D | 10 | 154 | 228113 | 477.5 | 1513 | 1571 | 474.4 |
| D | 12 | 196 | 163452 | 341.21 | 1513 | 1571 | 474.4 |
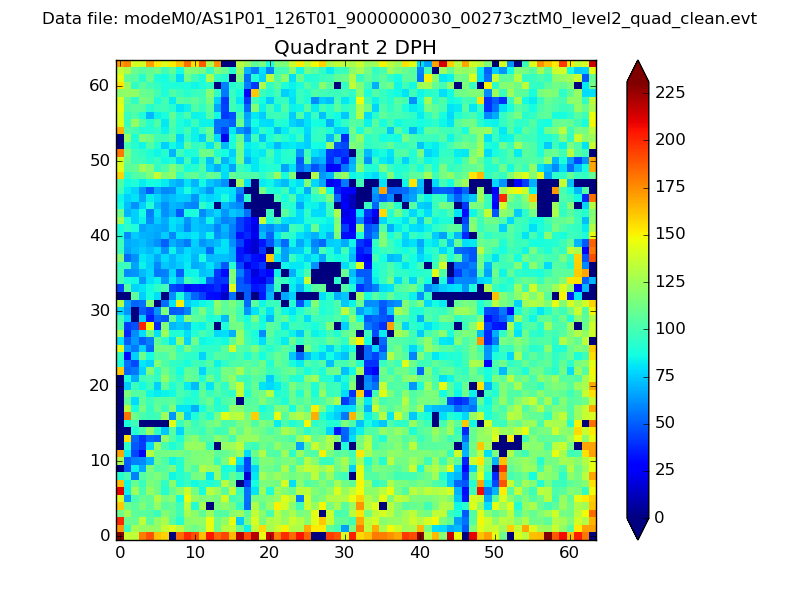
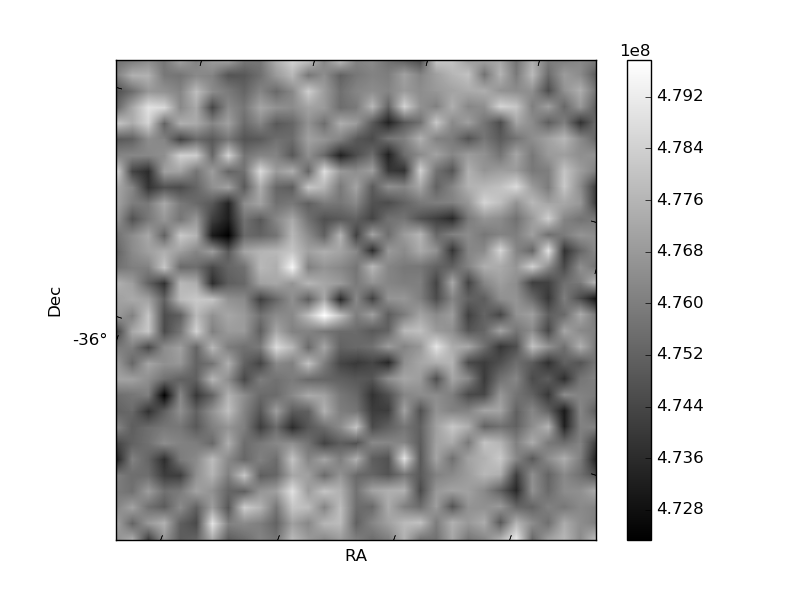
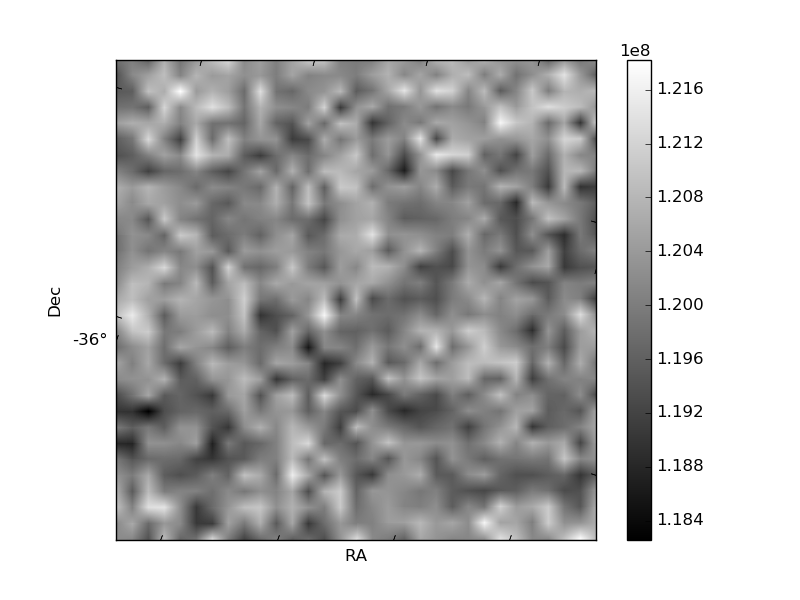
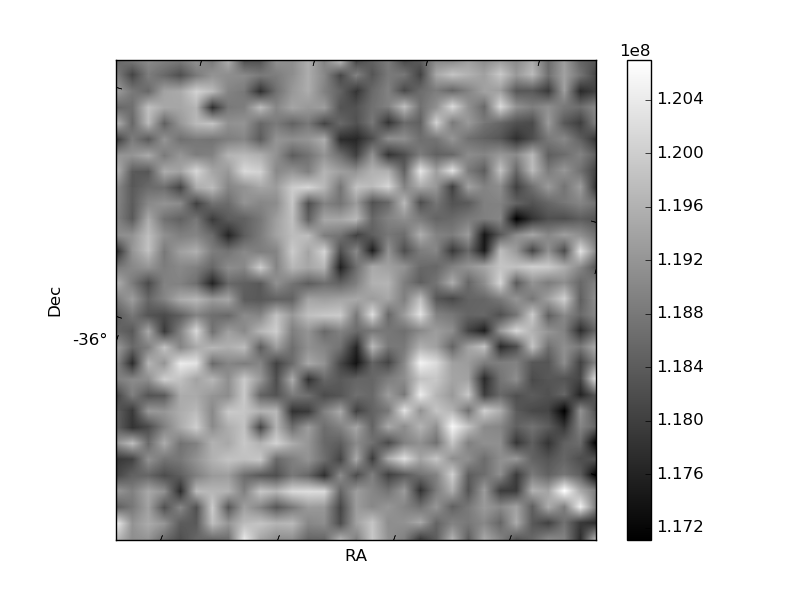
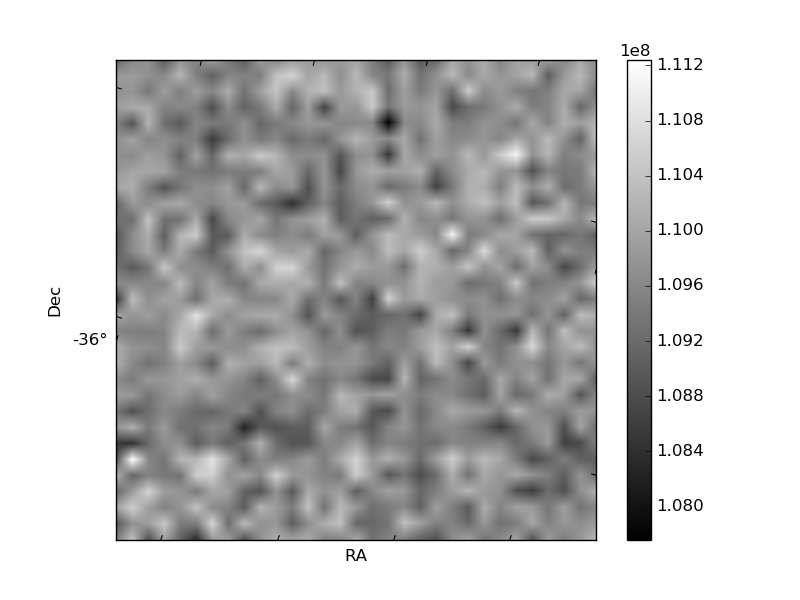
Histogram calculated using DETX and DETY for each event in the final _common_clean file
| Quadrant A | 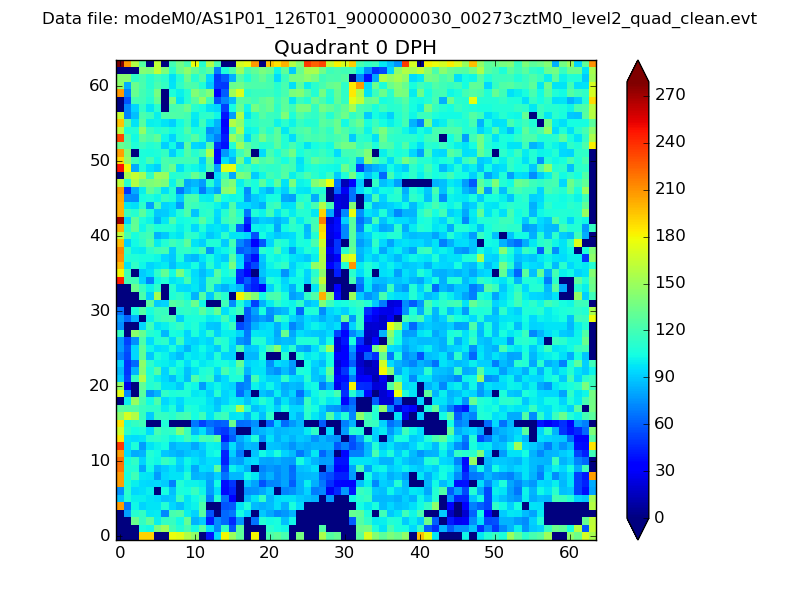 |
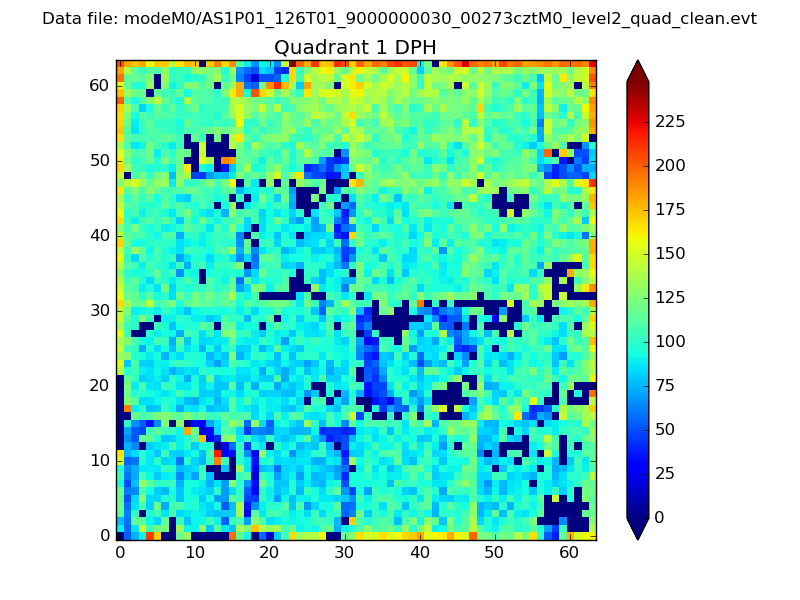 |
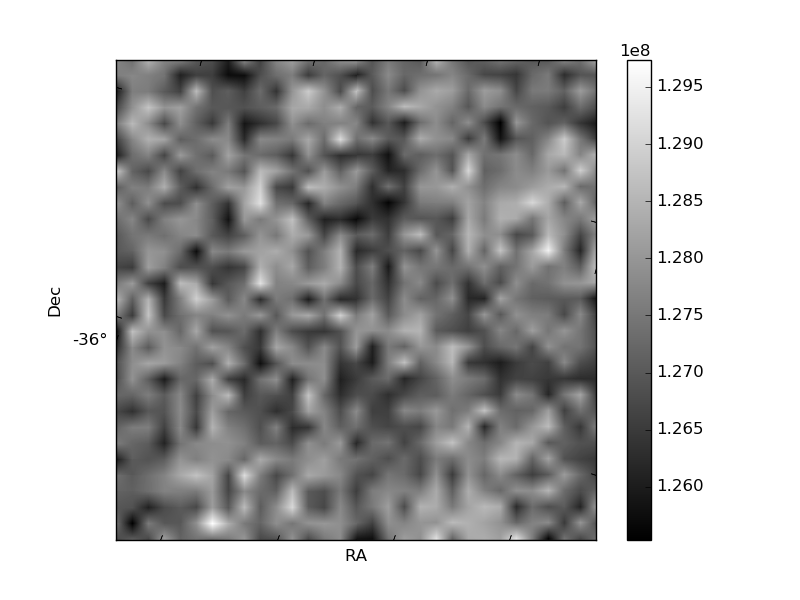
Quadrant B |
|---|---|---|---|
| Quadrant D | 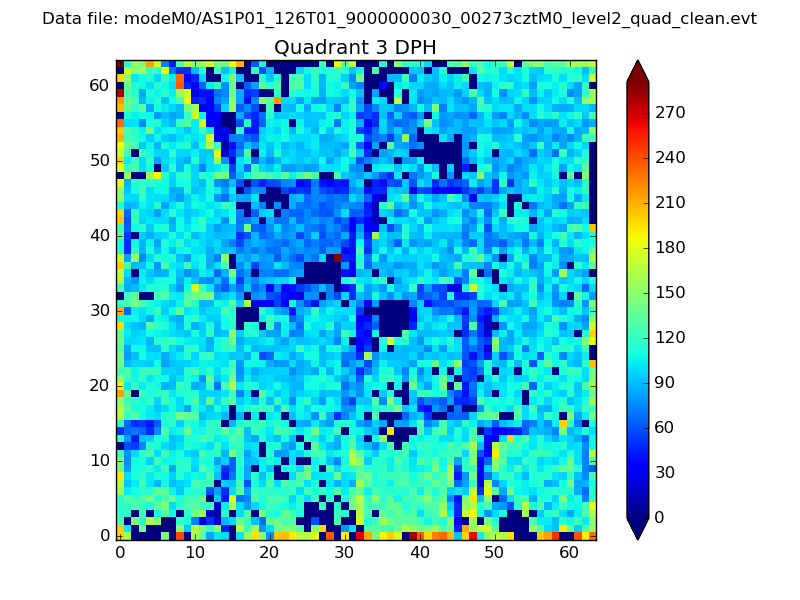 |
 |
Quadrant C |
| Plot type | Count rate plots | Images |
|---|---|---|
| Comparison with Poisson distribution Blue bars denote a histogram of data divided into 1 sec bins. Red curve is a Poisson curve with rate = median count rate of data. |
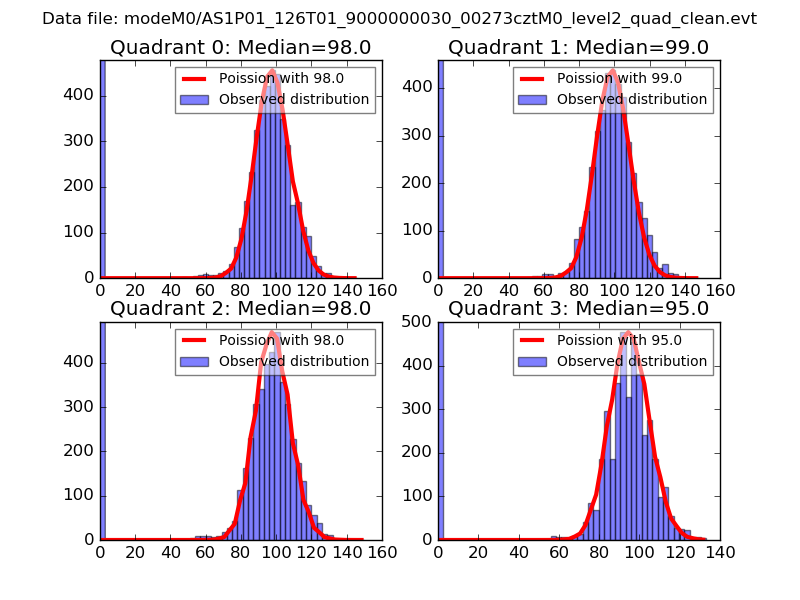 |
 |
| Quadrant-wise count rates Data is divided into 100 sec bins |
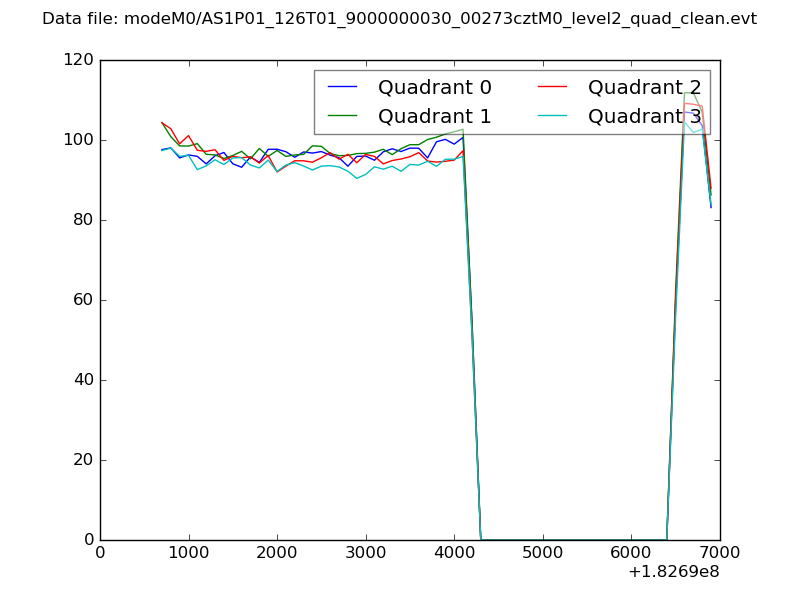 |
|
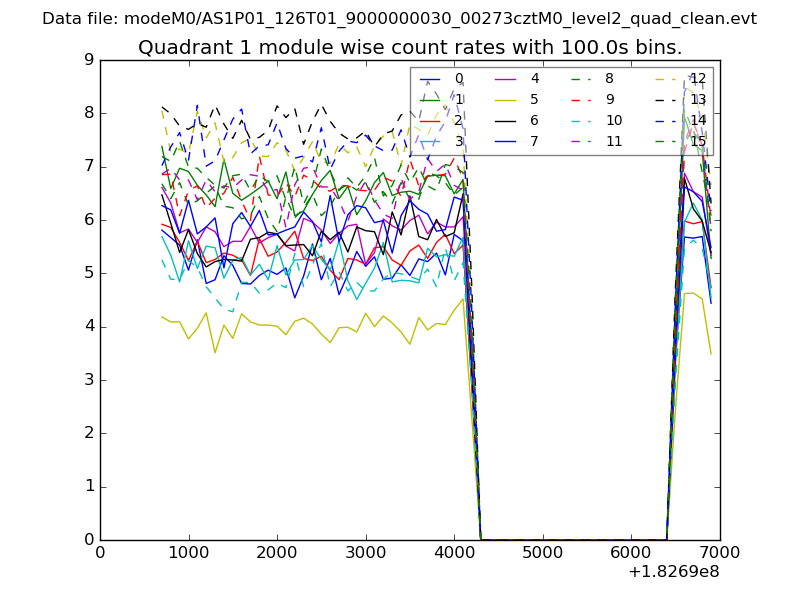
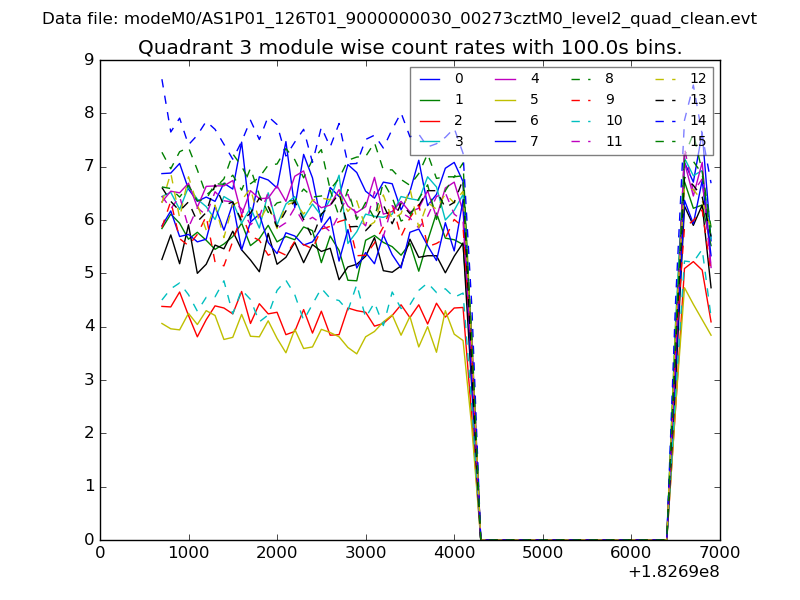
| Module-wise count rates for Quadrant A Data is divided into 100 sec bins |
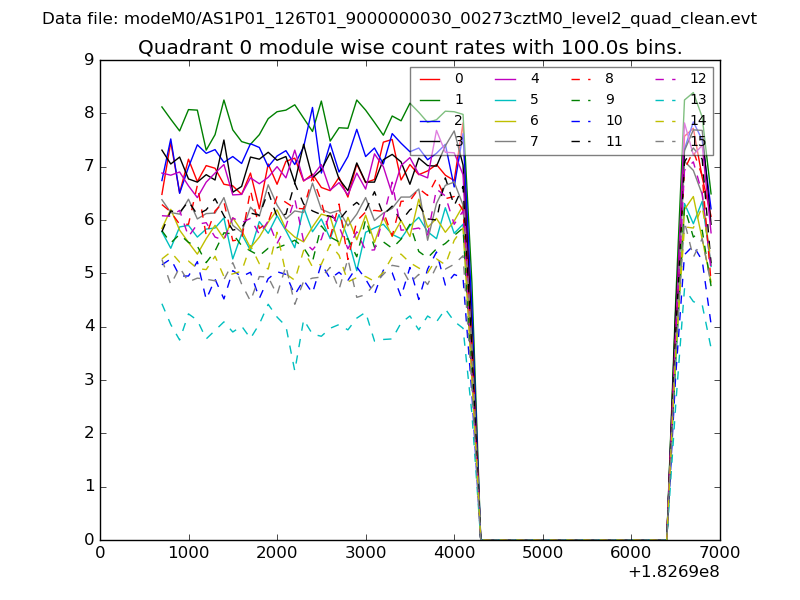 |
 |
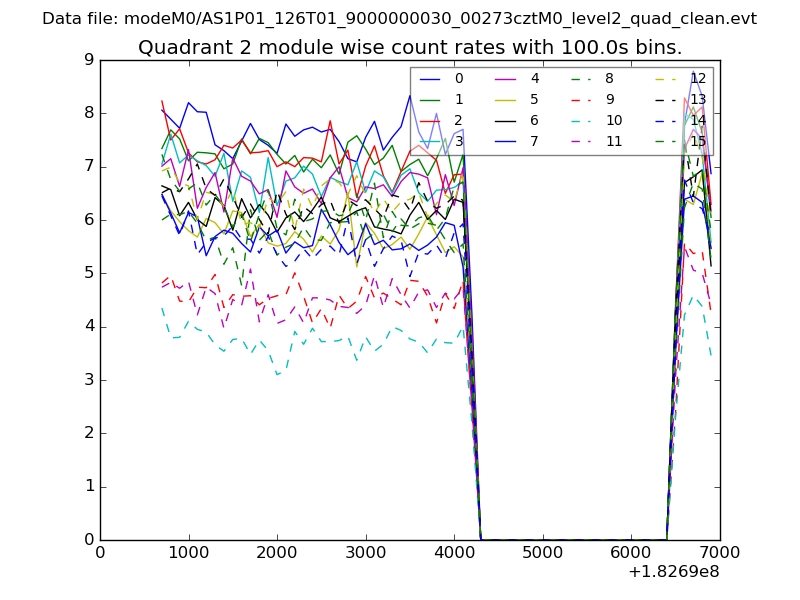
| Module-wise count rates for Quadrant B Data is divided into 100 sec bins |
 |
 |
| Module-wise count rates for Quadrant C Data is divided into 100 sec bins |
 |
 |
| Module-wise count rates for Quadrant D Data is divided into 100 sec bins |
 |
 |
| Parameter | Plot |
|---|---|
| CZT HV Monitor | 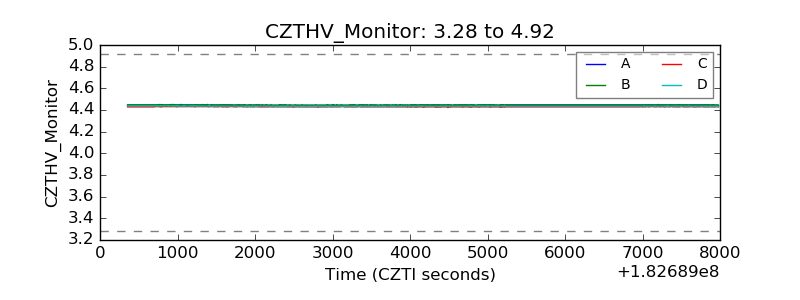 |
| D_VDD | 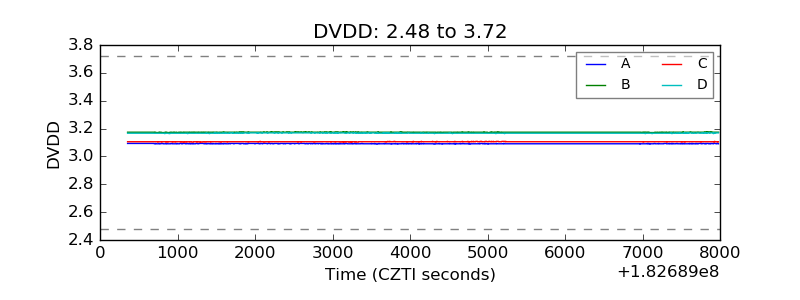 |
| Temperature 1 | 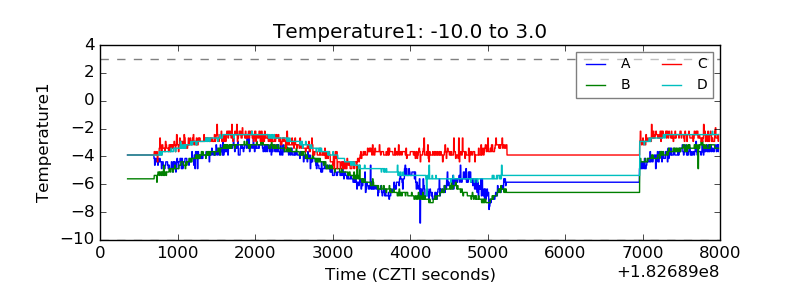 |
| Veto HV Monitor | 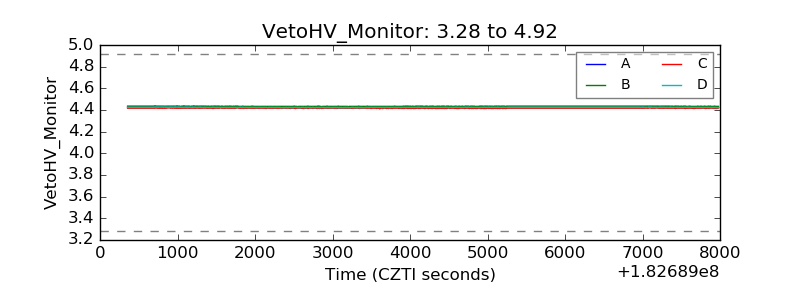 |
| Veto LLD | 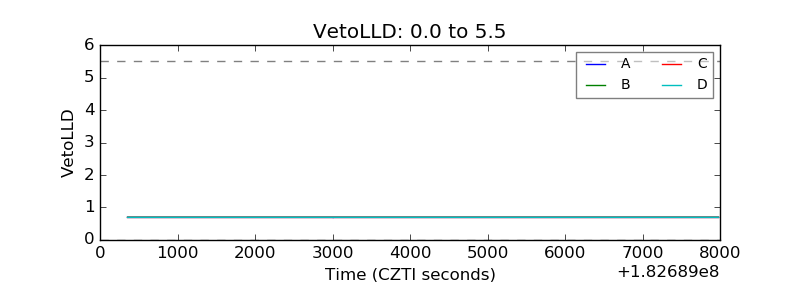 |
| Alpha Counter | 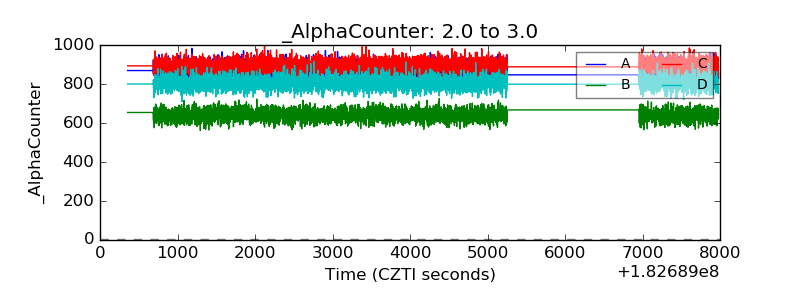 |
| _CPM_Rate | 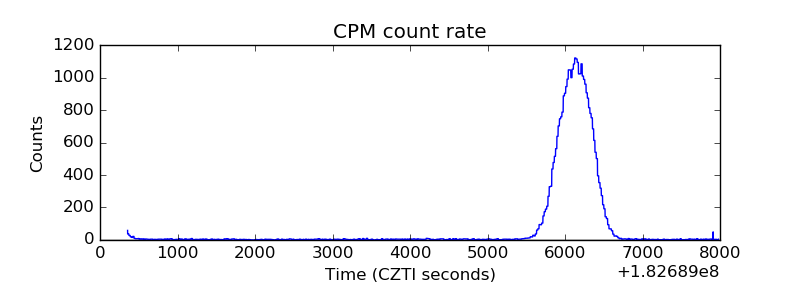 |
| CZT Counter | 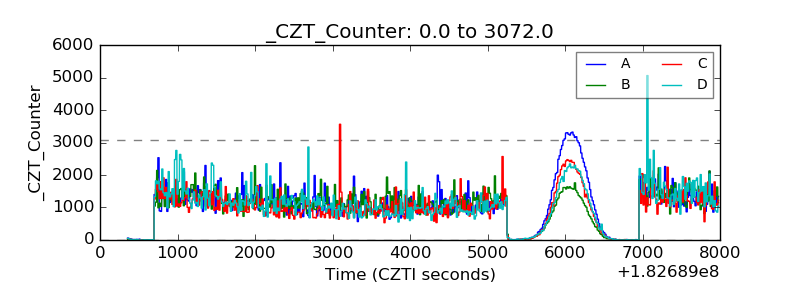 |
| +2.5 Volts monitor |  |
| +5 Volts monitor |  |
| _ROLL_ROT | 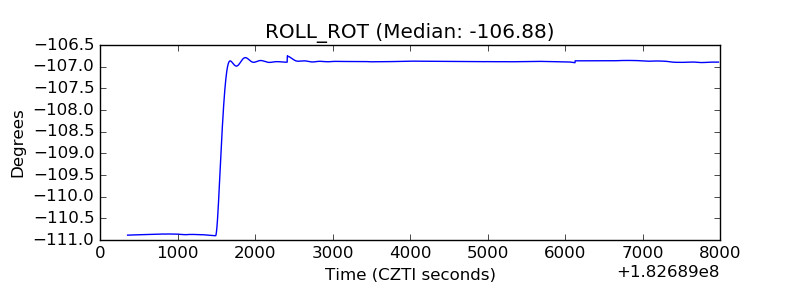 |
| _Roll_DEC |  |
| _Roll_RA | 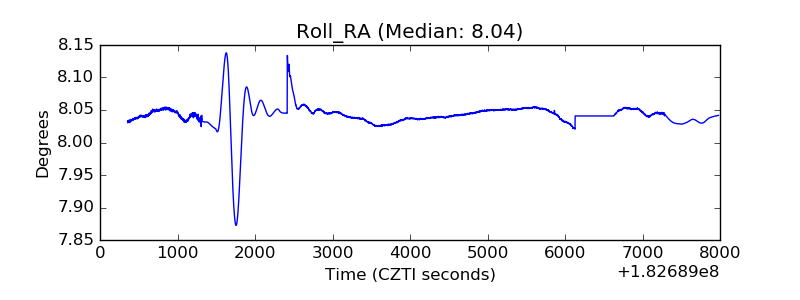 |
| Veto Counter | 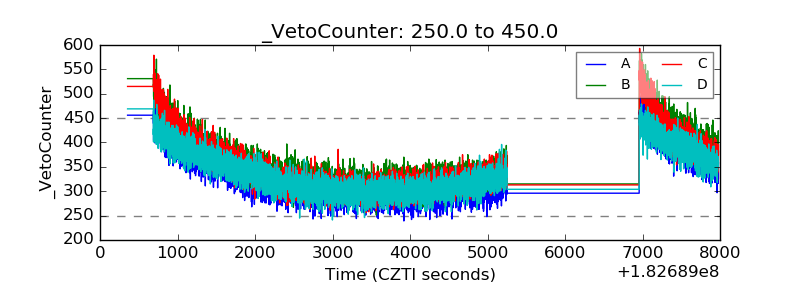 |