| Param | Original file | Final file |
|---|---|---|
| Filename | modeM0/AS1P01_126T01_9000000030_00276cztM0_level2.evt | modeM0/AS1P01_126T01_9000000030_00276cztM0_level2_quad_clean.evt |
| Size (bytes) | 794,782,080 | 68,843,520 |
| Size | 758.0 MB | 65.7 MB |
| Events in quadrant A | 6,163,986 | 430,551 |
| Events in quadrant B | 6,310,900 | 434,841 |
| Events in quadrant C | 5,597,169 | 424,123 |
| Events in quadrant D | 5,632,982 | 412,092 |
| Mode M0 | |||
|---|---|---|---|
| Quadrant | BADHDUFLAG | Total packets | Discarded packets |
| A | 0 | 22230 | 2 |
| B | 0 | 22671 | 1 |
| C | 0 | 20587 | 1 |
| D | 0 | 20644 | 1 |
| Mode M9 | |||
|---|---|---|---|
| Quadrant | BADHDUFLAG | Total packets | Discarded packets |
| A | 0 | 18 | 0 |
| B | 0 | 18 | 0 |
| C | 0 | 18 | 0 |
| D | 0 | 18 | 0 |
| Mode SS | |||
|---|---|---|---|
| Quadrant | BADHDUFLAG | Total packets | Discarded packets |
| A | 0 | 110 | 0 |
| B | 0 | 110 | 0 |
| C | 0 | 110 | 0 |
| D | 0 | 110 | 0 |
| Quadrant | Total seconds | Saturated seconds | Saturation percentage |
|---|---|---|---|
| A | 5476 | 4 | 0.073046% |
| B | 5476 | 9 | 0.164354% |
| C | 5476 | 1 | 0.018262% |
| D | 5476 | 22 | 0.401753% |
Noise dominated data is calculated using 1-second bins in cleaned event files. If a bin has >2000 counts, and if more than 50% of those come from <1% of pixels, then it is considered to be noise-dominated and hence unusable.
| Quadrant | # 1 sec bins | Bins with >0 counts | Bins with >2000 counts | High rate bins dominated by noise | Noise dominated (total time) | Noise dominated (detector-on time) | Marked lightcurve |
|---|---|---|---|---|---|---|---|
| A | 7212 | 5477 | 99 | 99 | 1.37% | 1.81% | 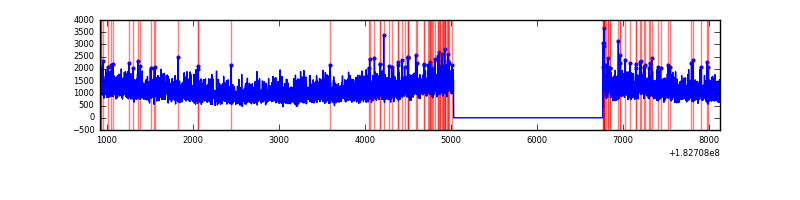 |
| B | 7212 | 5477 | 97 | 97 | 1.34% | 1.77% | 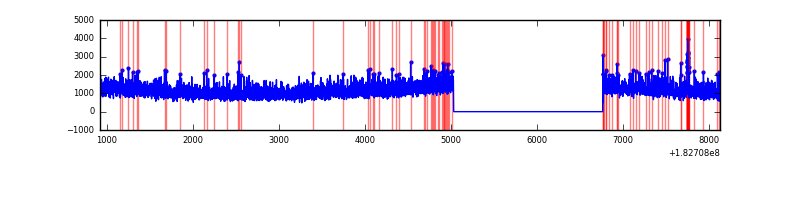 |
| C | 7212 | 5477 | 34 | 34 | 0.47% | 0.62% | 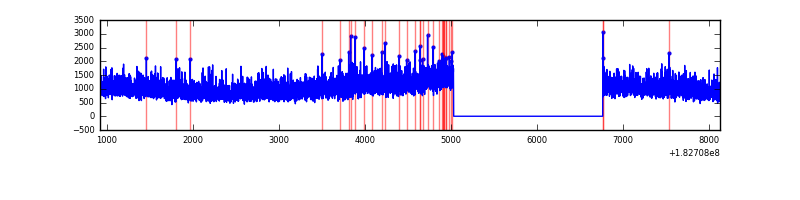 |
| D | 7212 | 5477 | 76 | 76 | 1.05% | 1.39% | 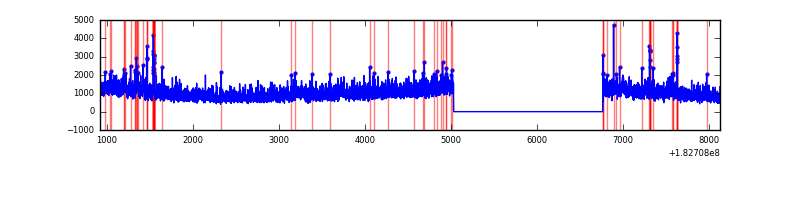 |
Top three noisy pixels from each quadrant. If the there are fewer than three noisy pixels in the level2.evt file, extra rows are filled as -1
| Pixel properties | Quadrant properties | ||||||
|---|---|---|---|---|---|---|---|
| Quadrant | DetID | PixID | Counts | Sigma | Mean | Median | Sigma |
| A | 12 | 149 | 22081 | 58.0 | 1582 | 1563 | 353.7 |
| A | 15 | 66 | 8285 | 19.0 | 1582 | 1563 | 353.7 |
| A | 13 | 239 | 5813 | 12.01 | 1582 | 1563 | 353.7 |
| B | 10 | 14 | 50109 | 129.23 | 1611 | 1625 | 375.2 |
| B | 5 | 46 | 38703 | 98.83 | 1611 | 1625 | 375.2 |
| B | 5 | 184 | 28712 | 72.2 | 1611 | 1625 | 375.2 |
| C | 1 | 192 | 18325 | 43.02 | 1414 | 1461 | 392.0 |
| C | 2 | 192 | 12793 | 28.91 | 1414 | 1461 | 392.0 |
| C | 3 | 159 | 6576 | 13.05 | 1414 | 1461 | 392.0 |
| D | 13 | 7 | 213218 | 501.53 | 1345 | 1397 | 422.4 |
| D | 1 | 5 | 150803 | 353.75 | 1345 | 1397 | 422.4 |
| D | 2 | 37 | 35434 | 80.59 | 1345 | 1397 | 422.4 |
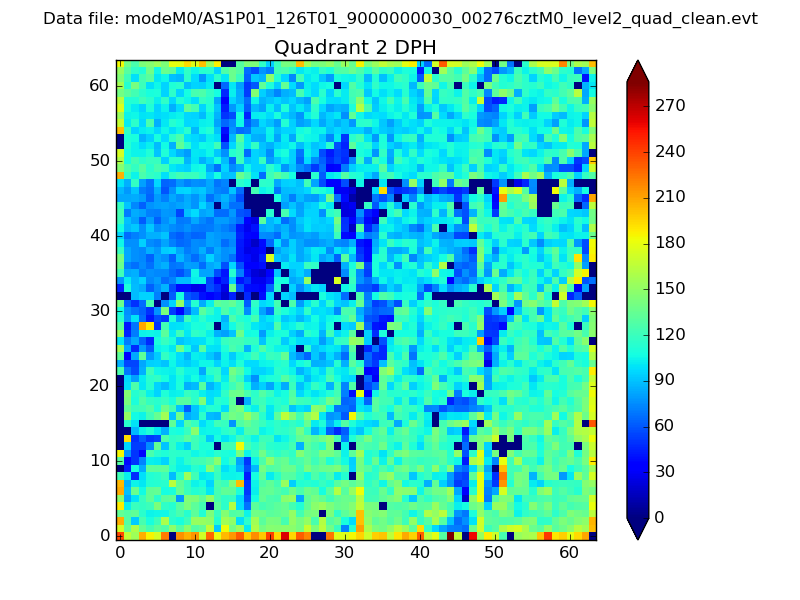
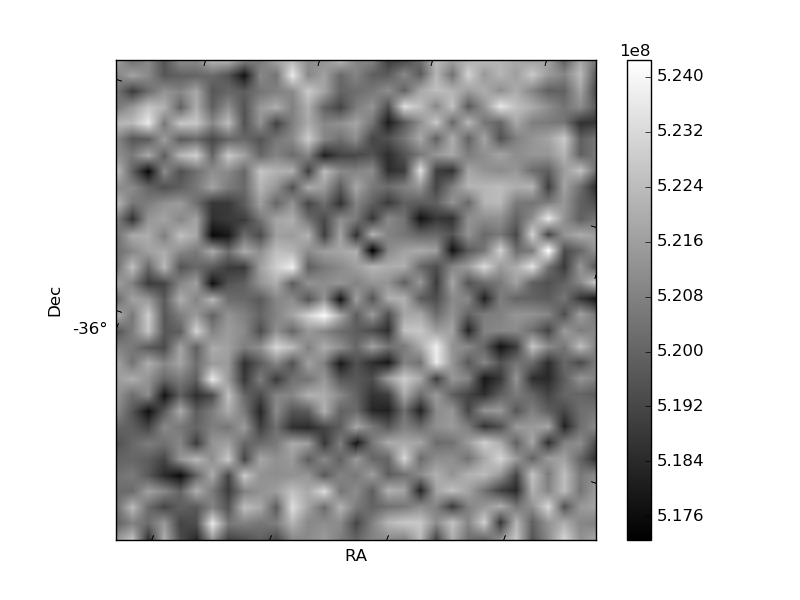
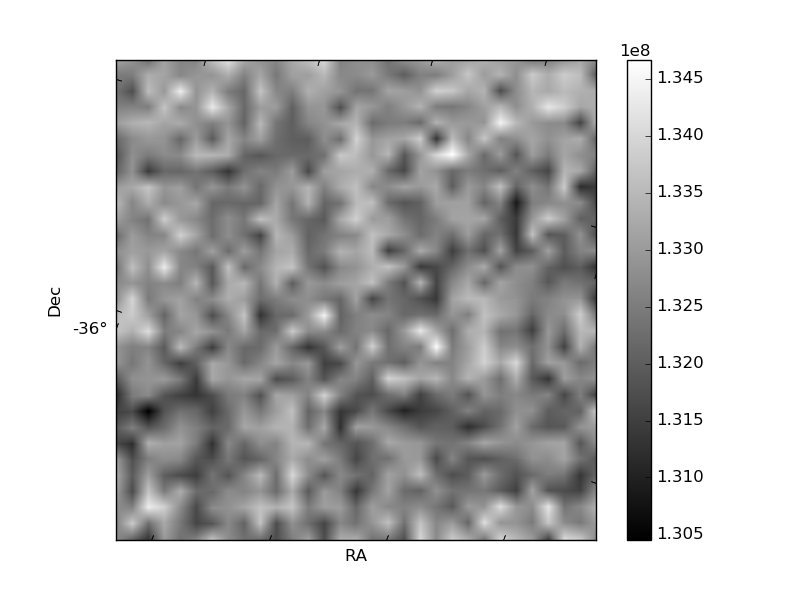
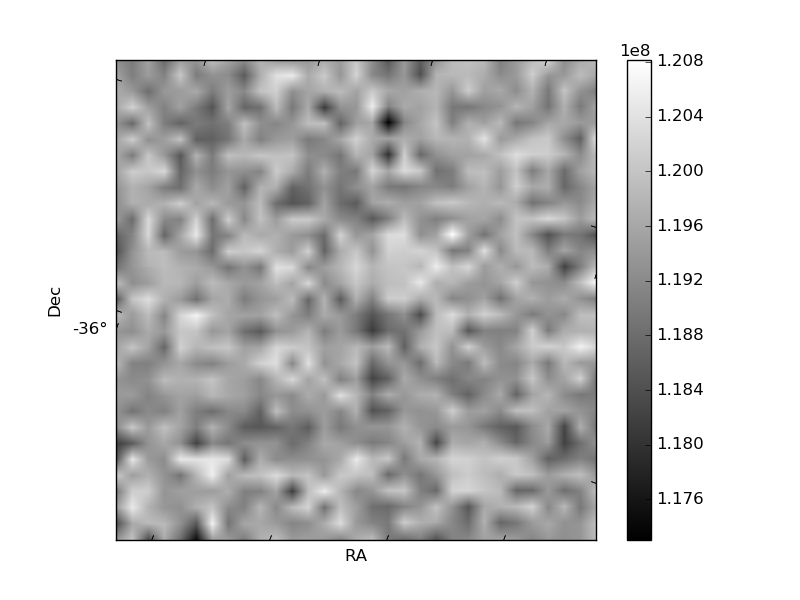
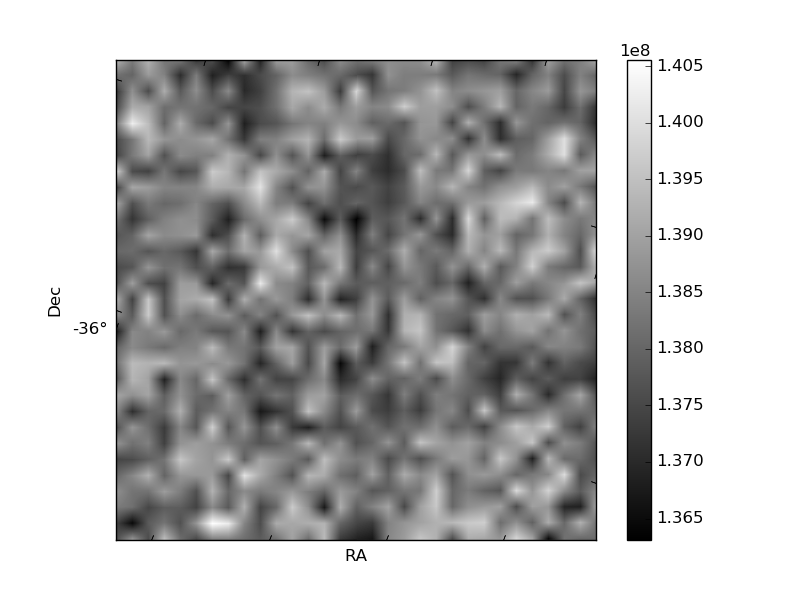
Histogram calculated using DETX and DETY for each event in the final _common_clean file
| Quadrant A | 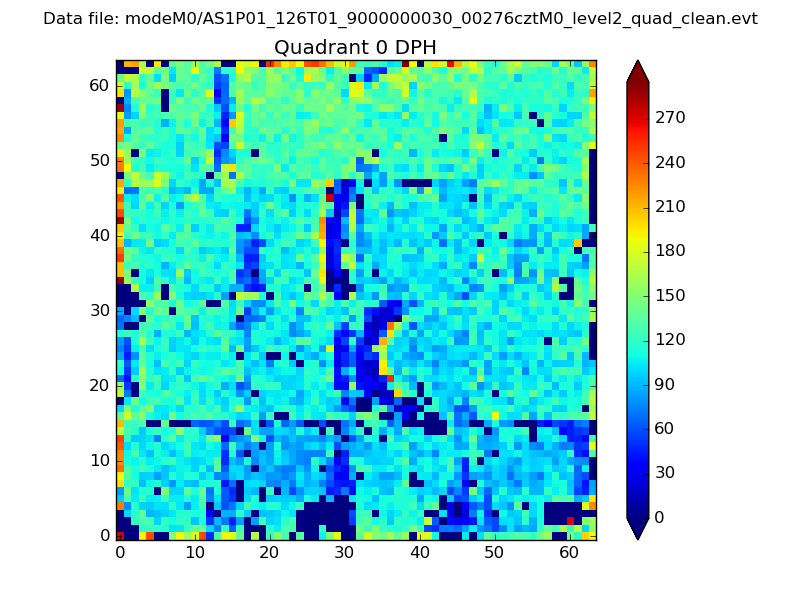 |
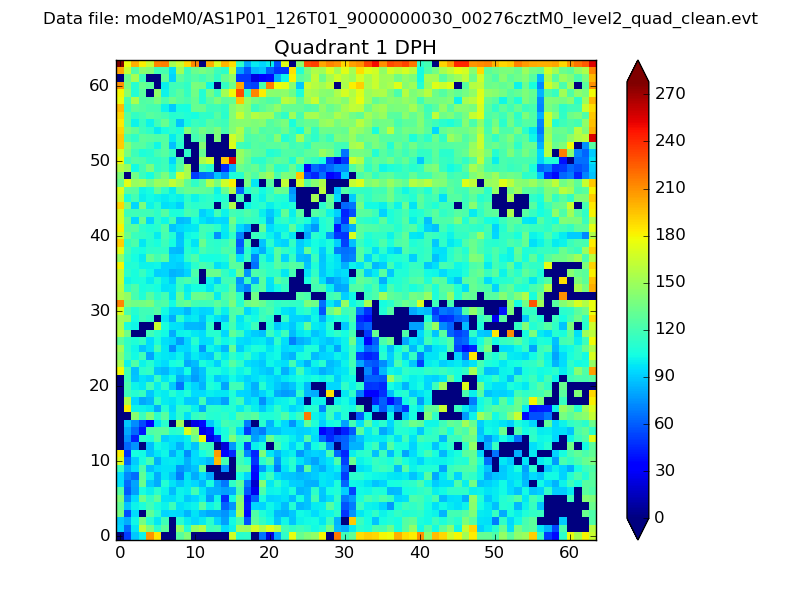 |
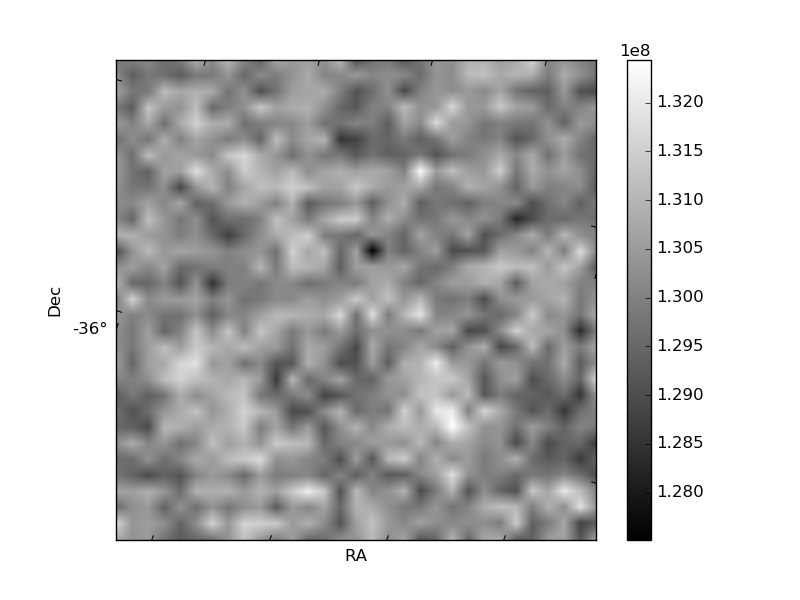
Quadrant B |
|---|---|---|---|
| Quadrant D | 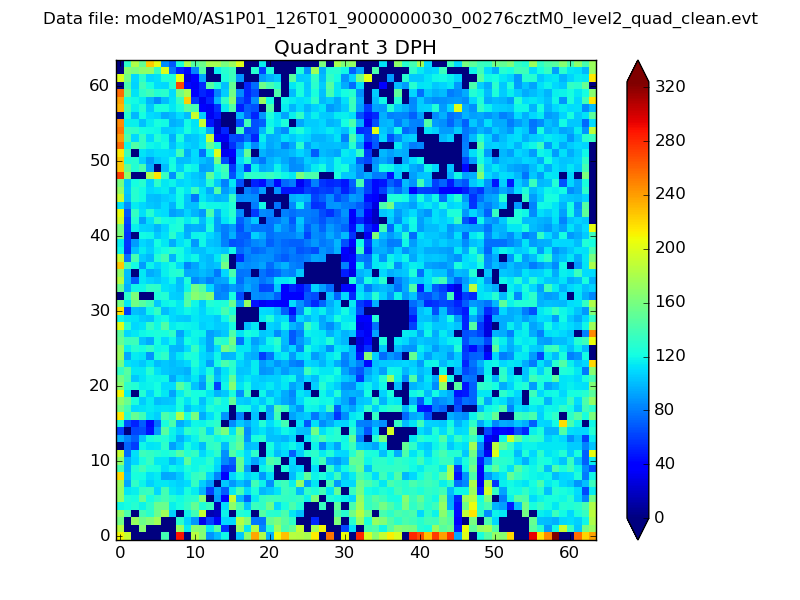 |
 |
Quadrant C |
| Plot type | Count rate plots | Images |
|---|---|---|
| Comparison with Poisson distribution Blue bars denote a histogram of data divided into 1 sec bins. Red curve is a Poisson curve with rate = median count rate of data. |
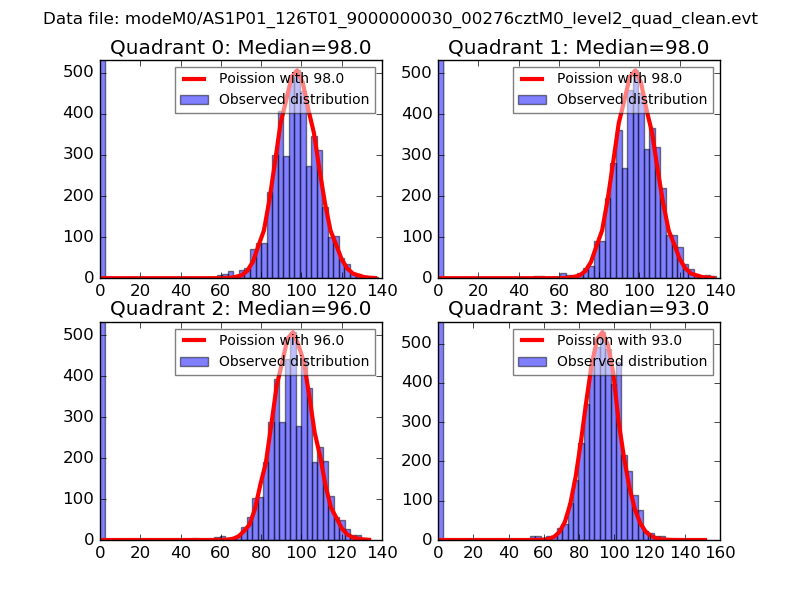 |
 |
| Quadrant-wise count rates Data is divided into 100 sec bins |
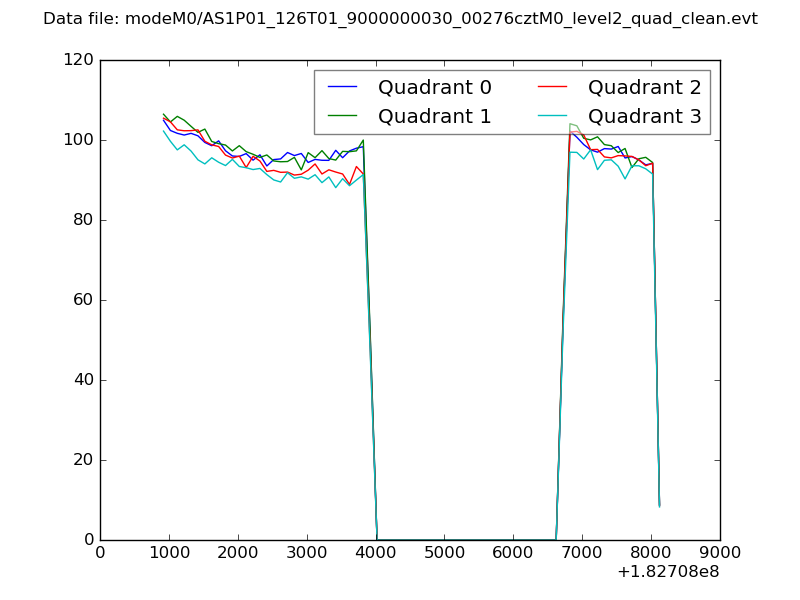 |
|
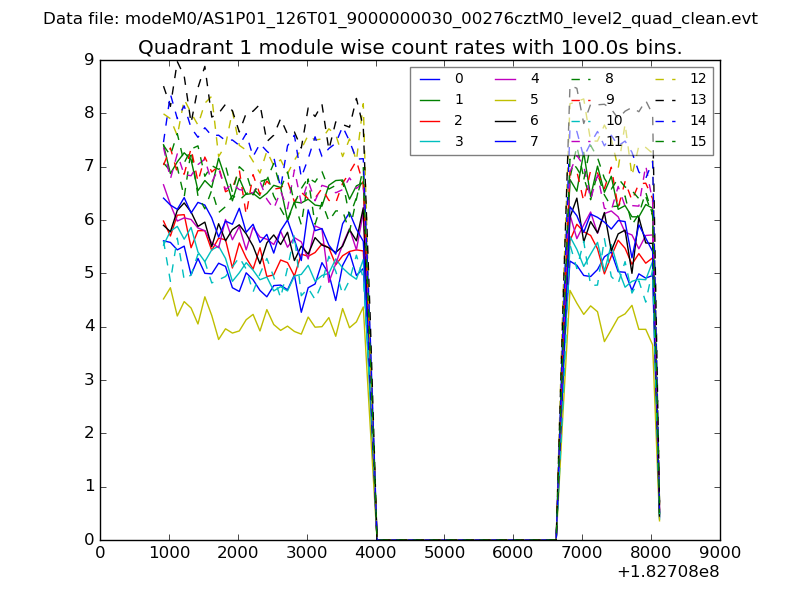
| Module-wise count rates for Quadrant A Data is divided into 100 sec bins |
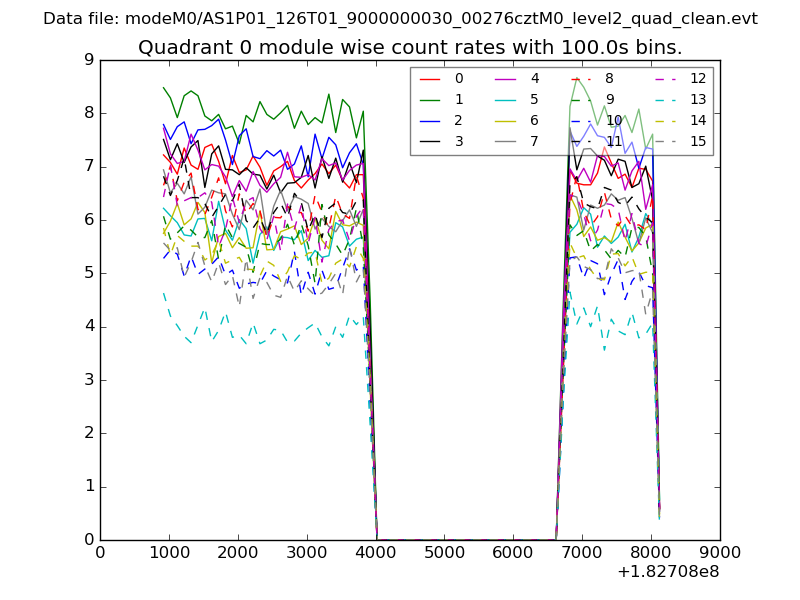 |
 |
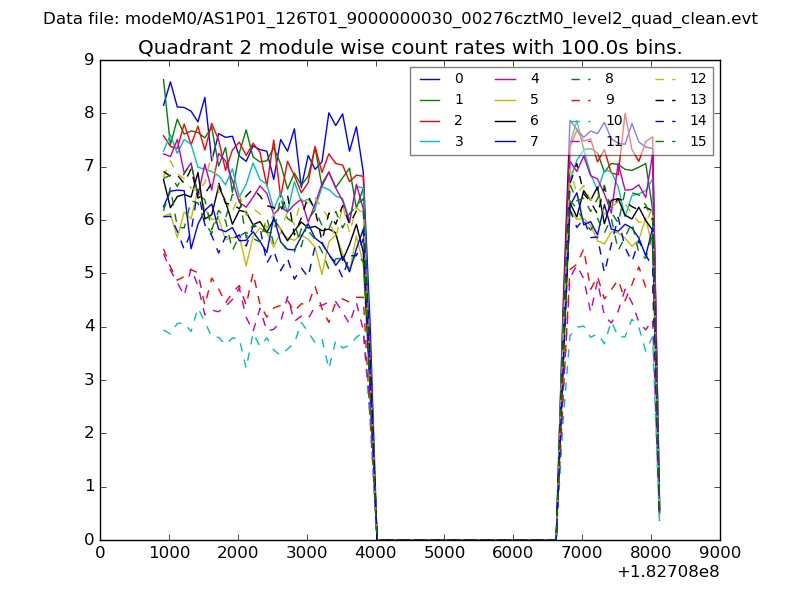
| Module-wise count rates for Quadrant B Data is divided into 100 sec bins |
 |
 |
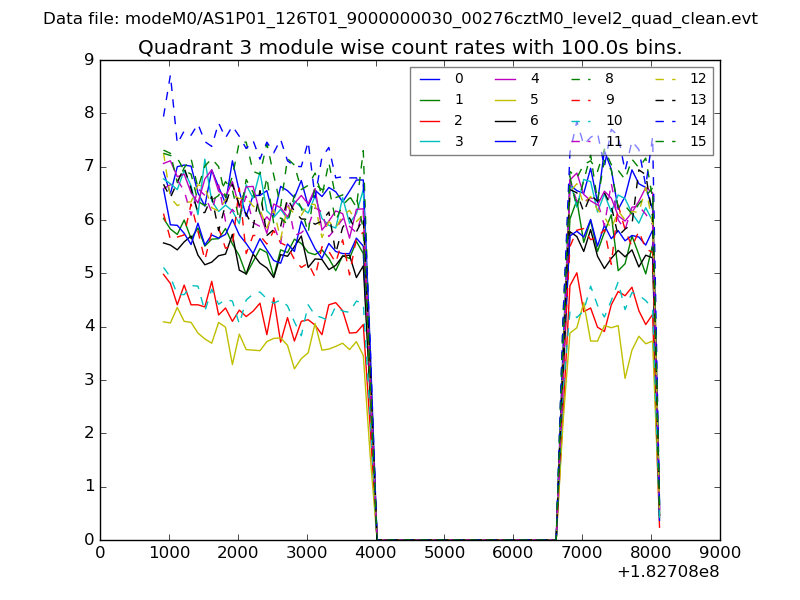
| Module-wise count rates for Quadrant C Data is divided into 100 sec bins |
 |
 |
| Module-wise count rates for Quadrant D Data is divided into 100 sec bins |
 |
 |
| Parameter | Plot |
|---|---|
| CZT HV Monitor | 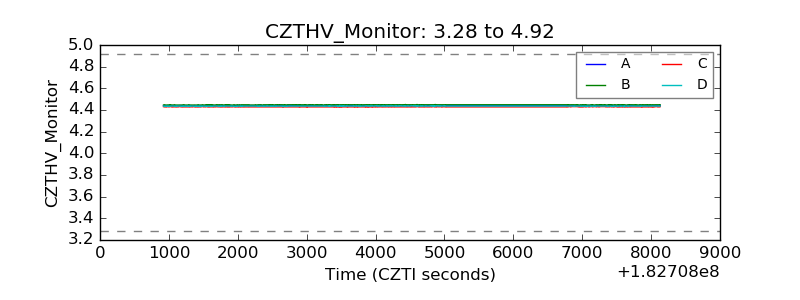 |
| D_VDD | 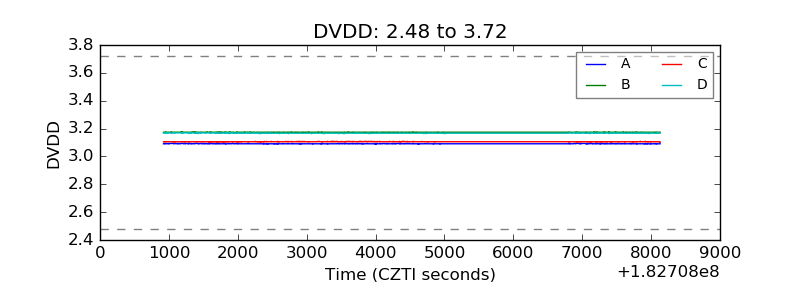 |
| Temperature 1 | 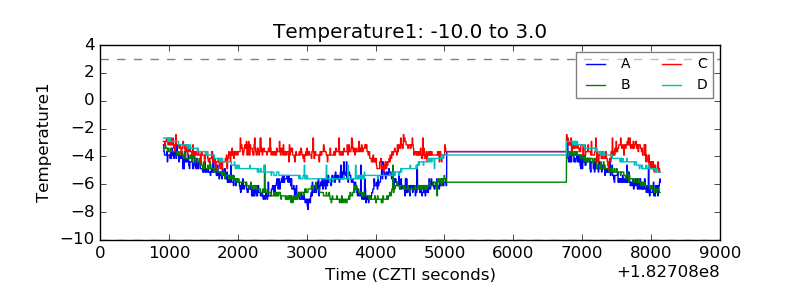 |
| Veto HV Monitor | 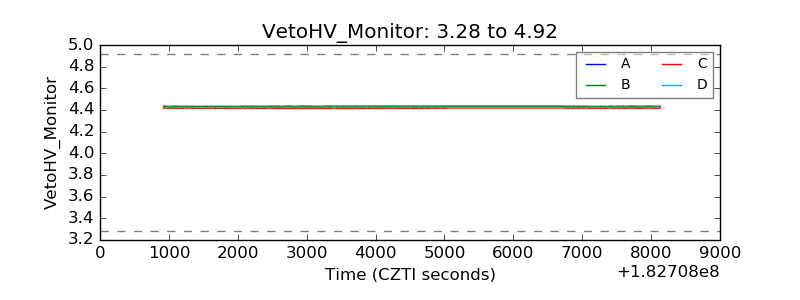 |
| Veto LLD | 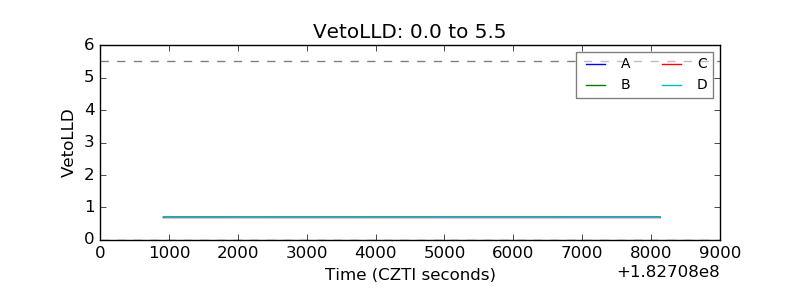 |
| Alpha Counter | 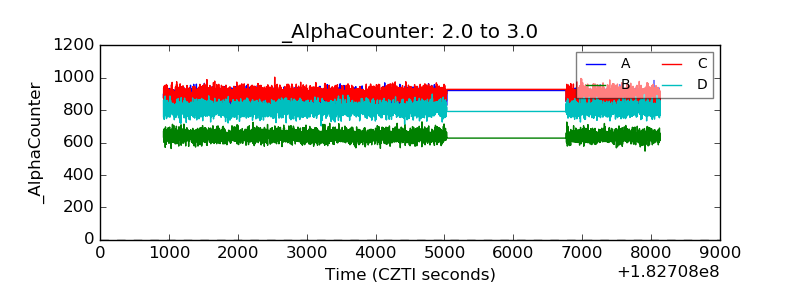 |
| _CPM_Rate | 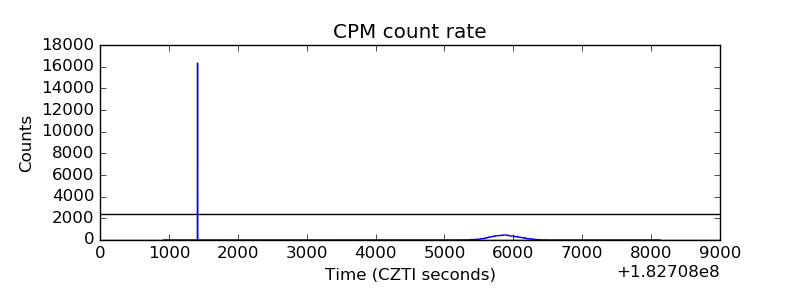 |
| CZT Counter | 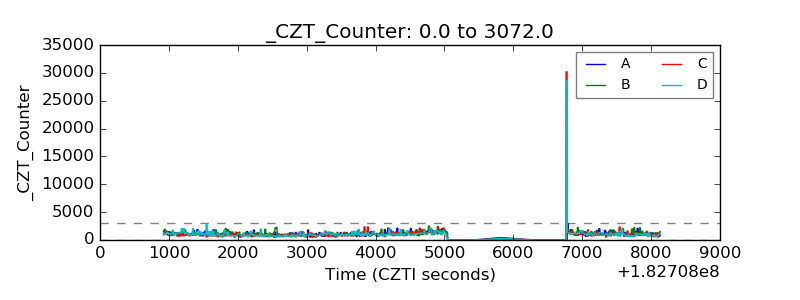 |
| +2.5 Volts monitor | 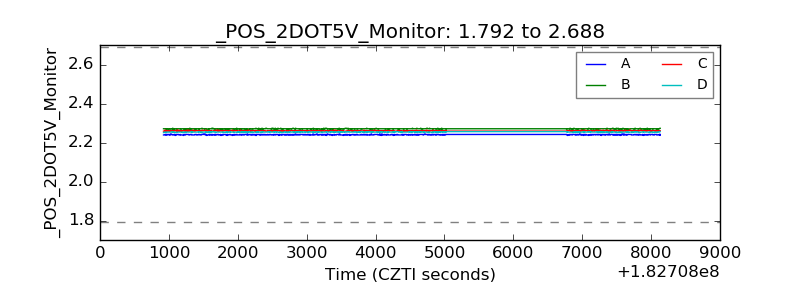 |
| +5 Volts monitor | 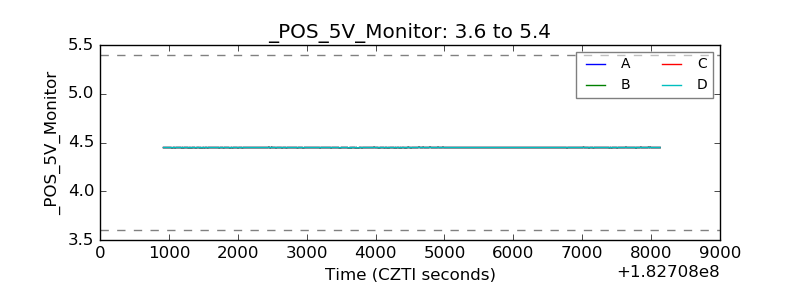 |
| _ROLL_ROT | 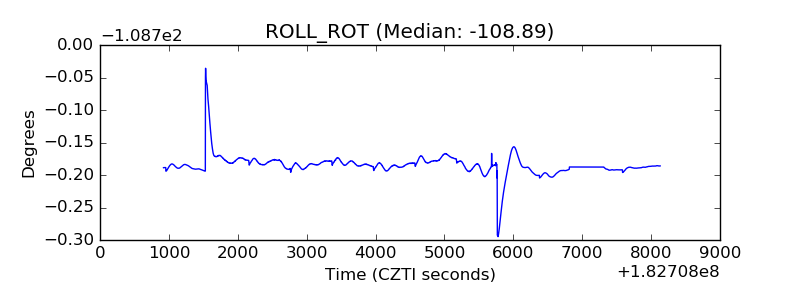 |
| _Roll_DEC | 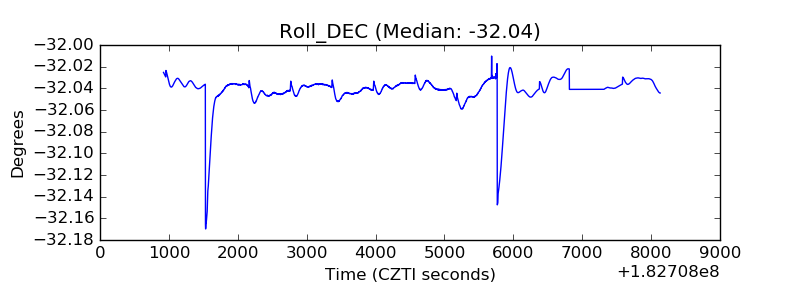 |
| _Roll_RA | 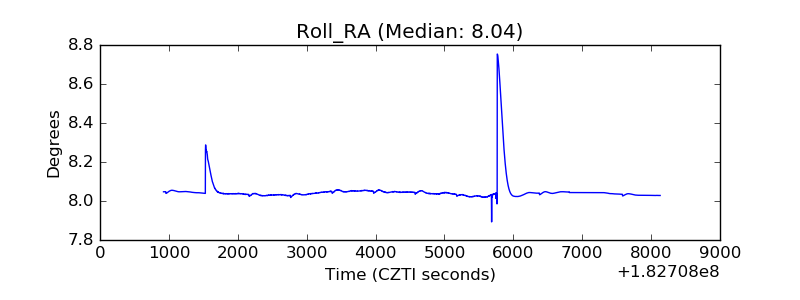 |
| Veto Counter | 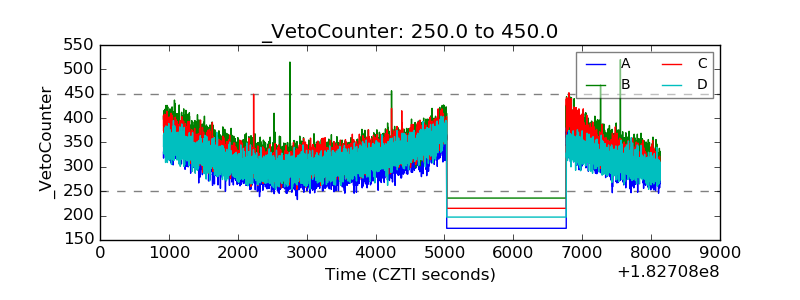 |