| Param | Original file | Final file |
|---|---|---|
| Filename | modeM0/AS1P01_126T01_9000000030_00279cztM0_level2.evt | modeM0/AS1P01_126T01_9000000030_00279cztM0_level2_quad_clean.evt |
| Size (bytes) | 824,564,160 | 53,346,240 |
| Size | 786.4 MB | 50.9 MB |
| Events in quadrant A | 6,399,387 | 309,140 |
| Events in quadrant B | 6,478,448 | 312,243 |
| Events in quadrant C | 6,006,679 | 302,058 |
| Events in quadrant D | 5,711,942 | 297,386 |
| Mode M0 | |||
|---|---|---|---|
| Quadrant | BADHDUFLAG | Total packets | Discarded packets |
| A | 0 | 23051 | 3 |
| B | 0 | 23247 | 2 |
| C | 0 | 21908 | 2 |
| D | 0 | 21007 | 2 |
| Mode M9 | |||
|---|---|---|---|
| Quadrant | BADHDUFLAG | Total packets | Discarded packets |
| A | 0 | 17 | 0 |
| B | 0 | 17 | 0 |
| C | 0 | 17 | 0 |
| D | 0 | 18 | 0 |
| Mode SS | |||
|---|---|---|---|
| Quadrant | BADHDUFLAG | Total packets | Discarded packets |
| A | 0 | 114 | 0 |
| B | 0 | 114 | 0 |
| C | 0 | 114 | 0 |
| D | 0 | 114 | 0 |
| Quadrant | Total seconds | Saturated seconds | Saturation percentage |
|---|---|---|---|
| A | 5635 | 11 | 0.195209% |
| B | 5635 | 2 | 0.035492% |
| C | 5635 | 6 | 0.106477% |
| D | 5635 | 15 | 0.266193% |
Noise dominated data is calculated using 1-second bins in cleaned event files. If a bin has >2000 counts, and if more than 50% of those come from <1% of pixels, then it is considered to be noise-dominated and hence unusable.
| Quadrant | # 1 sec bins | Bins with >0 counts | Bins with >2000 counts | High rate bins dominated by noise | Noise dominated (total time) | Noise dominated (detector-on time) | Marked lightcurve |
|---|---|---|---|---|---|---|---|
| A | 7340 | 5636 | 146 | 146 | 1.99% | 2.59% | 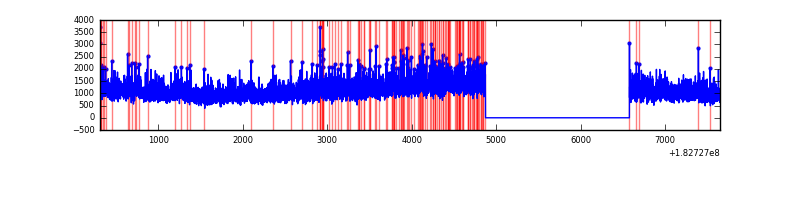 |
| B | 7340 | 5636 | 67 | 67 | 0.91% | 1.19% |  |
| C | 7340 | 5636 | 47 | 47 | 0.64% | 0.83% | 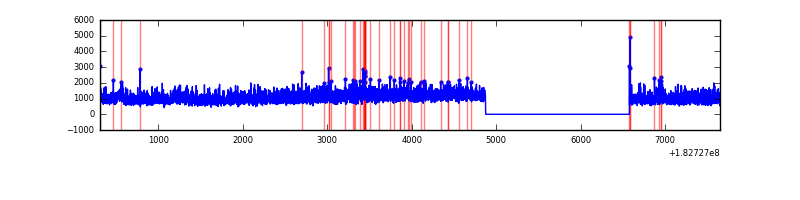 |
| D | 7340 | 5636 | 55 | 55 | 0.75% | 0.98% | 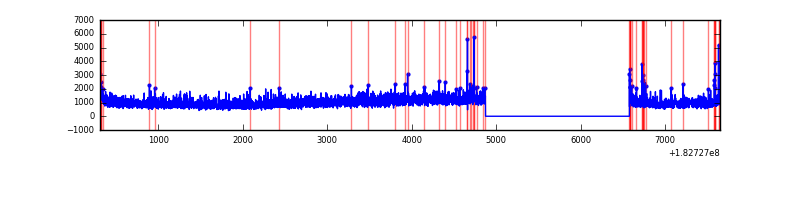 |
Top three noisy pixels from each quadrant. If the there are fewer than three noisy pixels in the level2.evt file, extra rows are filled as -1
| Pixel properties | Quadrant properties | ||||||
|---|---|---|---|---|---|---|---|
| Quadrant | DetID | PixID | Counts | Sigma | Mean | Median | Sigma |
| A | 8 | 65 | 71815 | 195.47 | 1621 | 1608 | 359.2 |
| A | 6 | 47 | 22703 | 58.73 | 1621 | 1608 | 359.2 |
| A | 5 | 244 | 10136 | 23.74 | 1621 | 1608 | 359.2 |
| B | 5 | 176 | 100304 | 254.95 | 1646 | 1659 | 386.9 |
| B | 10 | 14 | 42363 | 105.2 | 1646 | 1659 | 386.9 |
| B | 5 | 46 | 36170 | 89.19 | 1646 | 1659 | 386.9 |
| C | 14 | 48 | 61240 | 142.37 | 1503 | 1557 | 419.2 |
| C | 3 | 159 | 34246 | 77.98 | 1503 | 1557 | 419.2 |
| C | 1 | 1 | 8117 | 15.65 | 1503 | 1557 | 419.2 |
| D | 2 | 33 | 56286 | 122.98 | 1421 | 1483 | 445.6 |
| D | 13 | 7 | 44641 | 96.85 | 1421 | 1483 | 445.6 |
| D | 1 | 7 | 25638 | 54.2 | 1421 | 1483 | 445.6 |
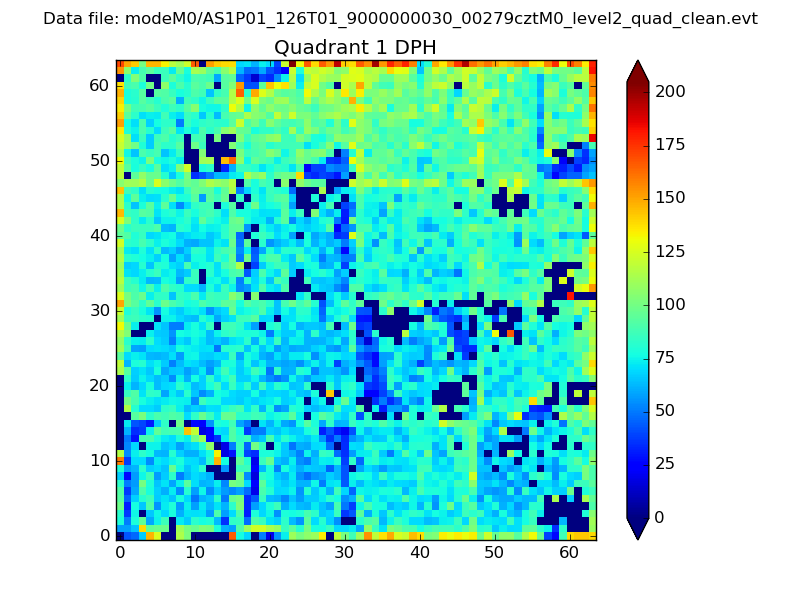
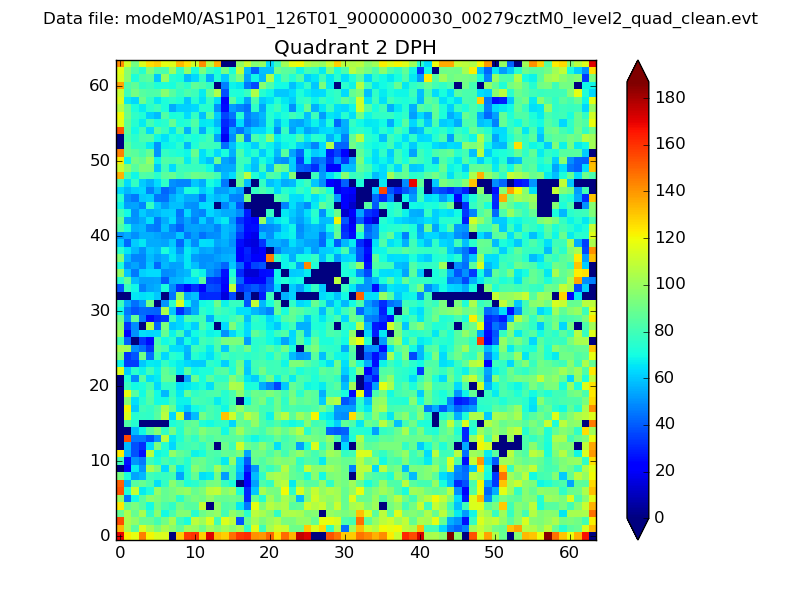
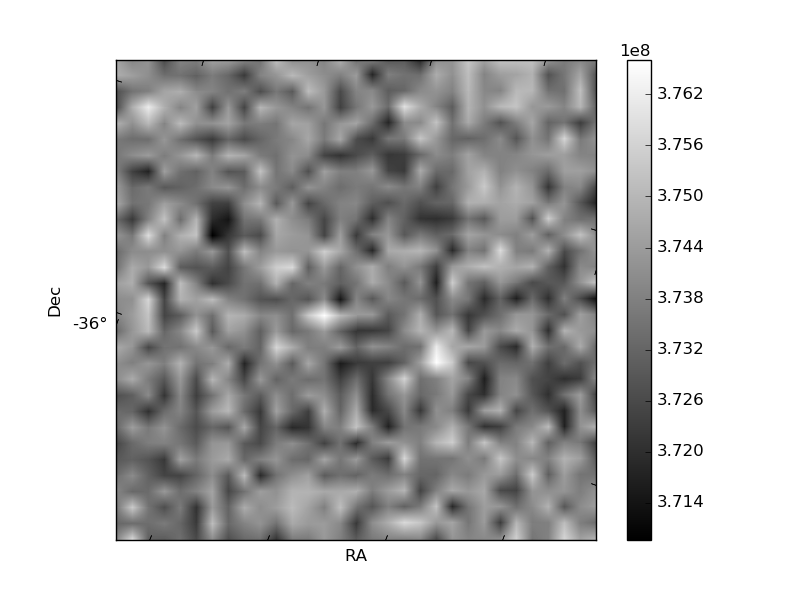
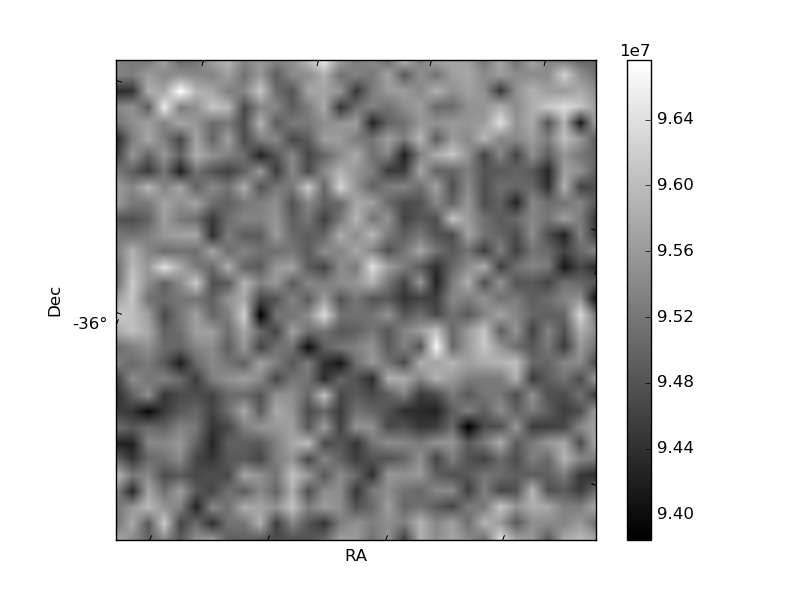
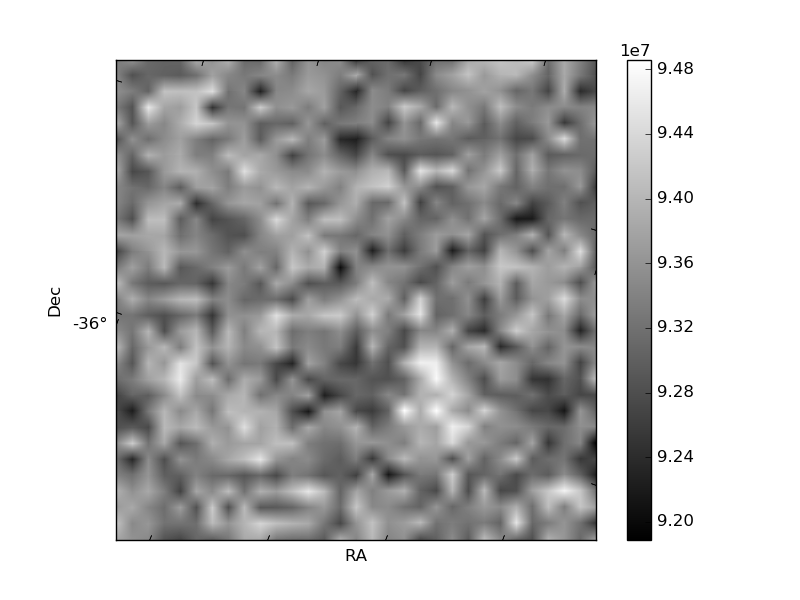
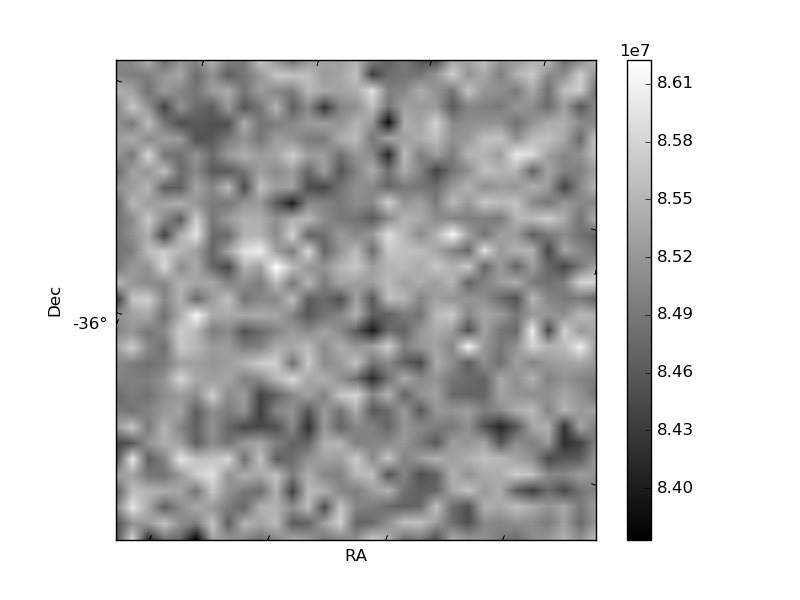
Histogram calculated using DETX and DETY for each event in the final _common_clean file
| Quadrant A | 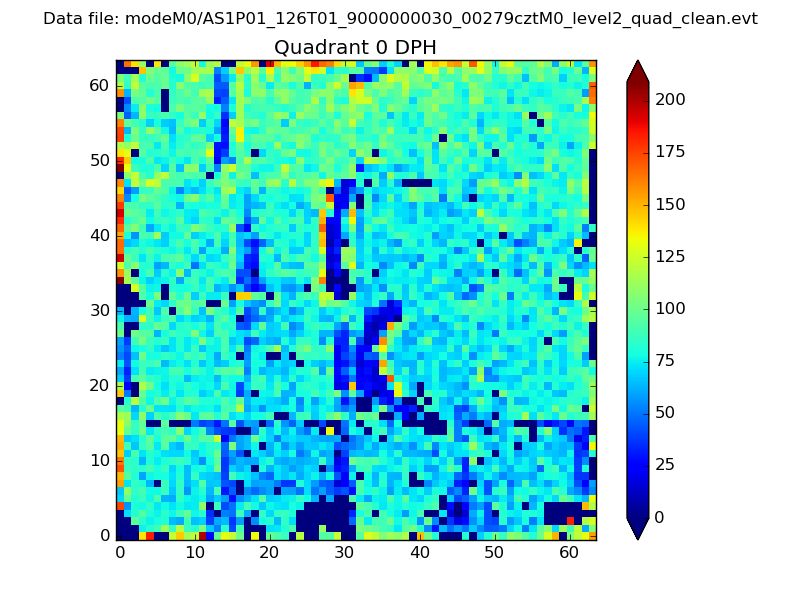 |
 |
Quadrant B |
|---|---|---|---|
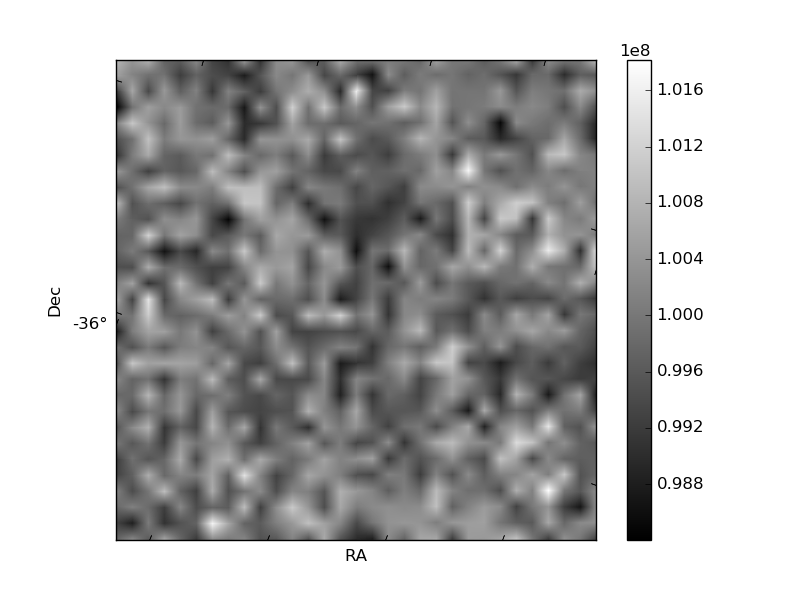
| Quadrant D | 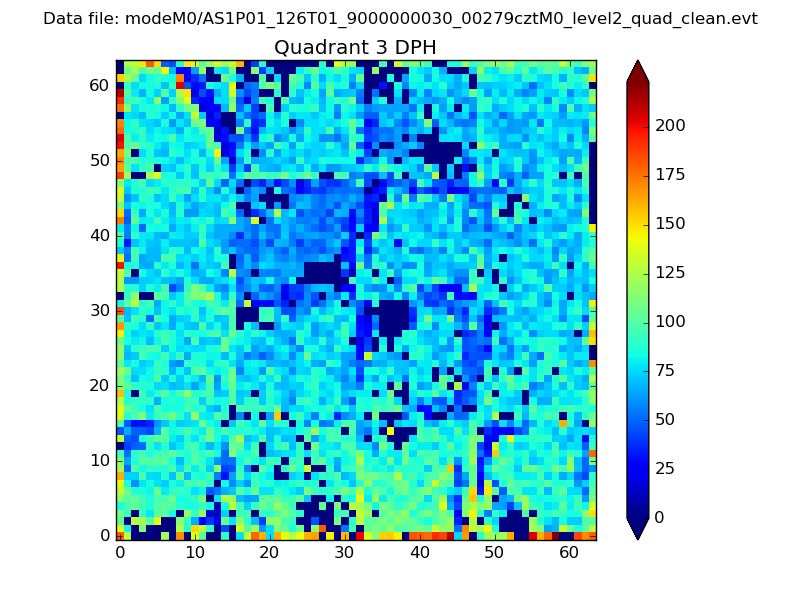 |
 |
Quadrant C |
| Plot type | Count rate plots | Images |
|---|---|---|
| Comparison with Poisson distribution Blue bars denote a histogram of data divided into 1 sec bins. Red curve is a Poisson curve with rate = median count rate of data. |
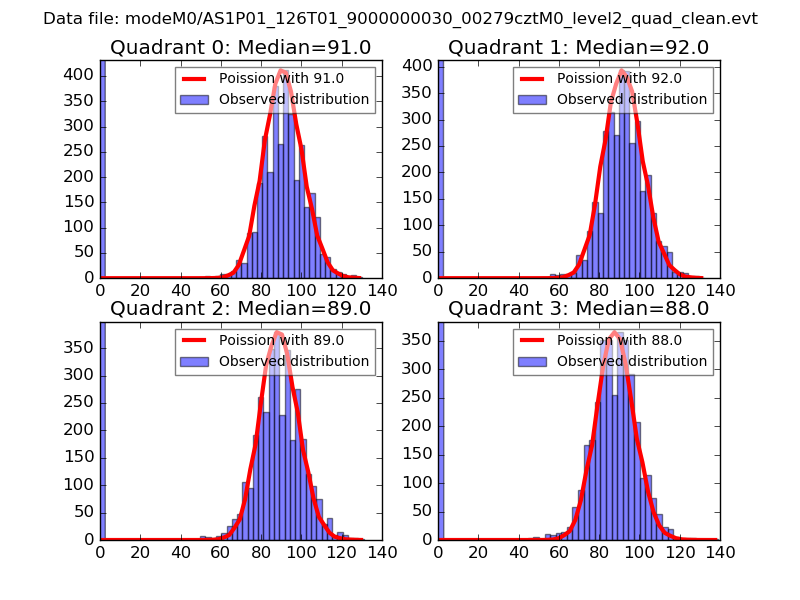 |
 |
| Quadrant-wise count rates Data is divided into 100 sec bins |
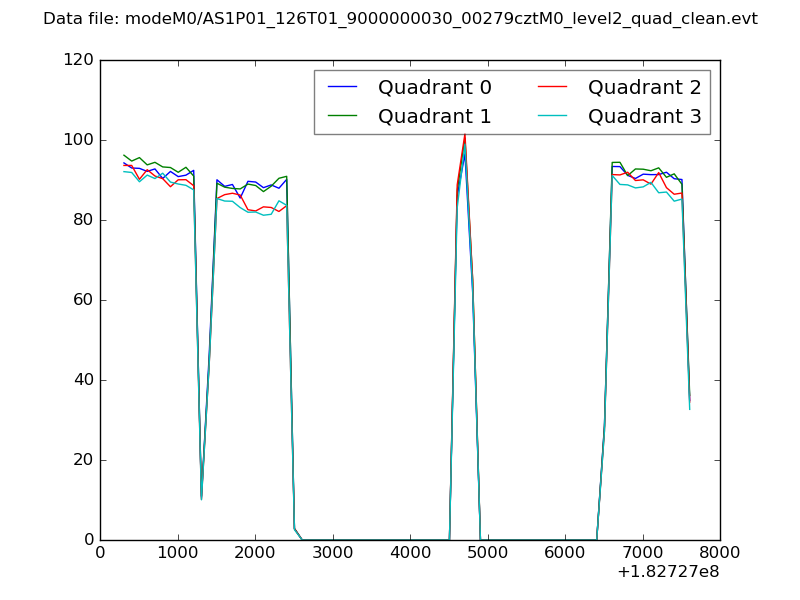 |
|
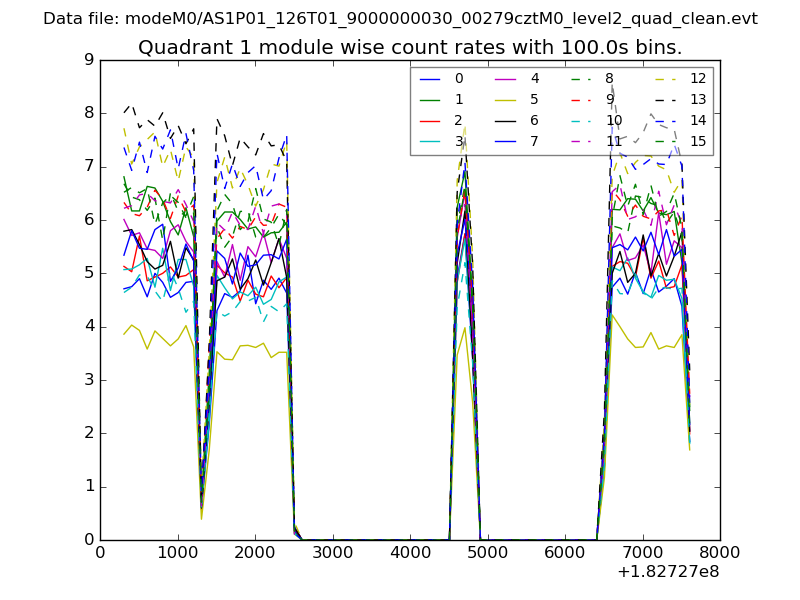
| Module-wise count rates for Quadrant A Data is divided into 100 sec bins |
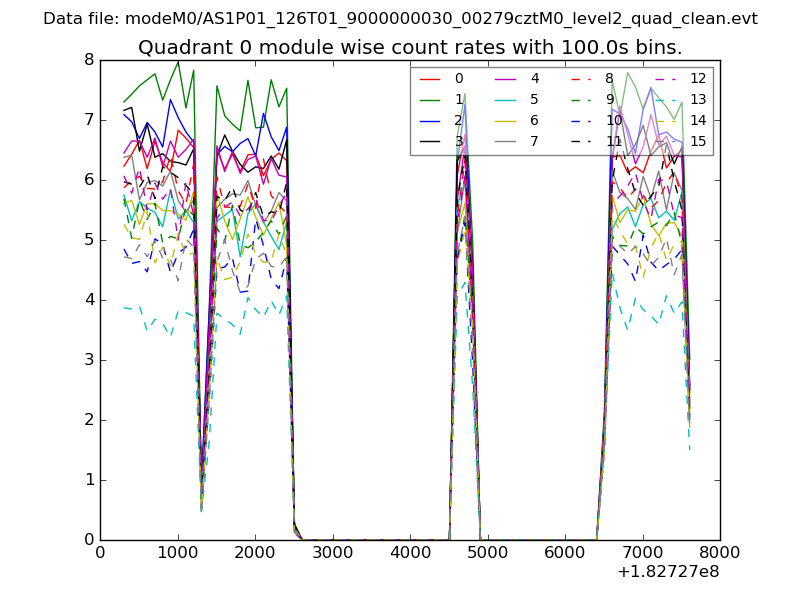 |
 |
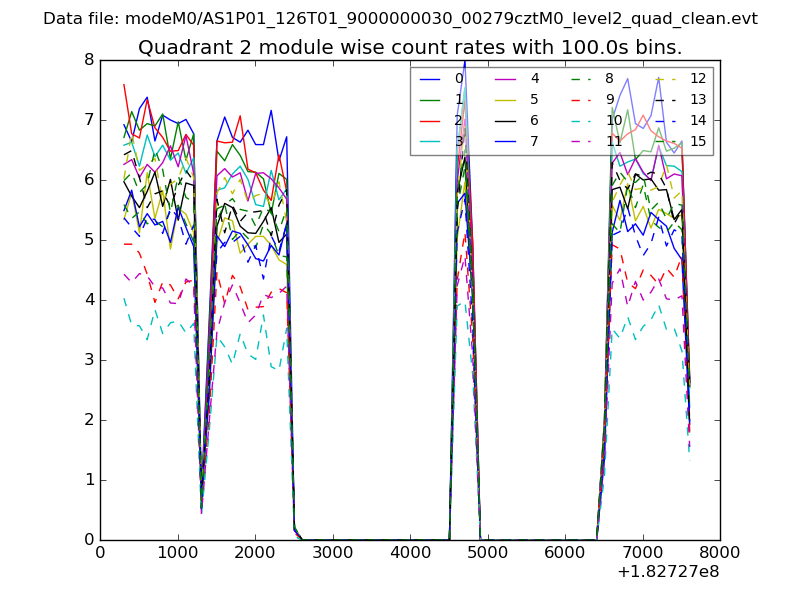
| Module-wise count rates for Quadrant B Data is divided into 100 sec bins |
 |
 |
| Module-wise count rates for Quadrant C Data is divided into 100 sec bins |
 |
 |
| Module-wise count rates for Quadrant D Data is divided into 100 sec bins |
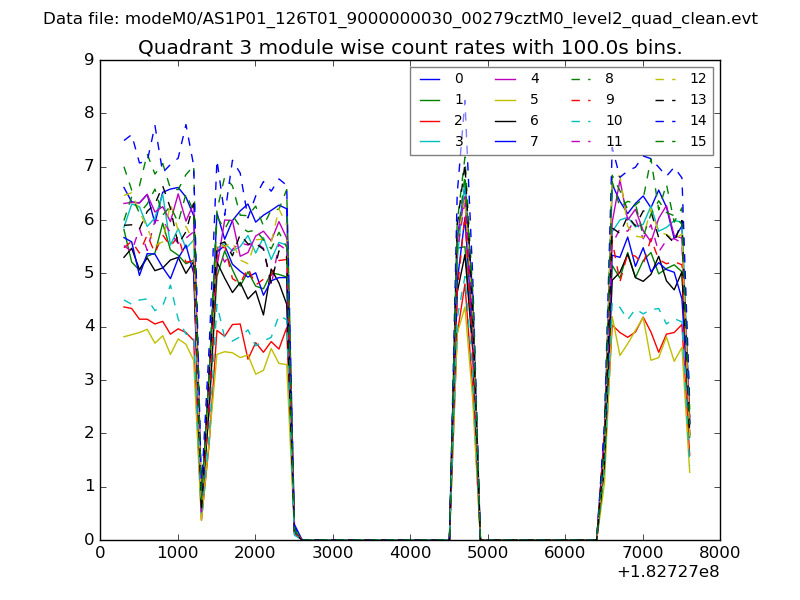 |
 |
| Parameter | Plot |
|---|---|
| CZT HV Monitor | 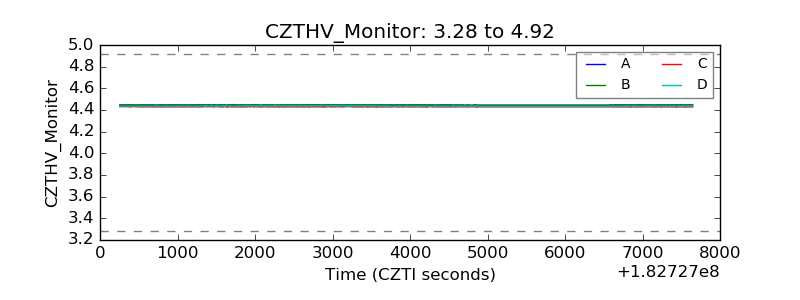 |
| D_VDD | 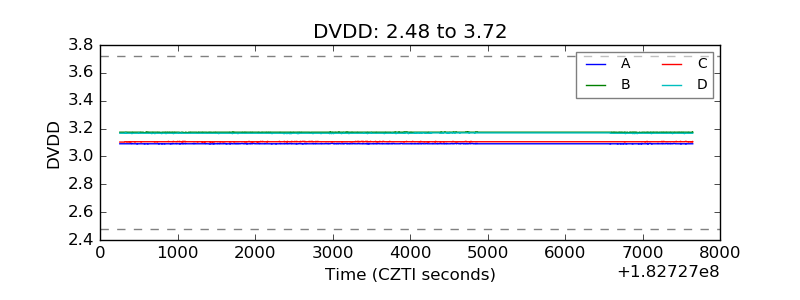 |
| Temperature 1 | 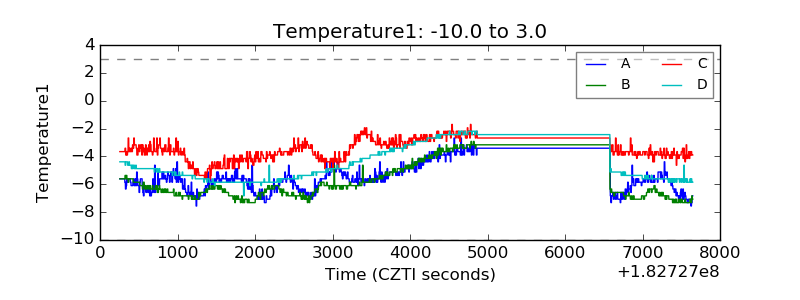 |
| Veto HV Monitor | 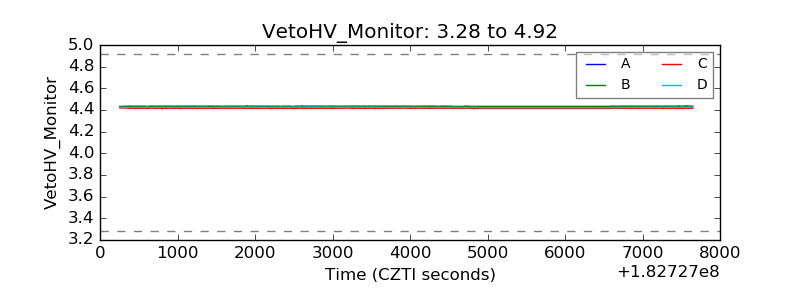 |
| Veto LLD | 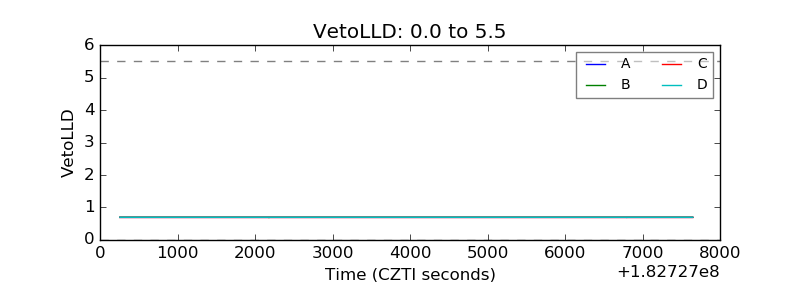 |
| Alpha Counter | 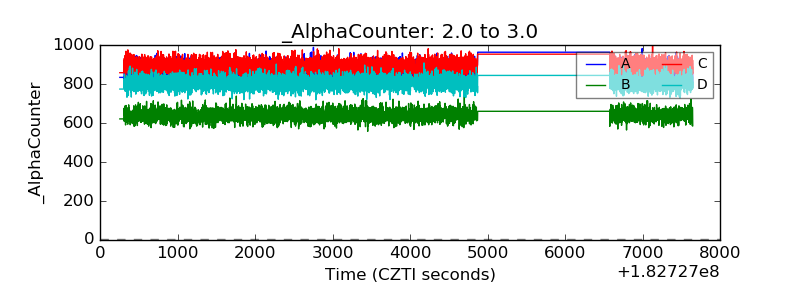 |
| _CPM_Rate | 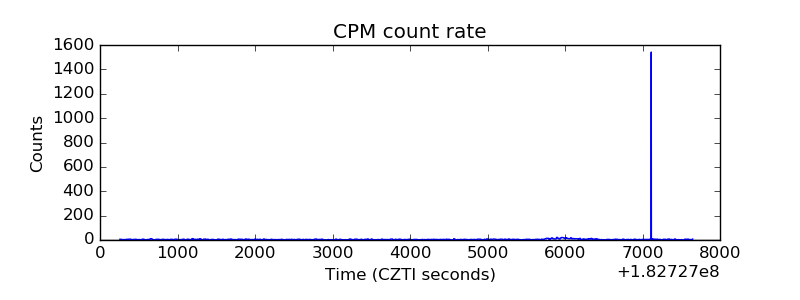 |
| CZT Counter | 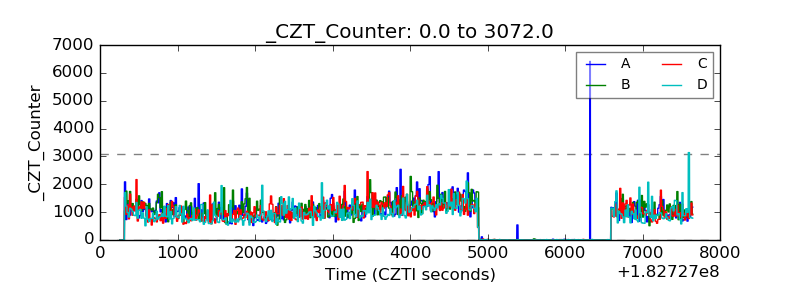 |
| +2.5 Volts monitor |  |
| +5 Volts monitor |  |
| _ROLL_ROT | 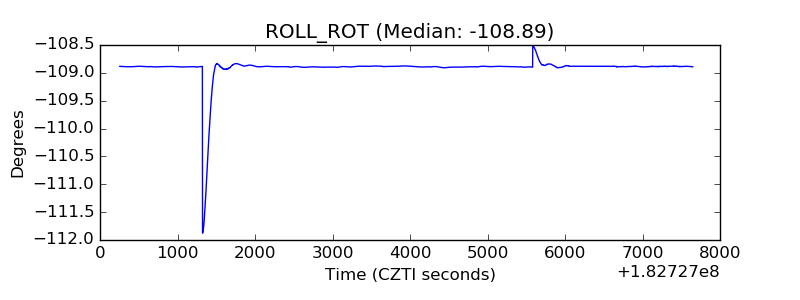 |
| _Roll_DEC | 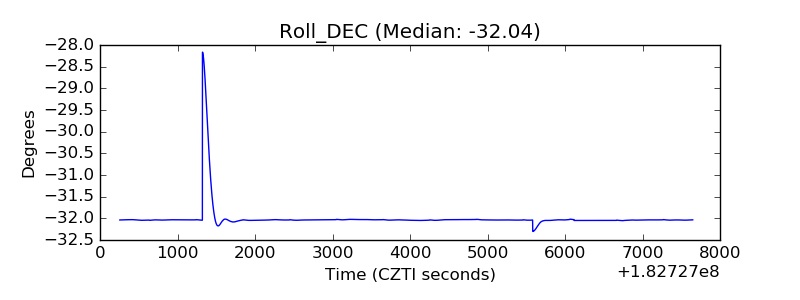 |
| _Roll_RA |  |
| Veto Counter | 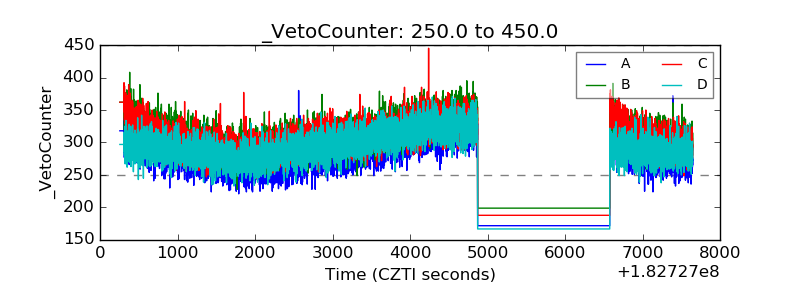 |