| Param | Original file | Final file |
|---|---|---|
| Filename | modeM0/AS1P01_126T01_9000000030_00280cztM0_level2.evt | modeM0/AS1P01_126T01_9000000030_00280cztM0_level2_quad_clean.evt |
| Size (bytes) | 846,944,640 | 55,031,040 |
| Size | 807.7 MB | 52.5 MB |
| Events in quadrant A | 6,459,346 | 323,208 |
| Events in quadrant B | 6,549,148 | 326,126 |
| Events in quadrant C | 6,055,753 | 315,454 |
| Events in quadrant D | 6,210,722 | 307,410 |
| Mode M0 | |||
|---|---|---|---|
| Quadrant | BADHDUFLAG | Total packets | Discarded packets |
| A | 0 | 23175 | 3 |
| B | 0 | 23428 | 2 |
| C | 0 | 22007 | 2 |
| D | 0 | 22477 | 2 |
| Mode M9 | |||
|---|---|---|---|
| Quadrant | BADHDUFLAG | Total packets | Discarded packets |
| A | 0 | 17 | 0 |
| B | 0 | 17 | 0 |
| C | 0 | 17 | 0 |
| D | 0 | 17 | 0 |
| Mode SS | |||
|---|---|---|---|
| Quadrant | BADHDUFLAG | Total packets | Discarded packets |
| A | 0 | 114 | 0 |
| B | 0 | 114 | 0 |
| C | 0 | 114 | 0 |
| D | 0 | 114 | 0 |
| Quadrant | Total seconds | Saturated seconds | Saturation percentage |
|---|---|---|---|
| A | 5631 | 3 | 0.053277% |
| B | 5631 | 1 | 0.017759% |
| C | 5631 | 3 | 0.053277% |
| D | 5631 | 52 | 0.923459% |
Noise dominated data is calculated using 1-second bins in cleaned event files. If a bin has >2000 counts, and if more than 50% of those come from <1% of pixels, then it is considered to be noise-dominated and hence unusable.
| Quadrant | # 1 sec bins | Bins with >0 counts | Bins with >2000 counts | High rate bins dominated by noise | Noise dominated (total time) | Noise dominated (detector-on time) | Marked lightcurve |
|---|---|---|---|---|---|---|---|
| A | 7336 | 5632 | 98 | 98 | 1.34% | 1.74% | 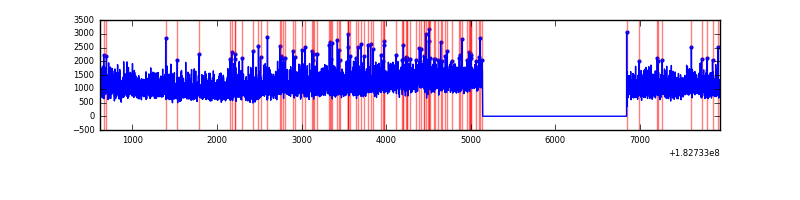 |
| B | 7336 | 5632 | 83 | 83 | 1.13% | 1.47% | 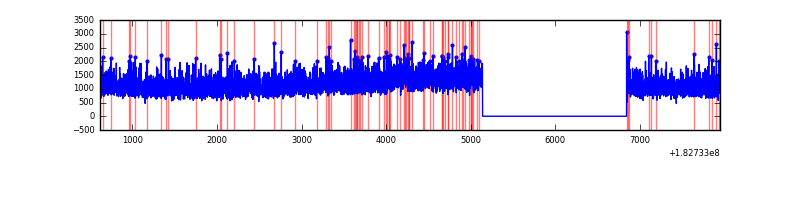 |
| C | 7336 | 5632 | 43 | 43 | 0.59% | 0.76% | 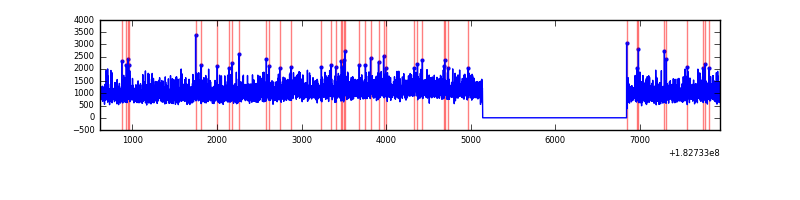 |
| D | 7336 | 5632 | 164 | 164 | 2.24% | 2.91% | 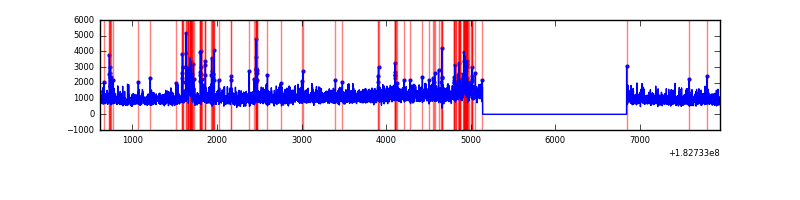 |
Top three noisy pixels from each quadrant. If the there are fewer than three noisy pixels in the level2.evt file, extra rows are filled as -1
| Pixel properties | Quadrant properties | ||||||
|---|---|---|---|---|---|---|---|
| Quadrant | DetID | PixID | Counts | Sigma | Mean | Median | Sigma |
| A | 15 | 127 | 42813 | 114.06 | 1641 | 1627 | 361.1 |
| A | 8 | 65 | 29728 | 77.82 | 1641 | 1627 | 361.1 |
| A | 15 | 66 | 20925 | 53.44 | 1641 | 1627 | 361.1 |
| B | 5 | 176 | 125165 | 317.2 | 1664 | 1675 | 389.3 |
| B | 5 | 46 | 21832 | 51.77 | 1664 | 1675 | 389.3 |
| B | 15 | 80 | 18268 | 42.62 | 1664 | 1675 | 389.3 |
| C | 3 | 159 | 22950 | 49.8 | 1535 | 1593 | 428.8 |
| C | 9 | 68 | 5146 | 8.29 | 1535 | 1593 | 428.8 |
| C | 1 | 192 | 4462 | 6.69 | 1535 | 1593 | 428.8 |
| D | 2 | 33 | 199976 | 429.1 | 1457 | 1515 | 462.5 |
| D | 13 | 7 | 166464 | 356.64 | 1457 | 1515 | 462.5 |
| D | 1 | 5 | 118152 | 252.18 | 1457 | 1515 | 462.5 |
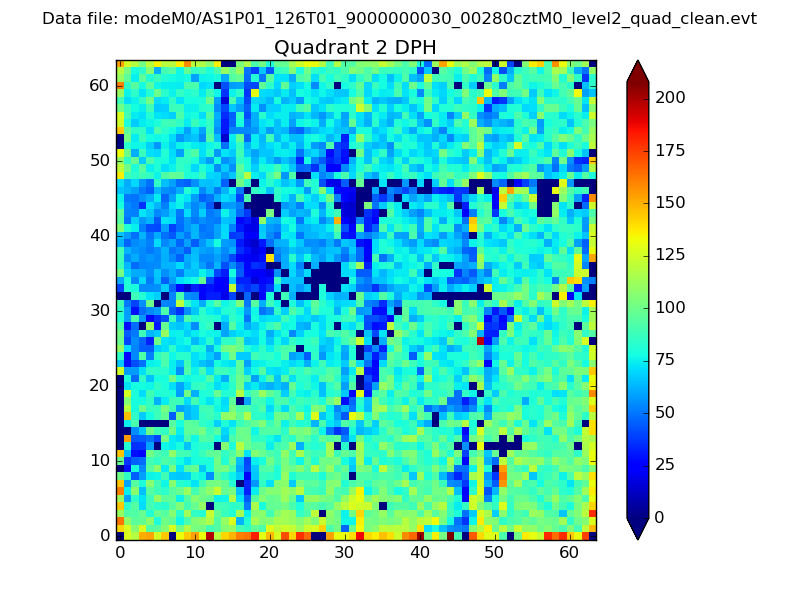
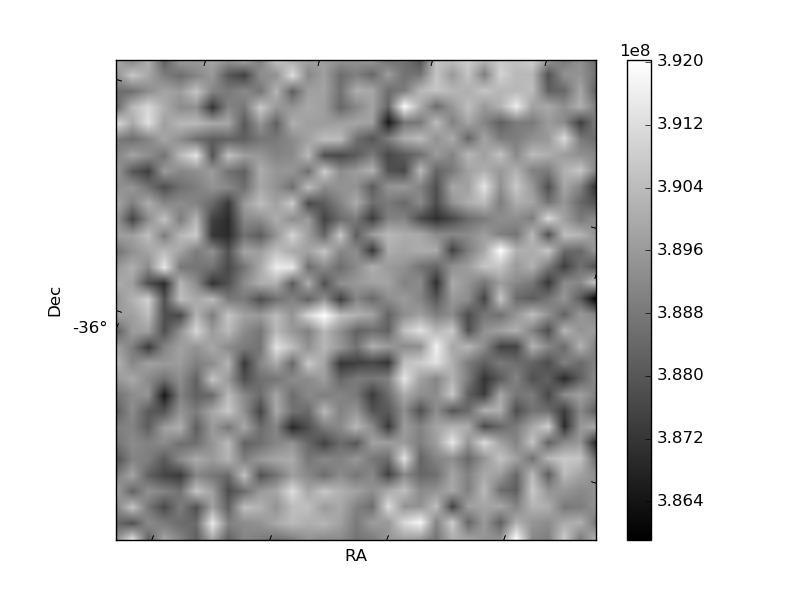
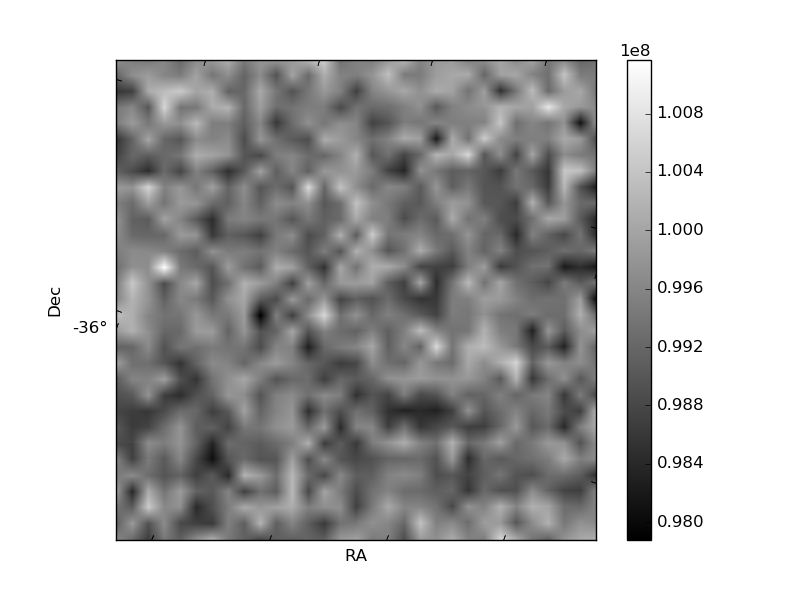
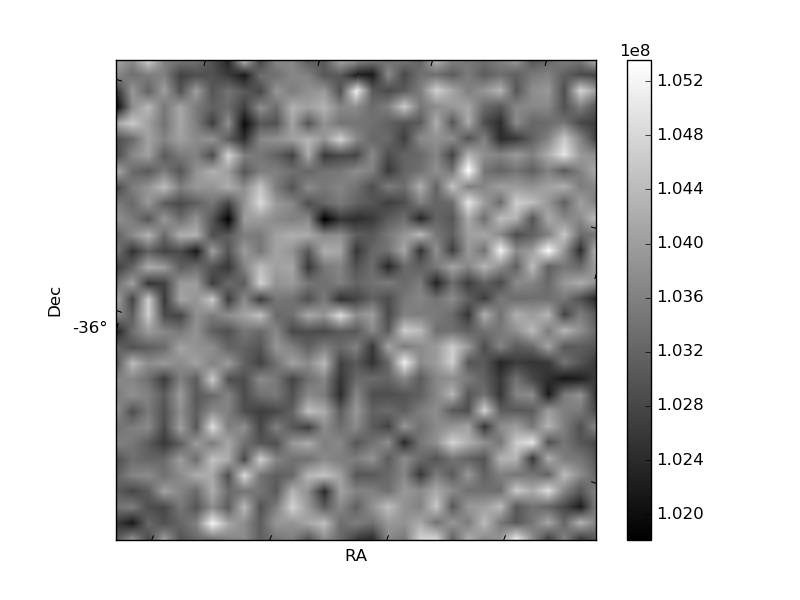
Histogram calculated using DETX and DETY for each event in the final _common_clean file
| Quadrant A | 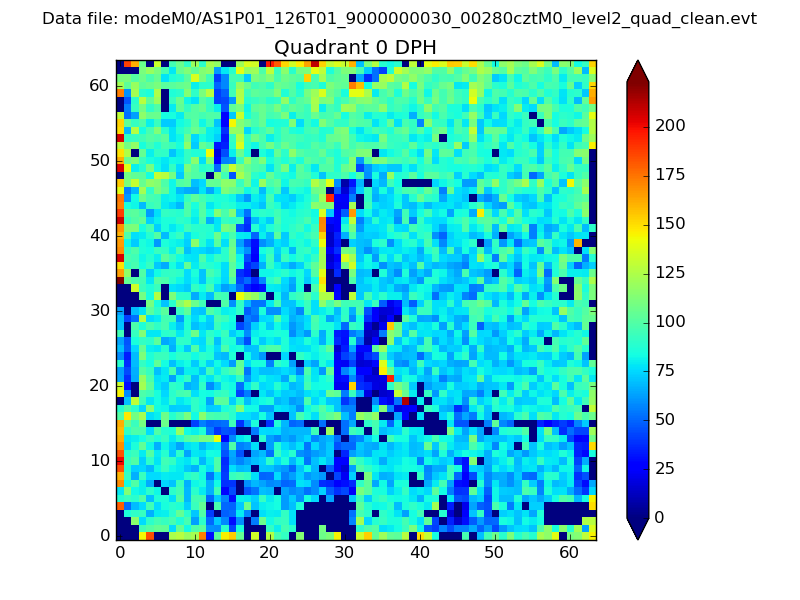 |
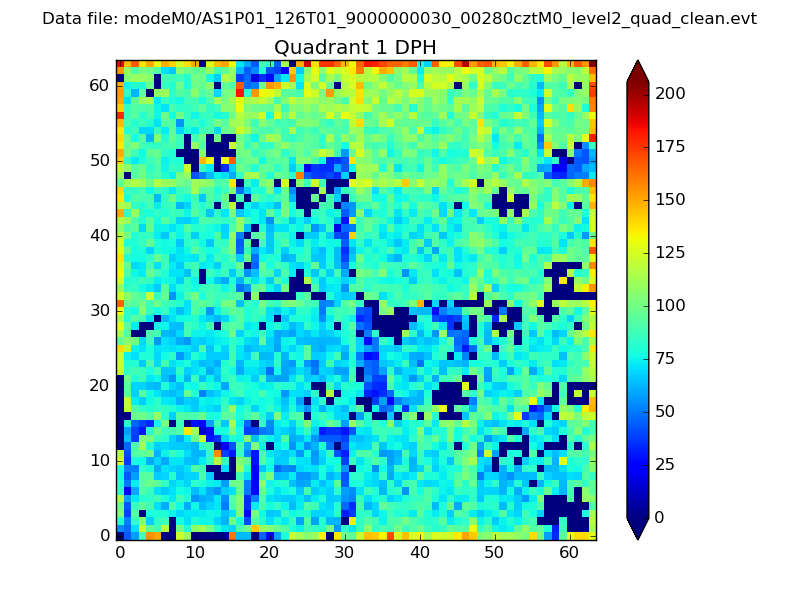 |
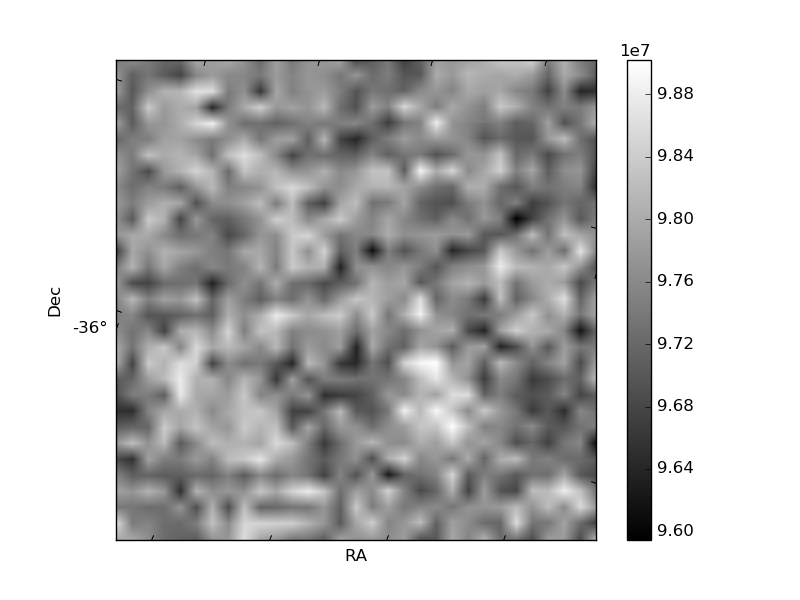
Quadrant B |
|---|---|---|---|
| Quadrant D | 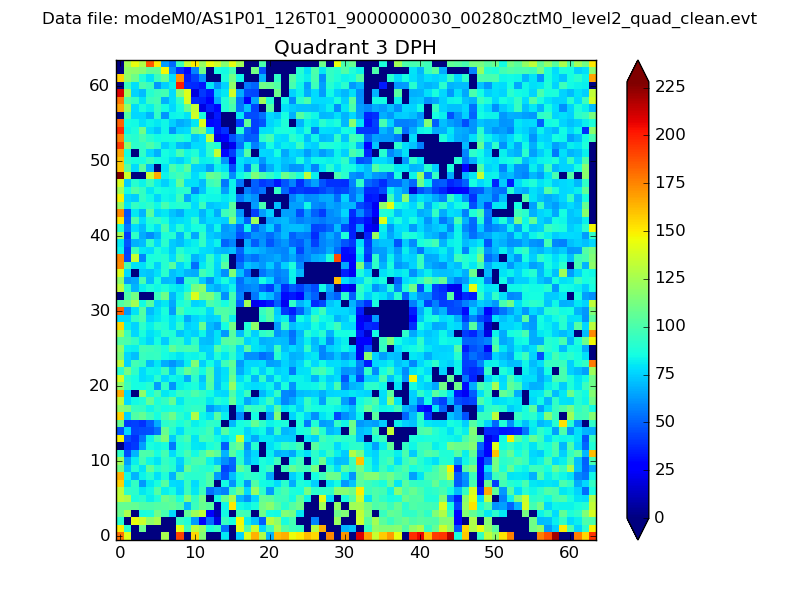 |
 |
Quadrant C |
| Plot type | Count rate plots | Images |
|---|---|---|
| Comparison with Poisson distribution Blue bars denote a histogram of data divided into 1 sec bins. Red curve is a Poisson curve with rate = median count rate of data. |
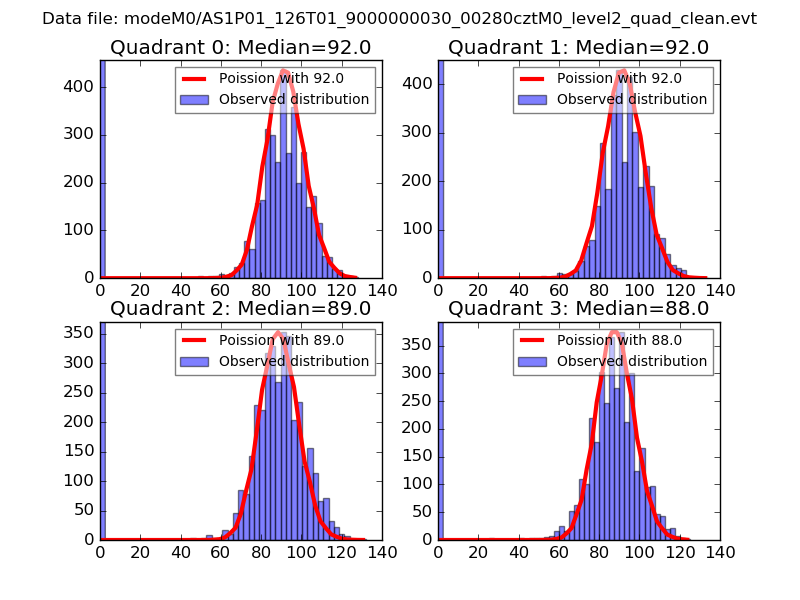 |
 |
| Quadrant-wise count rates Data is divided into 100 sec bins |
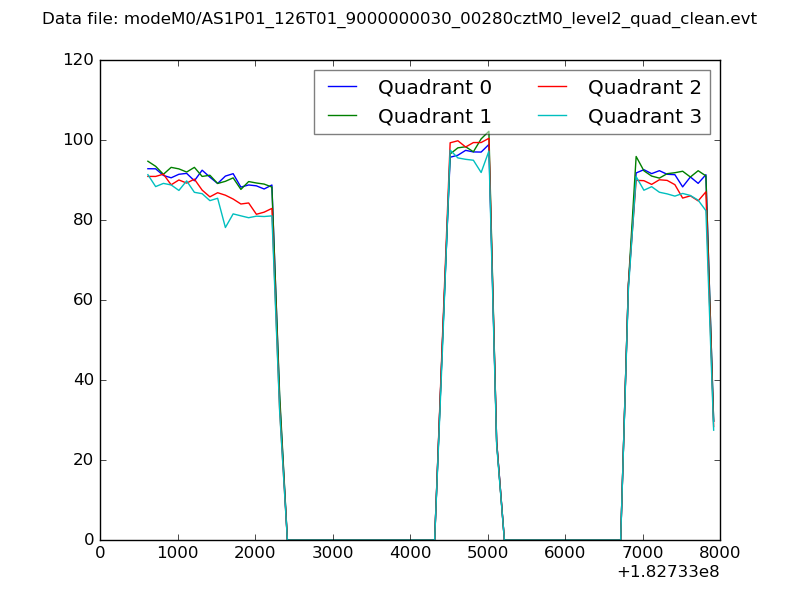 |
|
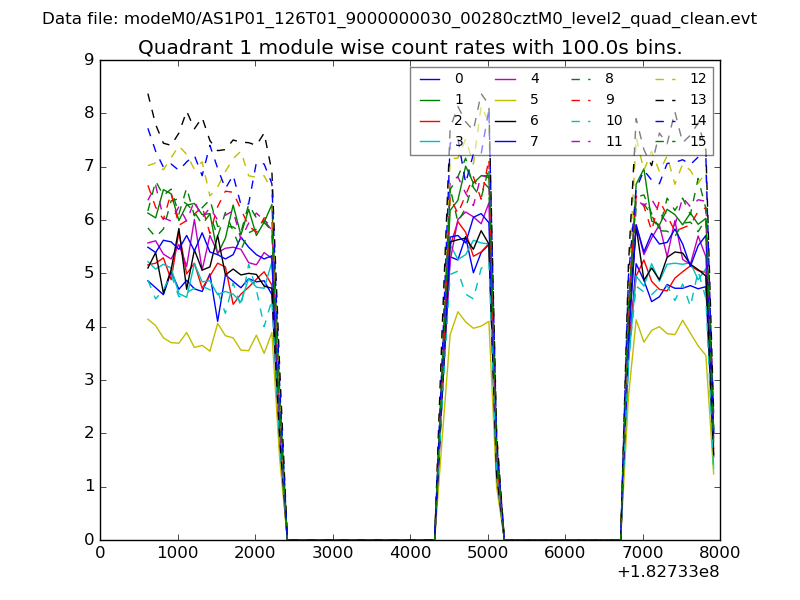
| Module-wise count rates for Quadrant A Data is divided into 100 sec bins |
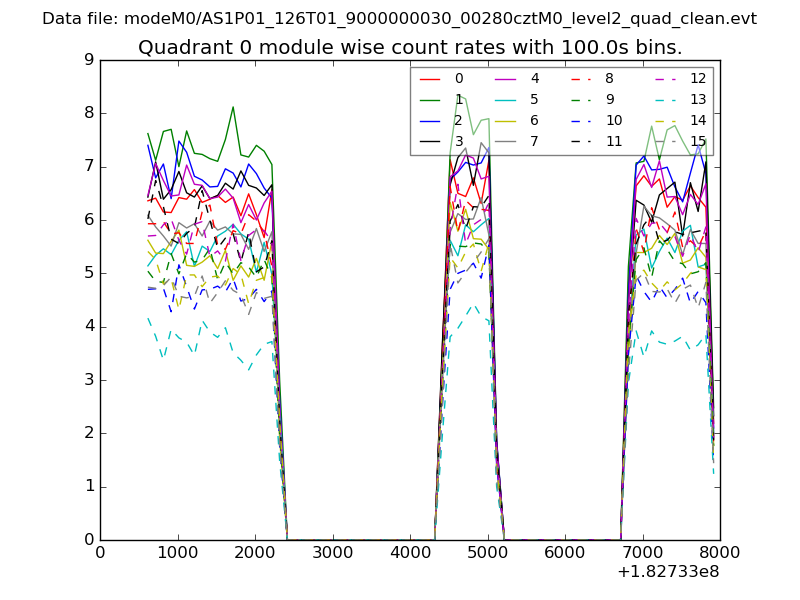 |
 |
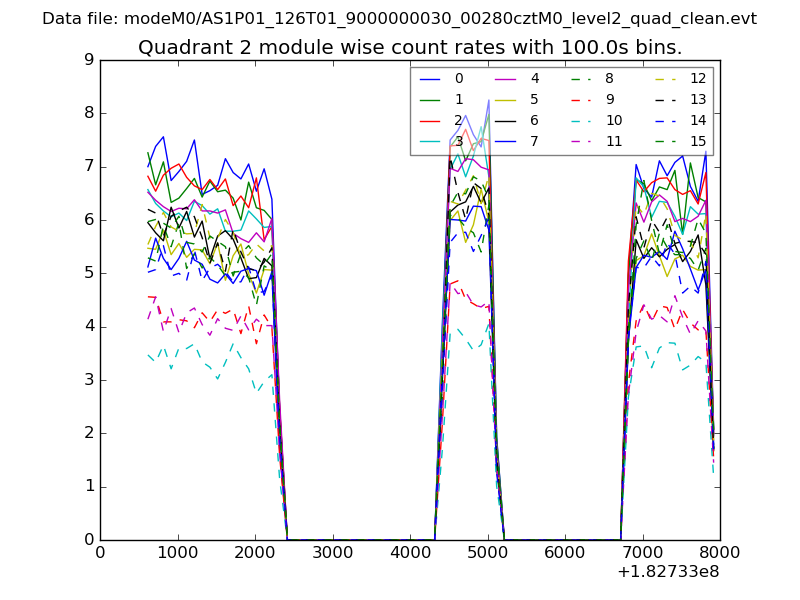
| Module-wise count rates for Quadrant B Data is divided into 100 sec bins |
 |
 |
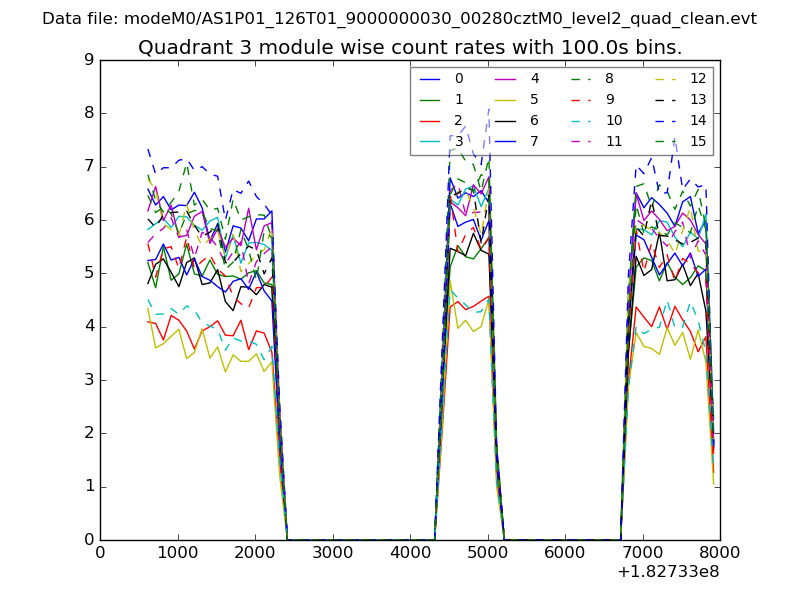
| Module-wise count rates for Quadrant C Data is divided into 100 sec bins |
 |
 |
| Module-wise count rates for Quadrant D Data is divided into 100 sec bins |
 |
 |
| Parameter | Plot |
|---|---|
| CZT HV Monitor | 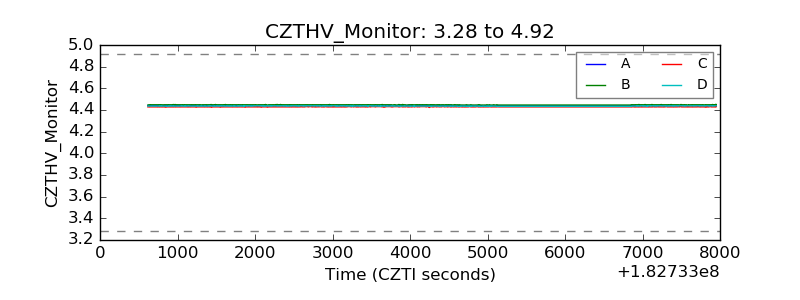 |
| D_VDD | 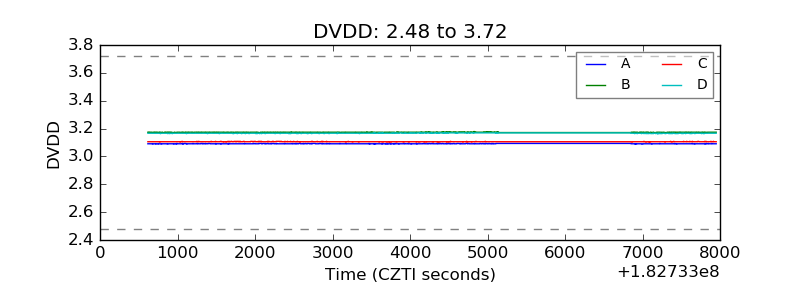 |
| Temperature 1 | 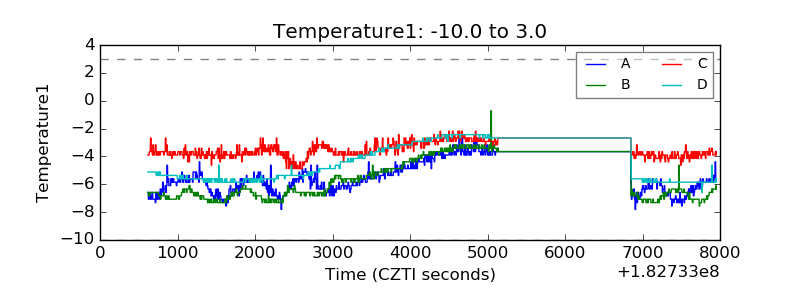 |
| Veto HV Monitor | 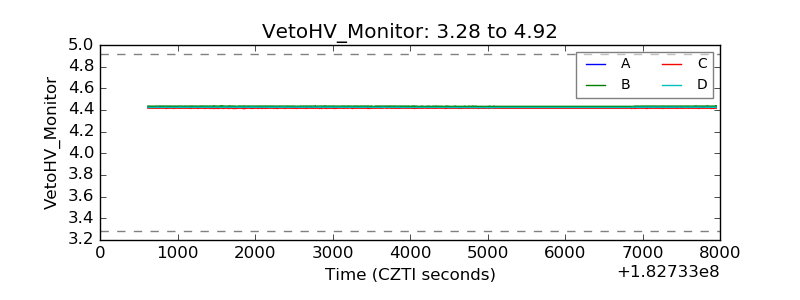 |
| Veto LLD | 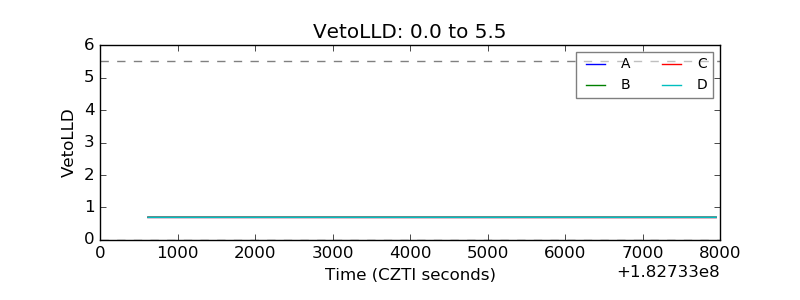 |
| Alpha Counter | 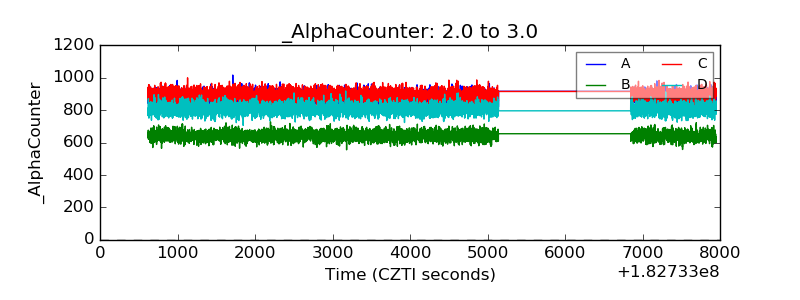 |
| _CPM_Rate | 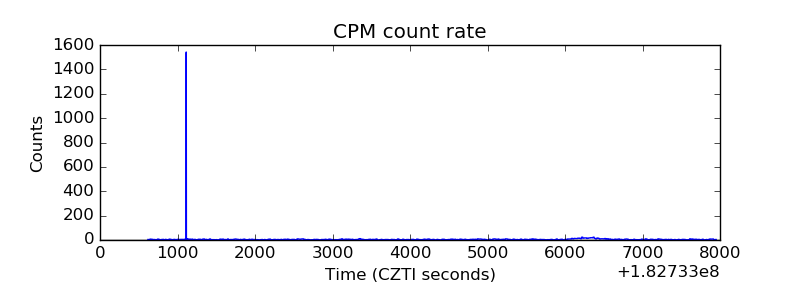 |
| CZT Counter | 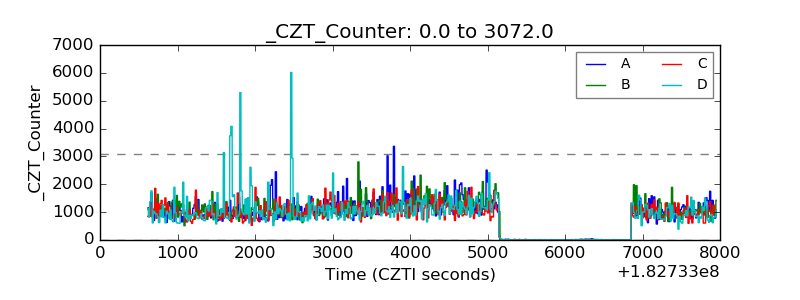 |
| +2.5 Volts monitor |  |
| +5 Volts monitor | 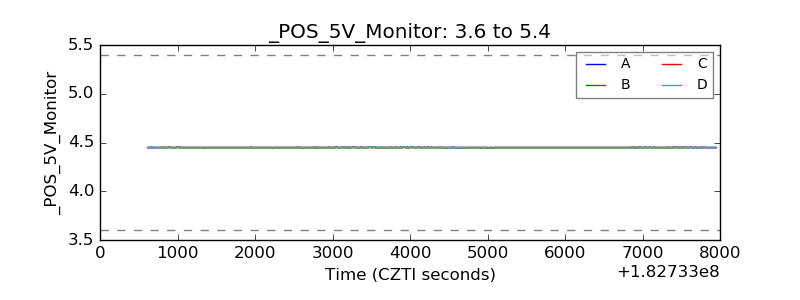 |
| _ROLL_ROT | 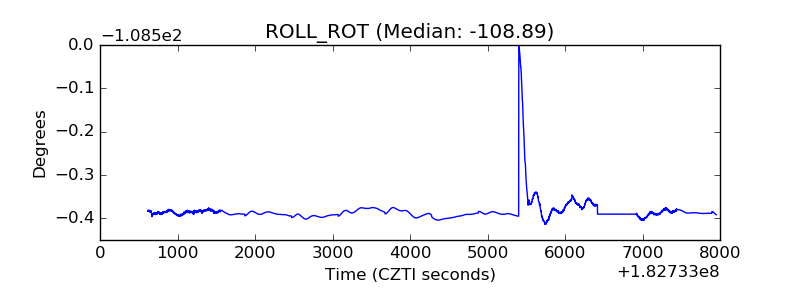 |
| _Roll_DEC | 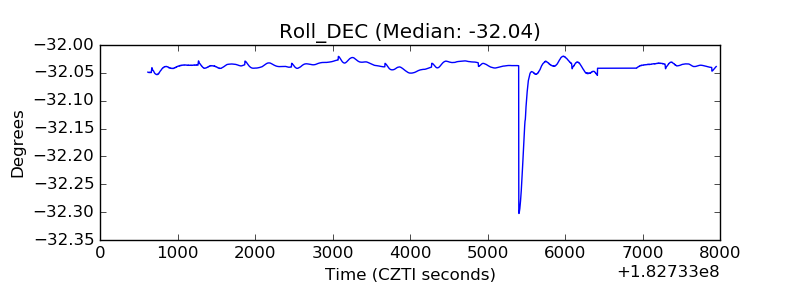 |
| _Roll_RA | 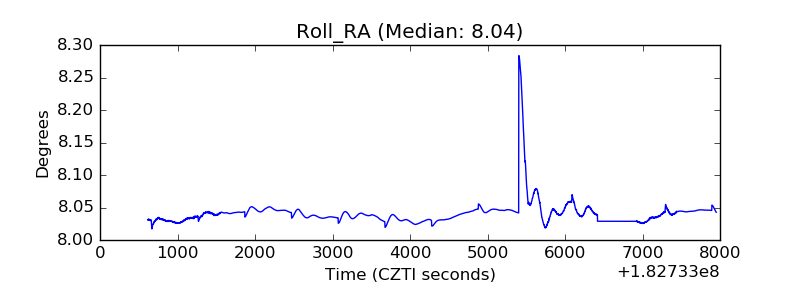 |
| Veto Counter | 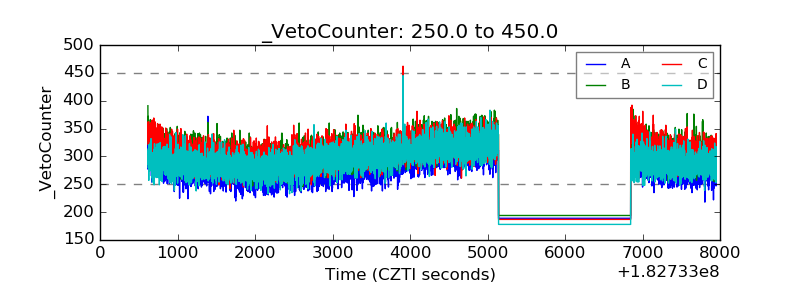 |