| Param | Original file | Final file |
|---|---|---|
| Filename | modeM0/AS1P01_126T01_9000000030_00281cztM0_level2.evt | modeM0/AS1P01_126T01_9000000030_00281cztM0_level2_quad_clean.evt |
| Size (bytes) | 874,532,160 | 53,311,680 |
| Size | 834.0 MB | 50.8 MB |
| Events in quadrant A | 6,960,711 | 306,527 |
| Events in quadrant B | 6,771,555 | 311,760 |
| Events in quadrant C | 6,255,932 | 302,010 |
| Events in quadrant D | 6,119,025 | 295,942 |
| Mode M0 | |||
|---|---|---|---|
| Quadrant | BADHDUFLAG | Total packets | Discarded packets |
| A | 0 | 24703 | 2 |
| B | 0 | 24120 | 1 |
| C | 0 | 22632 | 1 |
| D | 0 | 22210 | 1 |
| Mode M9 | |||
|---|---|---|---|
| Quadrant | BADHDUFLAG | Total packets | Discarded packets |
| A | 0 | 17 | 0 |
| B | 0 | 17 | 0 |
| C | 0 | 17 | 0 |
| D | 0 | 17 | 0 |
| Mode SS | |||
|---|---|---|---|
| Quadrant | BADHDUFLAG | Total packets | Discarded packets |
| A | 0 | 116 | 0 |
| B | 0 | 116 | 0 |
| C | 0 | 116 | 0 |
| D | 0 | 116 | 0 |
| Quadrant | Total seconds | Saturated seconds | Saturation percentage |
|---|---|---|---|
| A | 5683 | 7 | 0.123174% |
| B | 5683 | 2 | 0.035193% |
| C | 5683 | 3 | 0.052789% |
| D | 5683 | 4 | 0.070385% |
Noise dominated data is calculated using 1-second bins in cleaned event files. If a bin has >2000 counts, and if more than 50% of those come from <1% of pixels, then it is considered to be noise-dominated and hence unusable.
| Quadrant | # 1 sec bins | Bins with >0 counts | Bins with >2000 counts | High rate bins dominated by noise | Noise dominated (total time) | Noise dominated (detector-on time) | Marked lightcurve |
|---|---|---|---|---|---|---|---|
| A | 7388 | 5684 | 159 | 159 | 2.15% | 2.80% | 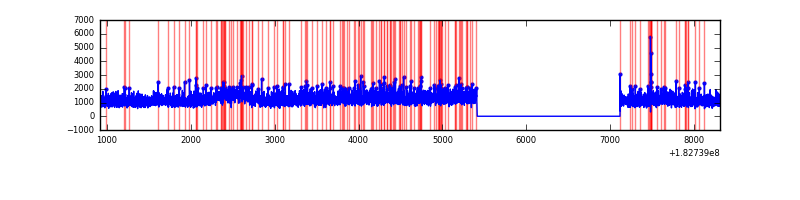 |
| B | 7388 | 5684 | 93 | 93 | 1.26% | 1.64% | 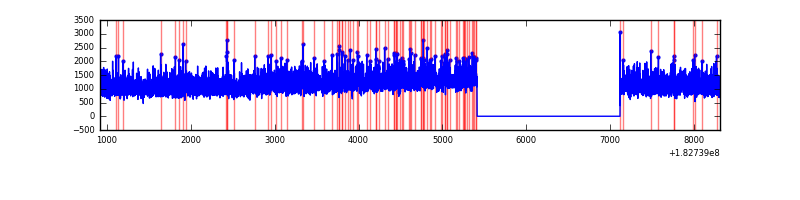 |
| C | 7388 | 5684 | 38 | 38 | 0.51% | 0.67% | 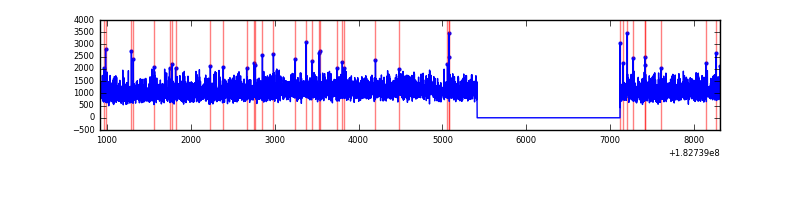 |
| D | 7388 | 5684 | 40 | 40 | 0.54% | 0.70% | 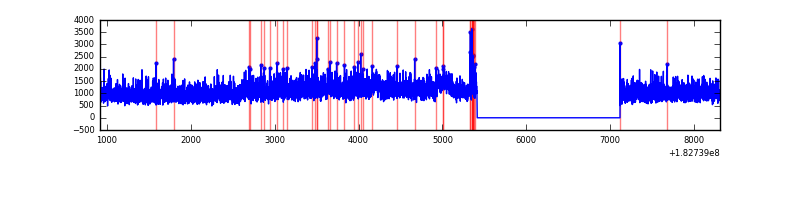 |
Top three noisy pixels from each quadrant. If the there are fewer than three noisy pixels in the level2.evt file, extra rows are filled as -1
| Pixel properties | Quadrant properties | ||||||
|---|---|---|---|---|---|---|---|
| Quadrant | DetID | PixID | Counts | Sigma | Mean | Median | Sigma |
| A | 15 | 127 | 283599 | 752.55 | 1699 | 1681 | 374.6 |
| A | 15 | 66 | 38833 | 99.17 | 1699 | 1681 | 374.6 |
| A | 8 | 65 | 38149 | 97.35 | 1699 | 1681 | 374.6 |
| B | 5 | 176 | 158319 | 390.16 | 1712 | 1725 | 401.4 |
| B | 8 | 54 | 20163 | 45.94 | 1712 | 1725 | 401.4 |
| B | 5 | 46 | 14404 | 31.59 | 1712 | 1725 | 401.4 |
| C | 3 | 159 | 20913 | 43.13 | 1586 | 1643 | 446.7 |
| C | 9 | 68 | 4527 | 6.46 | 1586 | 1643 | 446.7 |
| C | 9 | 148 | 4104 | 5.51 | 1586 | 1643 | 446.7 |
| D | 10 | 171 | 118118 | 240.78 | 1515 | 1576 | 484.0 |
| D | 13 | 216 | 85116 | 172.6 | 1515 | 1576 | 484.0 |
| D | 1 | 5 | 61741 | 124.3 | 1515 | 1576 | 484.0 |
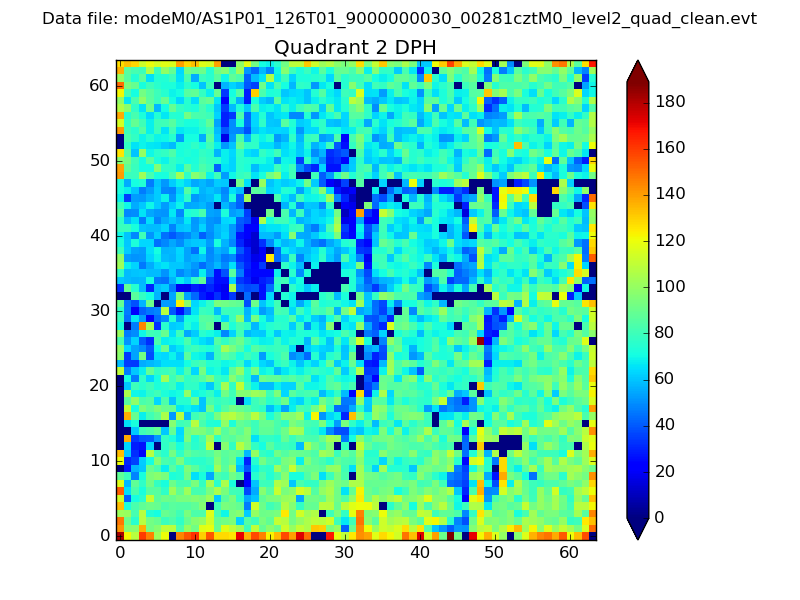
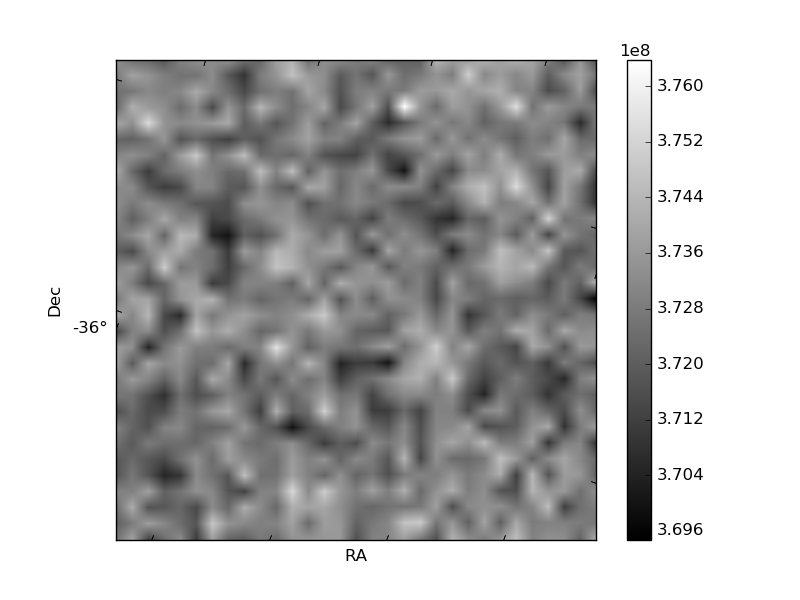
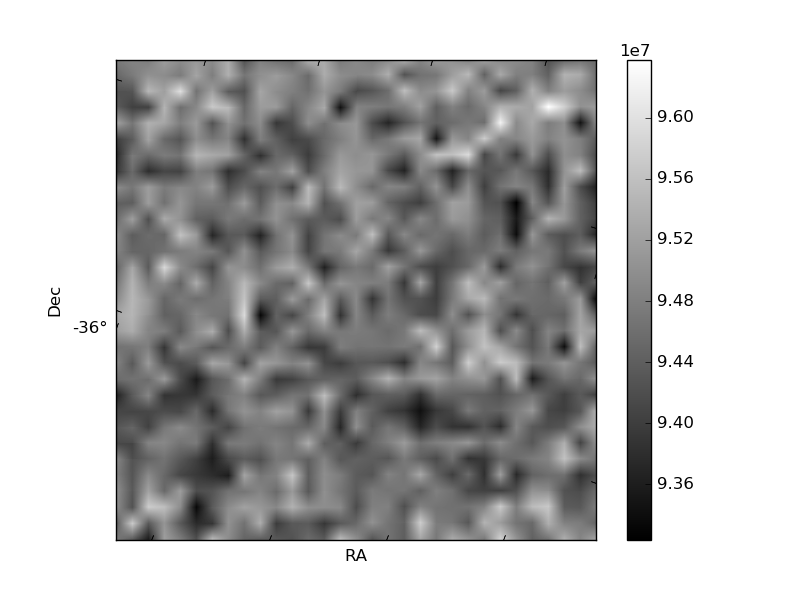
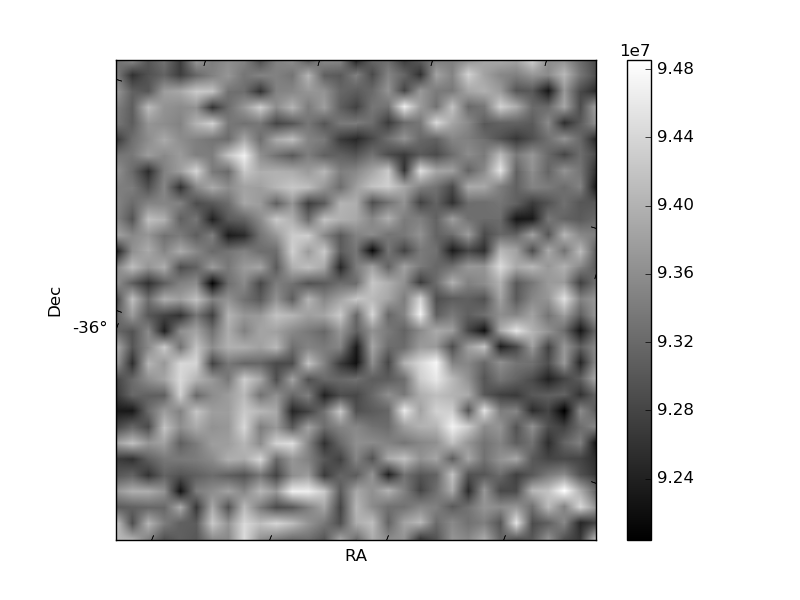
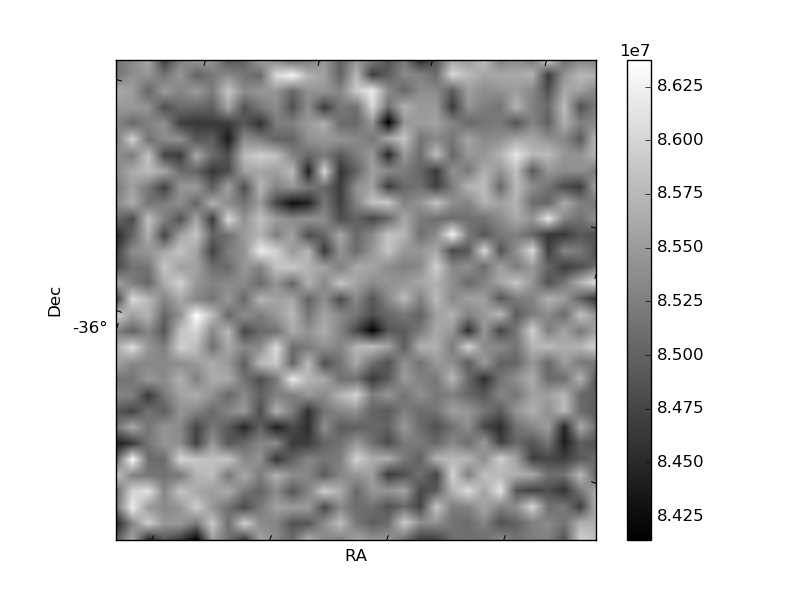
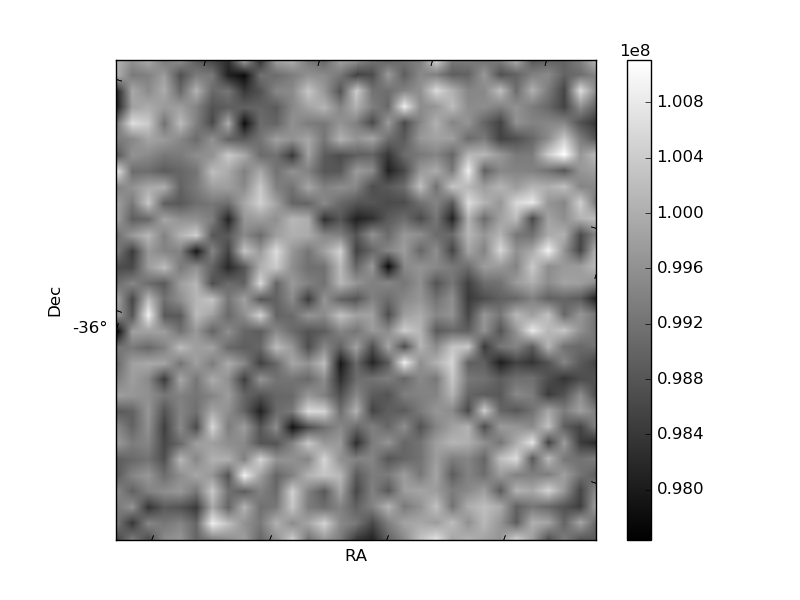
Histogram calculated using DETX and DETY for each event in the final _common_clean file
| Quadrant A | 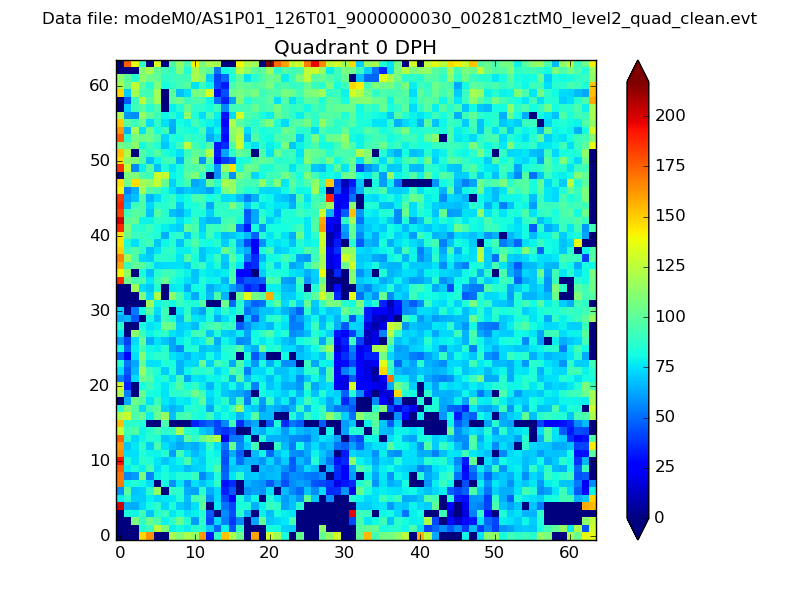 |
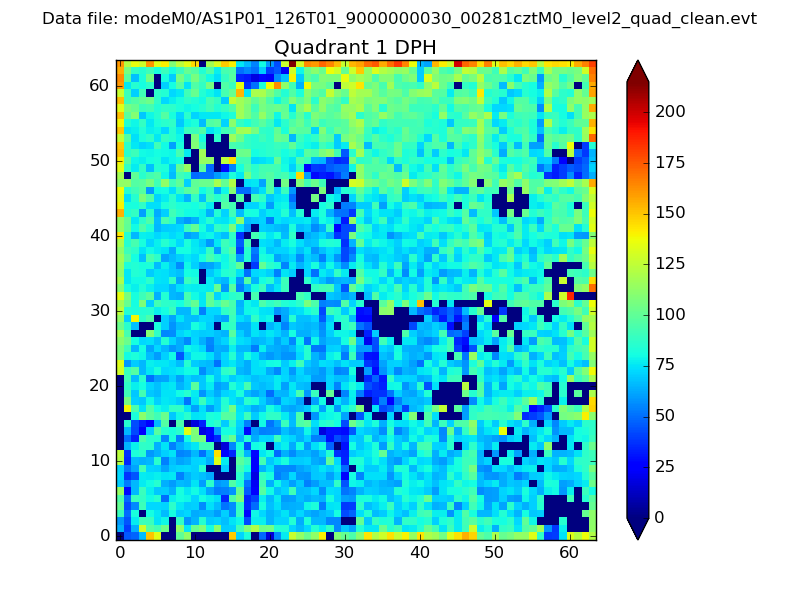 |
Quadrant B |
|---|---|---|---|
| Quadrant D | 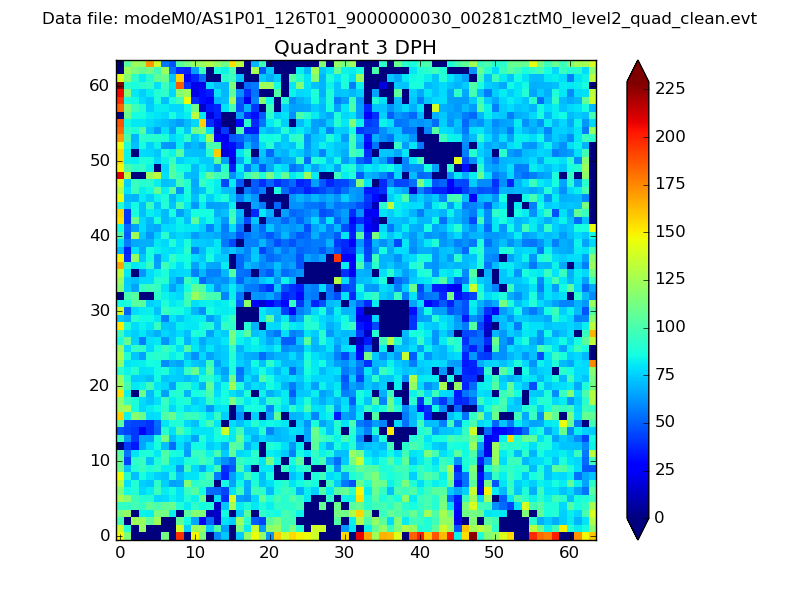 |
 |
Quadrant C |
| Plot type | Count rate plots | Images |
|---|---|---|
| Comparison with Poisson distribution Blue bars denote a histogram of data divided into 1 sec bins. Red curve is a Poisson curve with rate = median count rate of data. |
 |
 |
| Quadrant-wise count rates Data is divided into 100 sec bins |
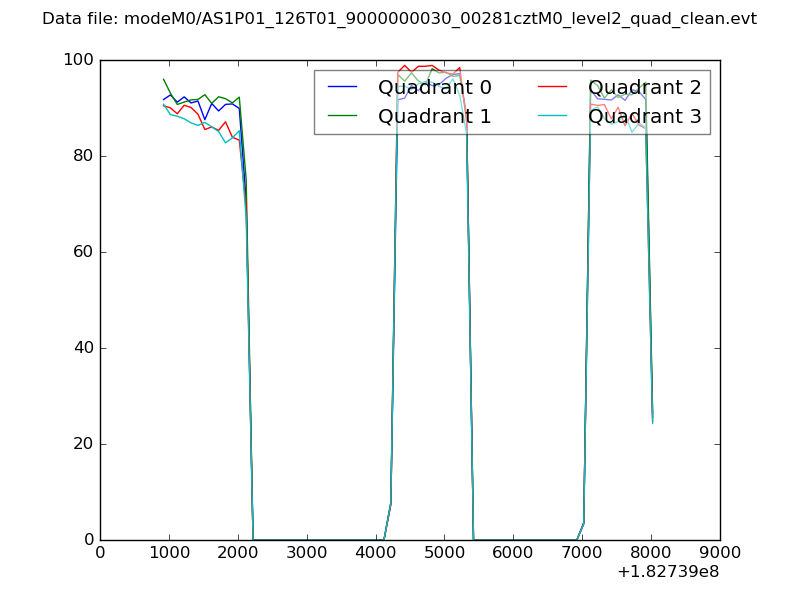 |
|
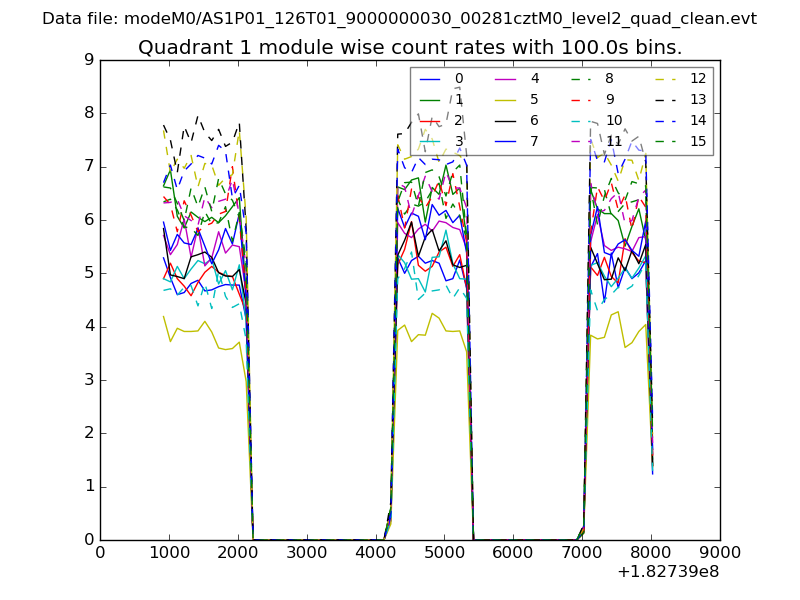
| Module-wise count rates for Quadrant A Data is divided into 100 sec bins |
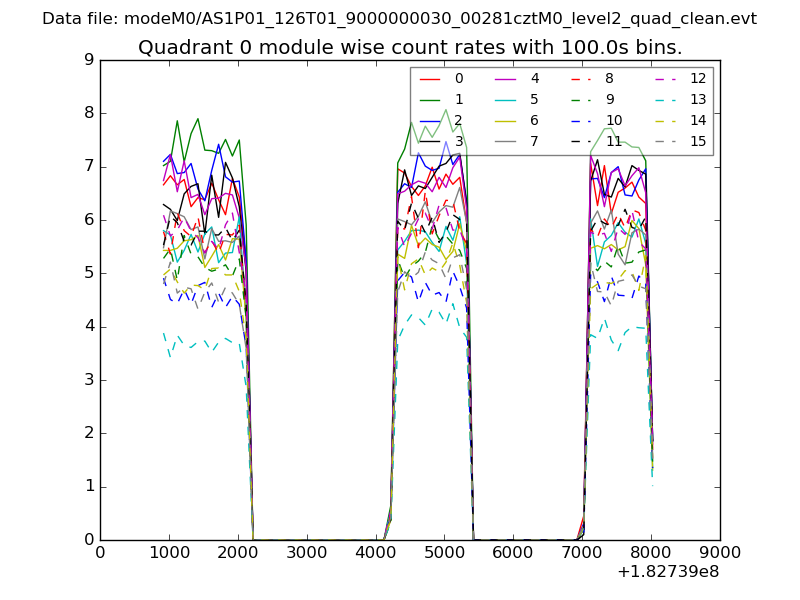 |
 |
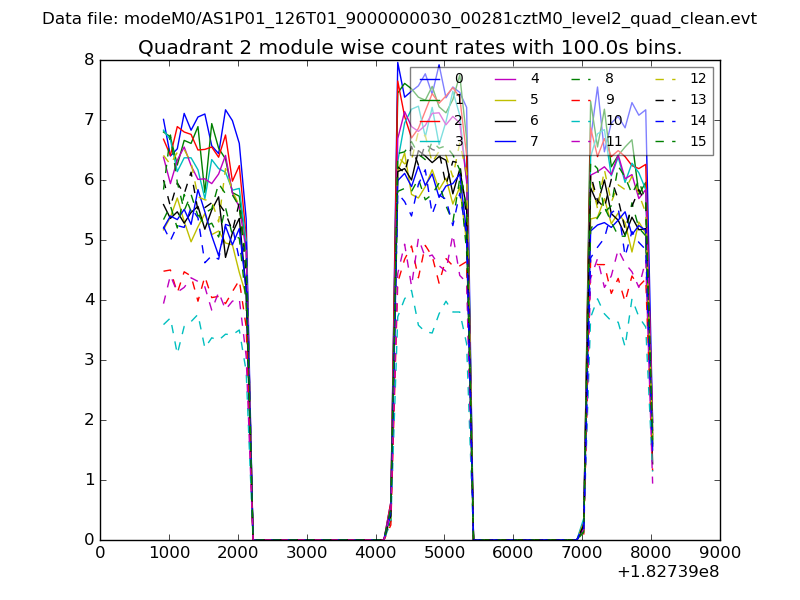
| Module-wise count rates for Quadrant B Data is divided into 100 sec bins |
 |
 |
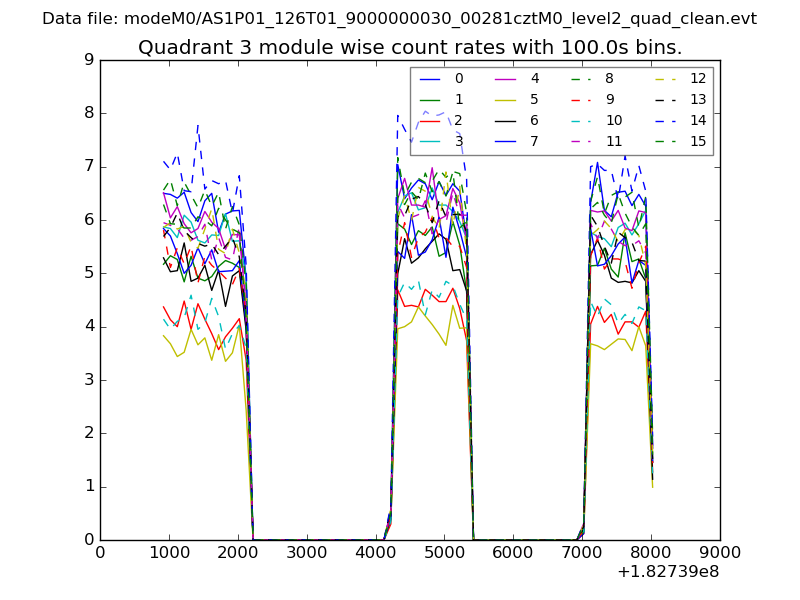
| Module-wise count rates for Quadrant C Data is divided into 100 sec bins |
 |
 |
| Module-wise count rates for Quadrant D Data is divided into 100 sec bins |
 |
 |
| Parameter | Plot |
|---|---|
| CZT HV Monitor |  |
| D_VDD | 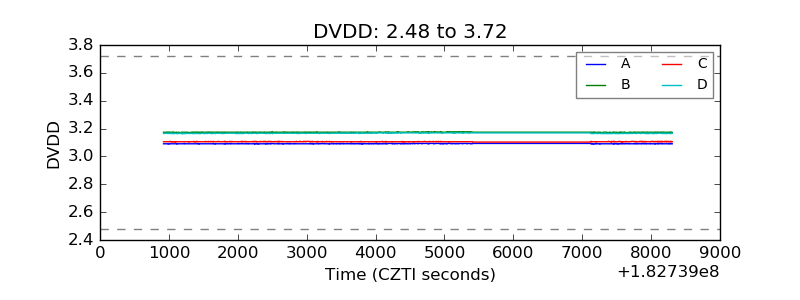 |
| Temperature 1 | 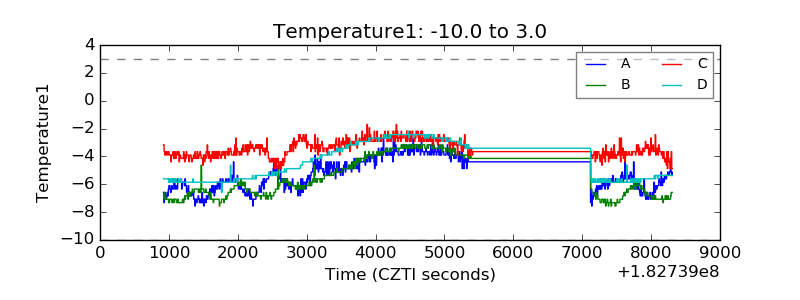 |
| Veto HV Monitor | 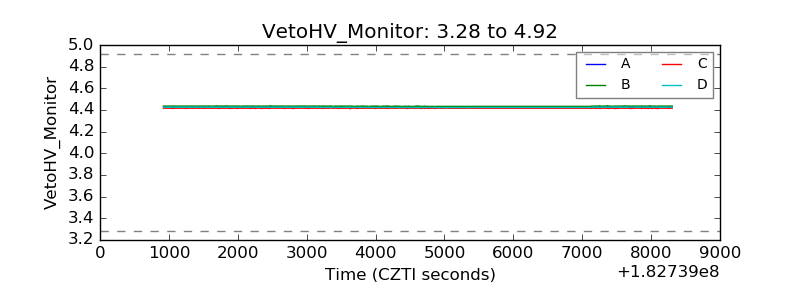 |
| Veto LLD | 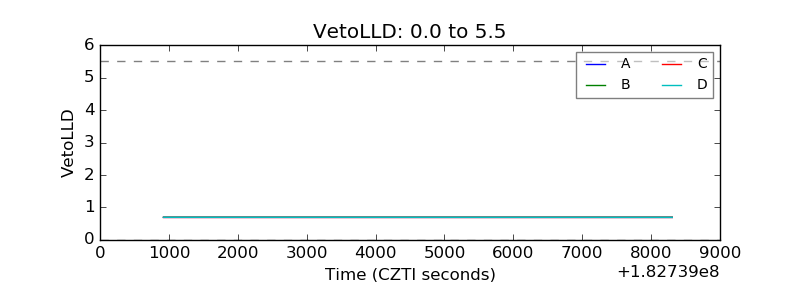 |
| Alpha Counter | 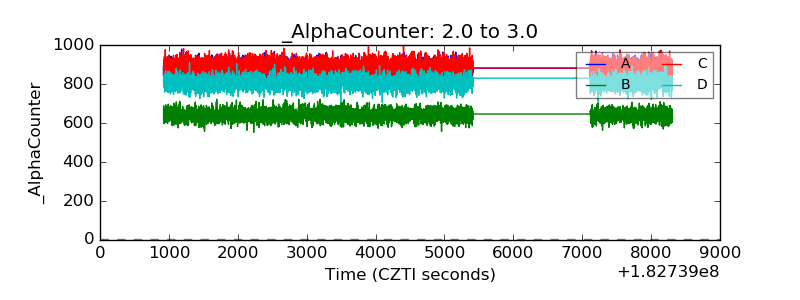 |
| _CPM_Rate | 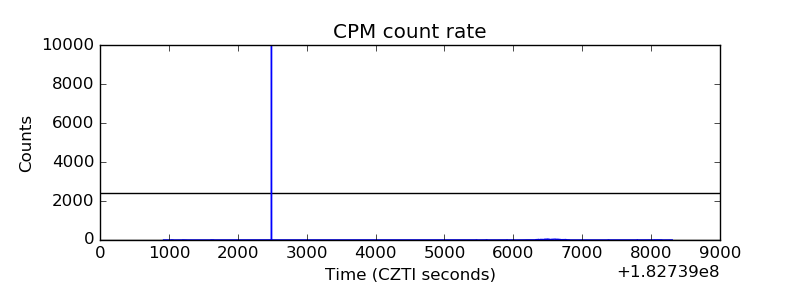 |
| CZT Counter | 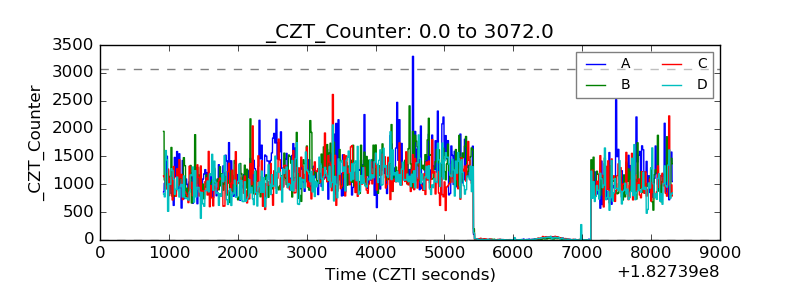 |
| +2.5 Volts monitor |  |
| +5 Volts monitor |  |
| _ROLL_ROT | 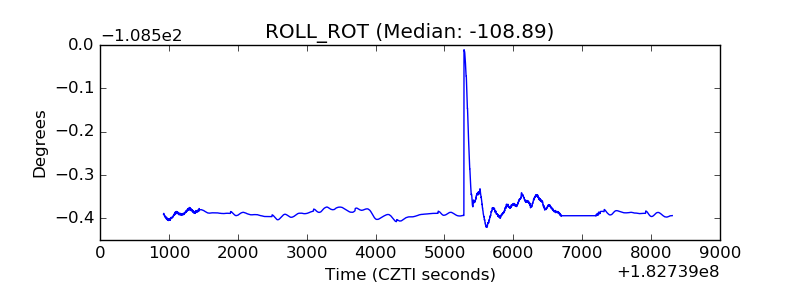 |
| _Roll_DEC | 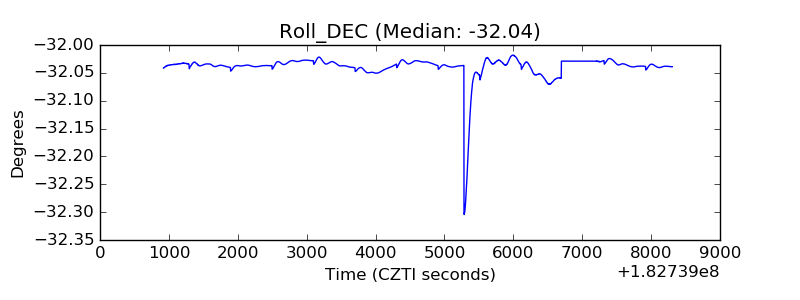 |
| _Roll_RA | 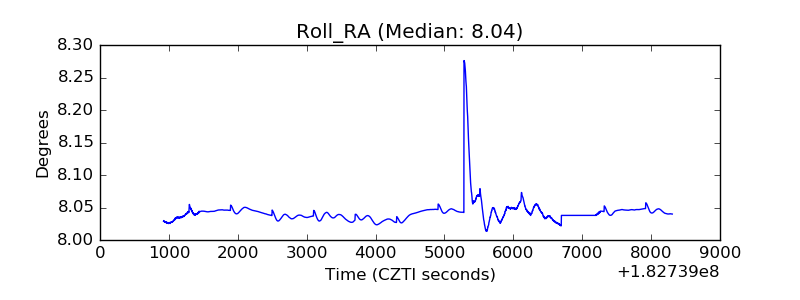 |
| Veto Counter | 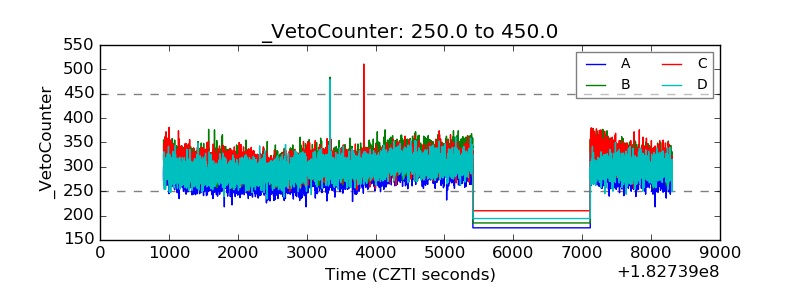 |