| Param | Original file | Final file |
|---|---|---|
| Filename | modeM0/AS1P01_126T01_9000000030_00282cztM0_level2.evt | modeM0/AS1P01_126T01_9000000030_00282cztM0_level2_quad_clean.evt |
| Size (bytes) | 612,869,760 | 30,222,720 |
| Size | 584.5 MB | 28.8 MB |
| Events in quadrant A | 4,816,861 | 160,630 |
| Events in quadrant B | 4,566,609 | 163,500 |
| Events in quadrant C | 4,297,050 | 161,044 |
| Events in quadrant D | 4,622,938 | 157,090 |
| Mode M0 | |||
|---|---|---|---|
| Quadrant | BADHDUFLAG | Total packets | Discarded packets |
| A | 0 | 17019 | 0 |
| B | 0 | 16303 | 0 |
| C | 0 | 15537 | 0 |
| D | 0 | 16510 | 0 |
| Mode SS | |||
|---|---|---|---|
| Quadrant | BADHDUFLAG | Total packets | Discarded packets |
| A | 0 | 76 | 0 |
| B | 0 | 76 | 0 |
| C | 0 | 76 | 0 |
| D | 0 | 76 | 0 |
| Quadrant | Total seconds | Saturated seconds | Saturation percentage |
|---|---|---|---|
| A | 3857 | 25 | 0.648172% |
| B | 3857 | 0 | 0.000000% |
| C | 3857 | 0 | 0.000000% |
| D | 3857 | 121 | 3.137153% |
Noise dominated data is calculated using 1-second bins in cleaned event files. If a bin has >2000 counts, and if more than 50% of those come from <1% of pixels, then it is considered to be noise-dominated and hence unusable.
| Quadrant | # 1 sec bins | Bins with >0 counts | Bins with >2000 counts | High rate bins dominated by noise | Noise dominated (total time) | Noise dominated (detector-on time) | Marked lightcurve |
|---|---|---|---|---|---|---|---|
| A | 3857 | 3857 | 158 | 158 | 4.10% | 4.10% | 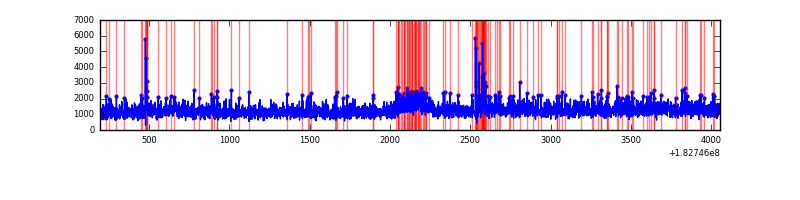 |
| B | 3857 | 3857 | 49 | 49 | 1.27% | 1.27% | 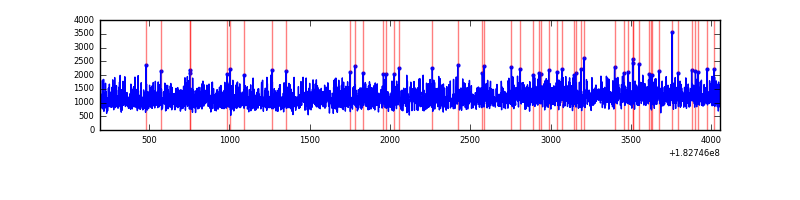 |
| C | 3857 | 3857 | 23 | 23 | 0.60% | 0.60% | 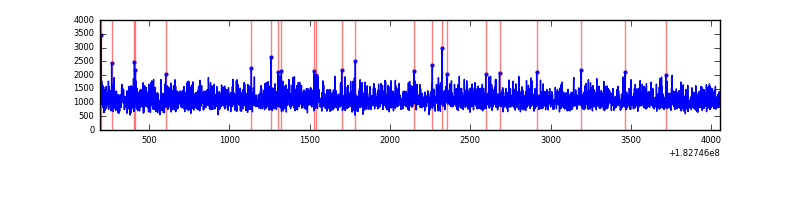 |
| D | 3857 | 3857 | 190 | 190 | 4.93% | 4.93% | 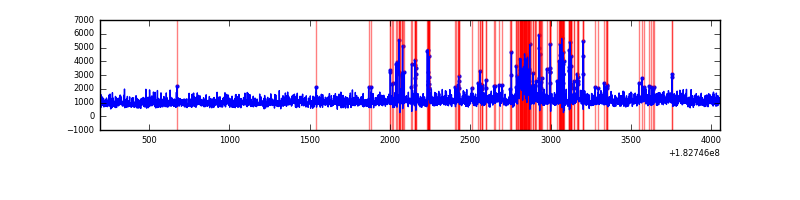 |
Top three noisy pixels from each quadrant. If the there are fewer than three noisy pixels in the level2.evt file, extra rows are filled as -1
| Pixel properties | Quadrant properties | ||||||
|---|---|---|---|---|---|---|---|
| Quadrant | DetID | PixID | Counts | Sigma | Mean | Median | Sigma |
| A | 15 | 66 | 181867 | 687.22 | 1179 | 1167 | 262.9 |
| A | 8 | 65 | 46312 | 171.69 | 1179 | 1167 | 262.9 |
| A | 12 | 150 | 19645 | 70.27 | 1179 | 1167 | 262.9 |
| B | 0 | 151 | 32402 | 111.32 | 1178 | 1184 | 280.4 |
| B | 8 | 54 | 12642 | 40.86 | 1178 | 1184 | 280.4 |
| B | 15 | 80 | 11864 | 38.08 | 1178 | 1184 | 280.4 |
| C | 0 | 219 | 4707 | 11.66 | 1089 | 1131 | 306.6 |
| C | 14 | 48 | 4422 | 10.73 | 1089 | 1131 | 306.6 |
| C | 3 | 159 | 3958 | 9.22 | 1089 | 1131 | 306.6 |
| D | 1 | 5 | 146566 | 419.95 | 1093 | 1109 | 346.4 |
| D | 13 | 216 | 59761 | 169.33 | 1093 | 1109 | 346.4 |
| D | 13 | 117 | 22876 | 62.84 | 1093 | 1109 | 346.4 |
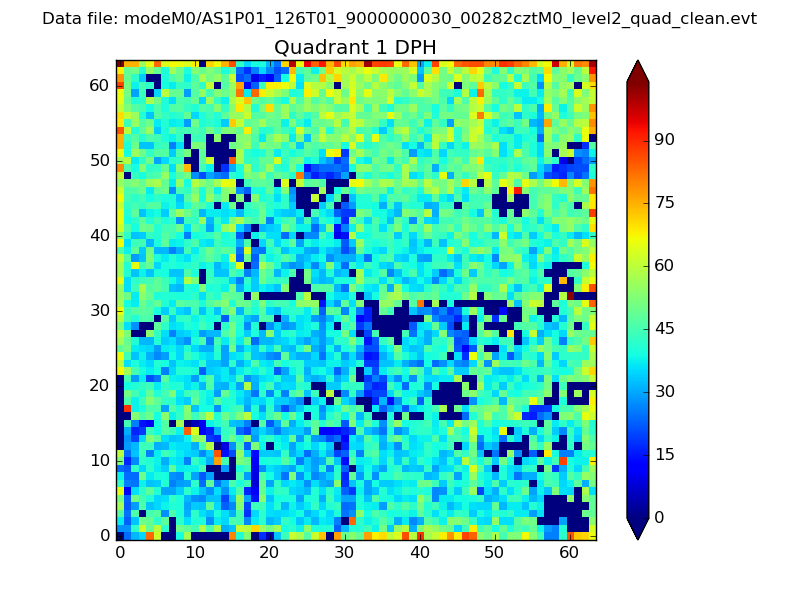
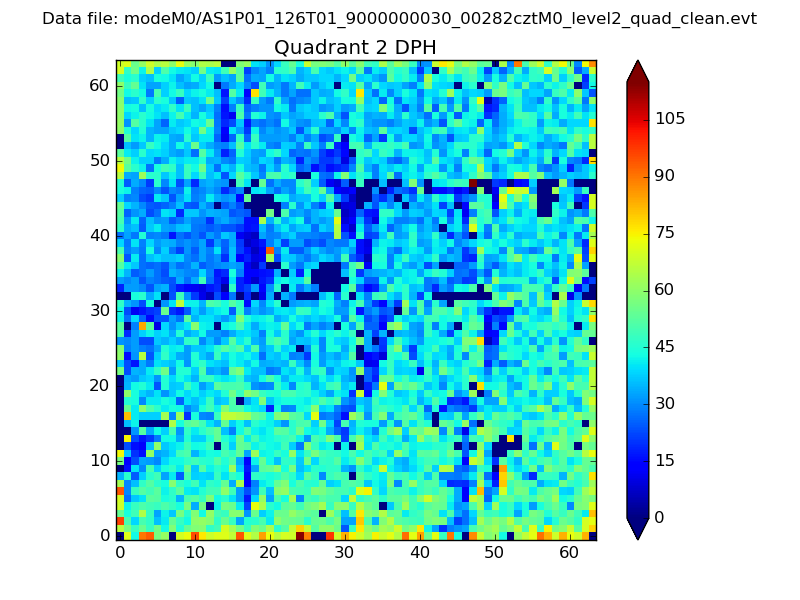
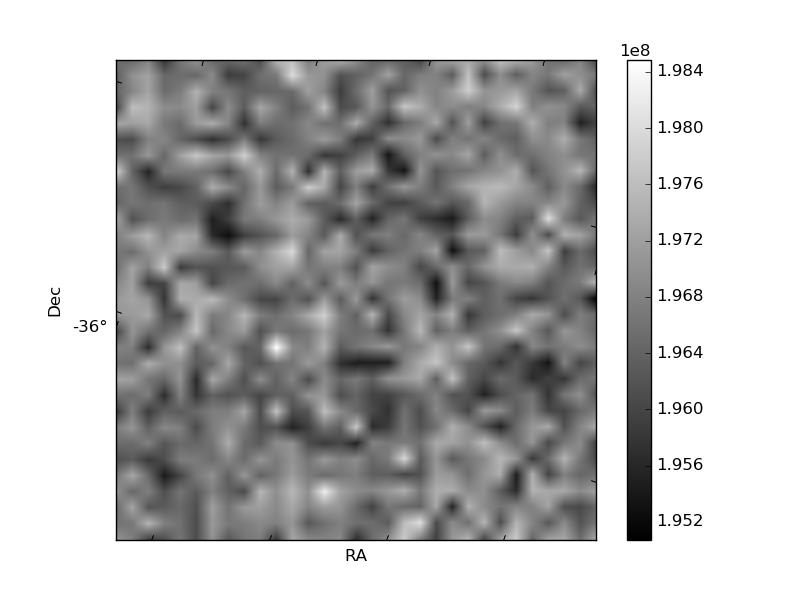
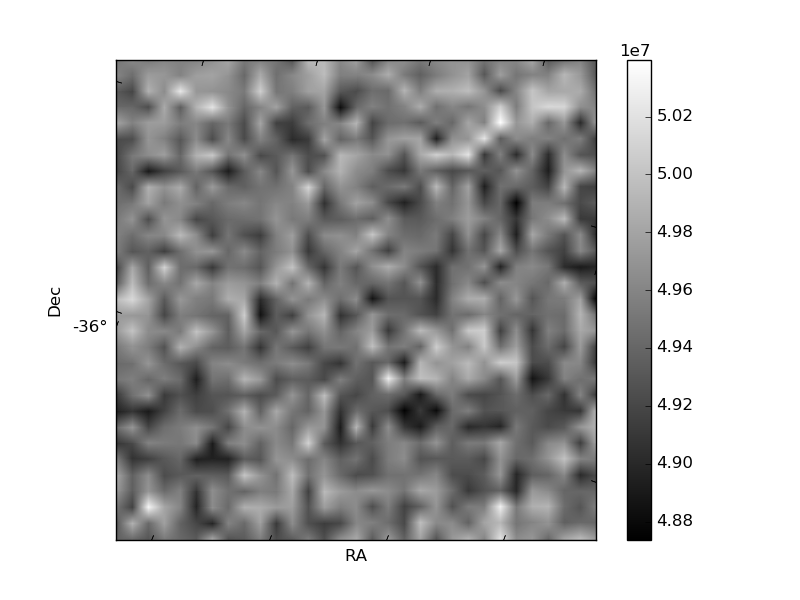
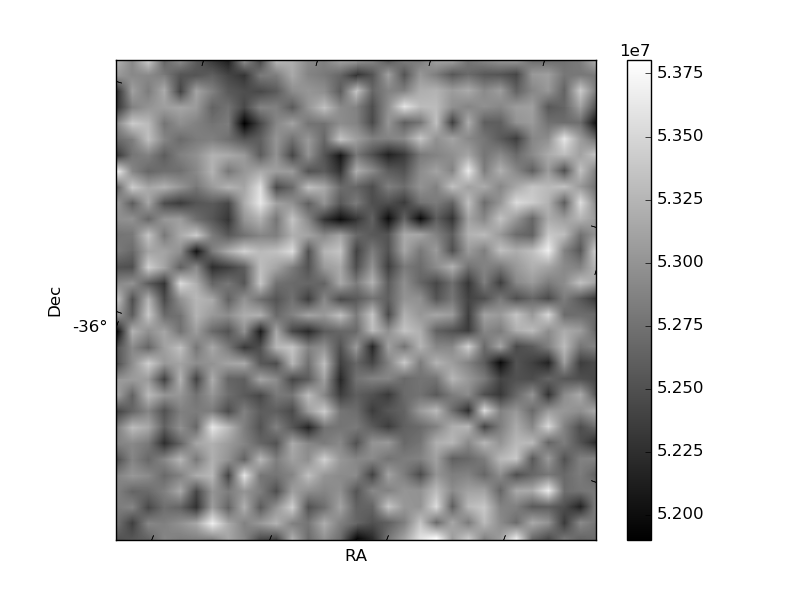
Histogram calculated using DETX and DETY for each event in the final _common_clean file
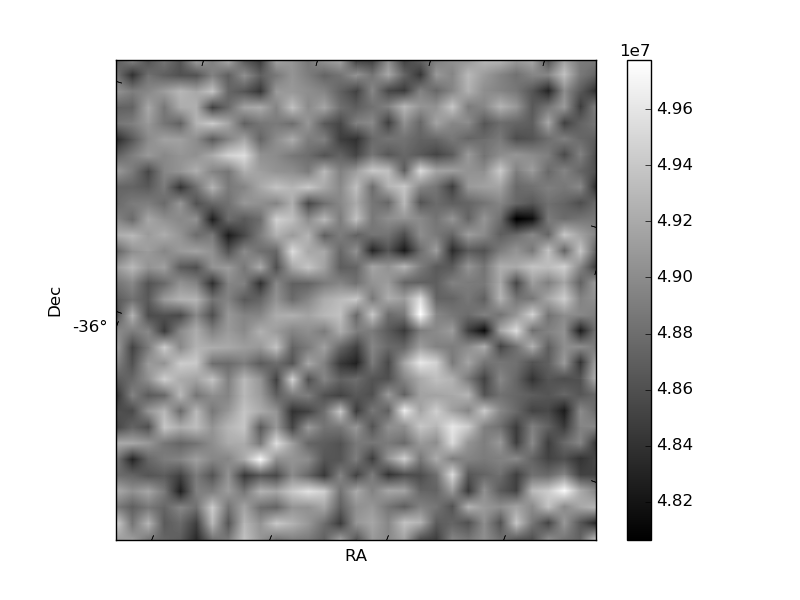
| Quadrant A |  |
 |
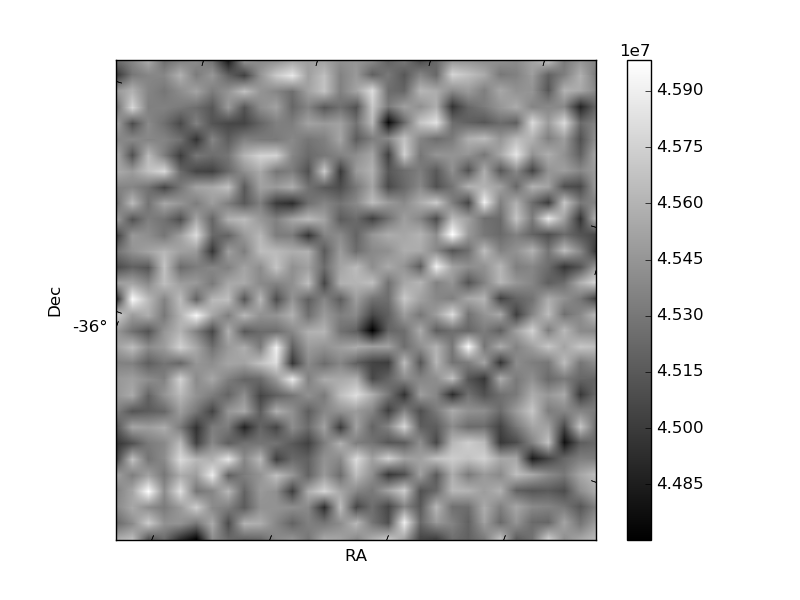
Quadrant B |
|---|---|---|---|
| Quadrant D | 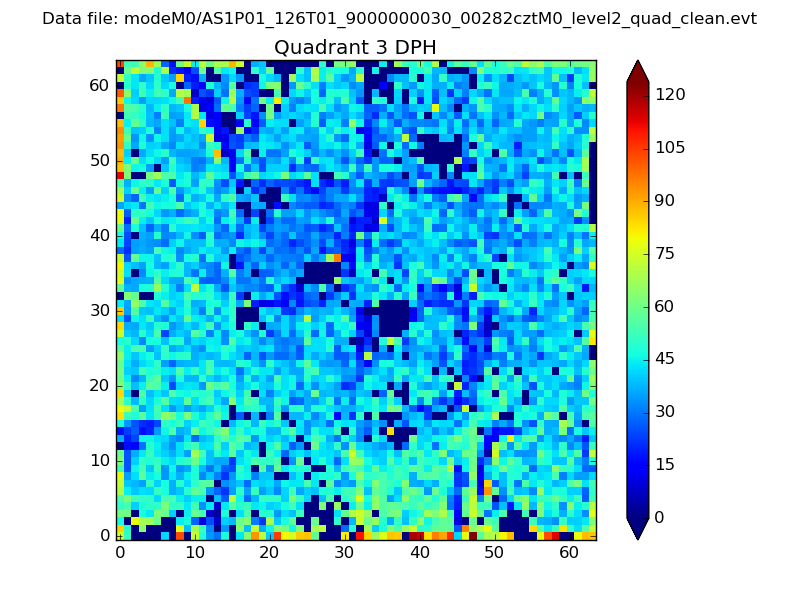 |
 |
Quadrant C |
| Plot type | Count rate plots | Images |
|---|---|---|
| Comparison with Poisson distribution Blue bars denote a histogram of data divided into 1 sec bins. Red curve is a Poisson curve with rate = median count rate of data. |
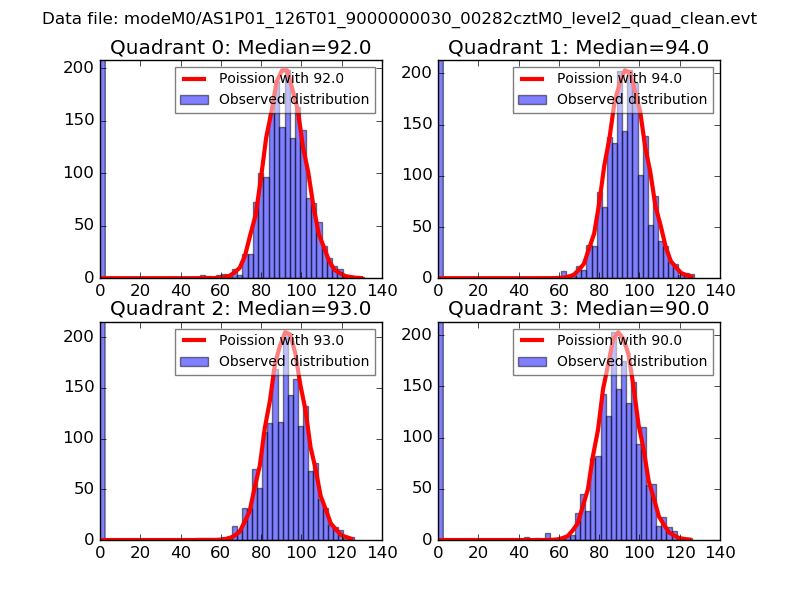 |
 |
| Quadrant-wise count rates Data is divided into 100 sec bins |
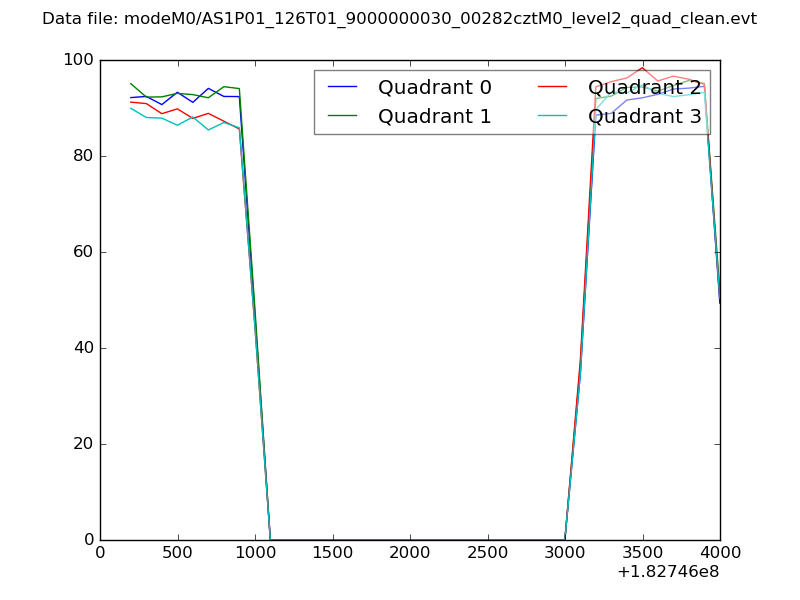 |
|
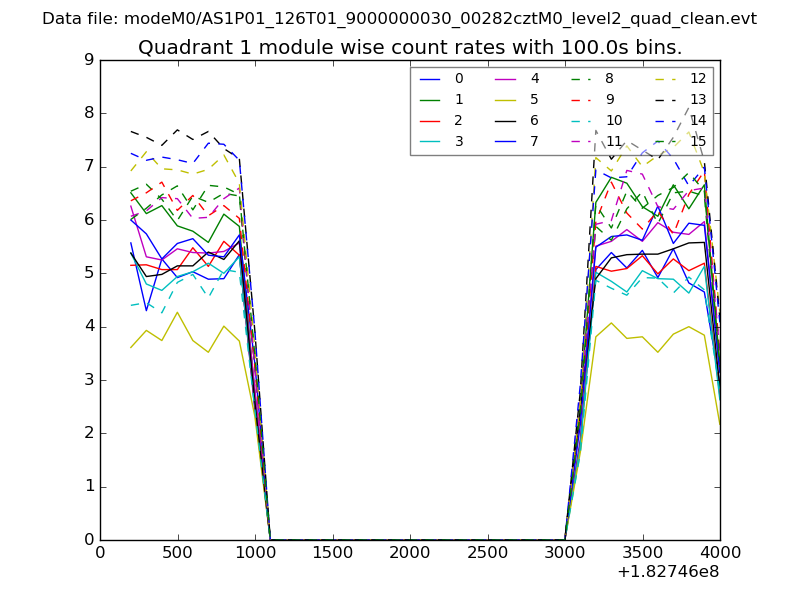
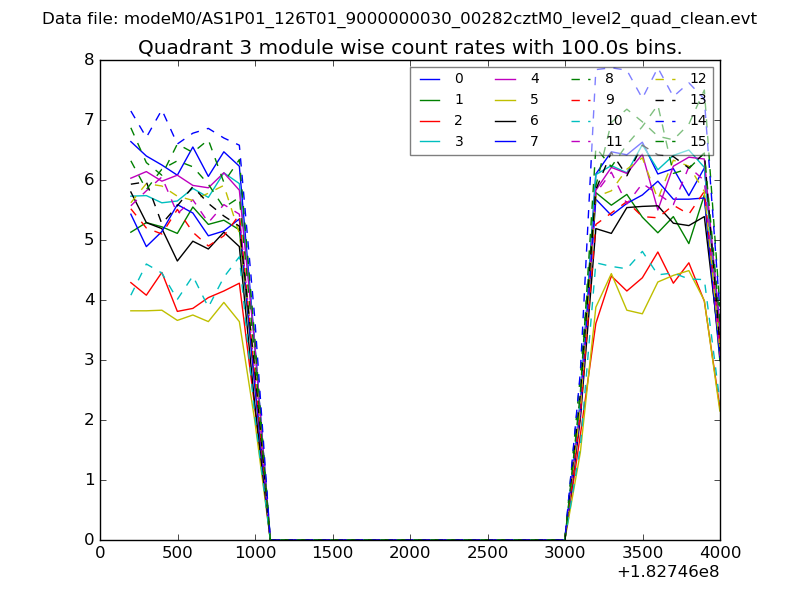
| Module-wise count rates for Quadrant A Data is divided into 100 sec bins |
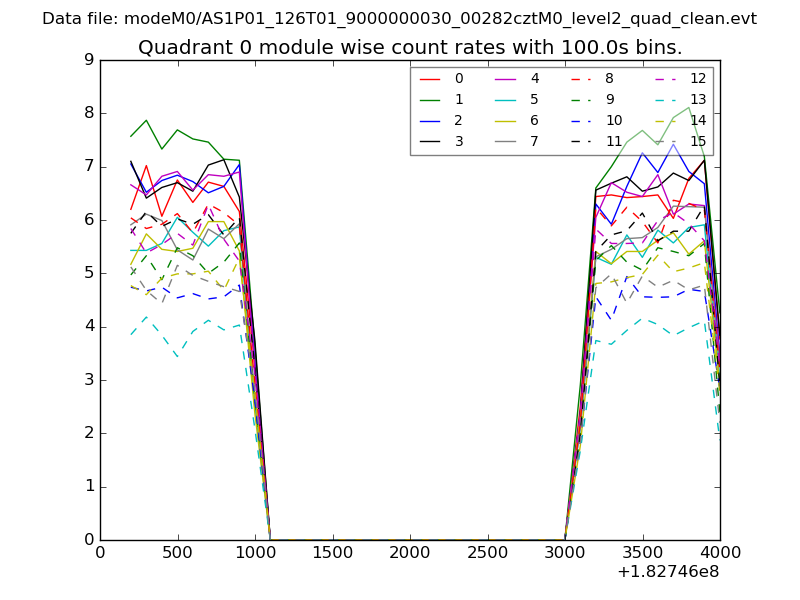 |
 |
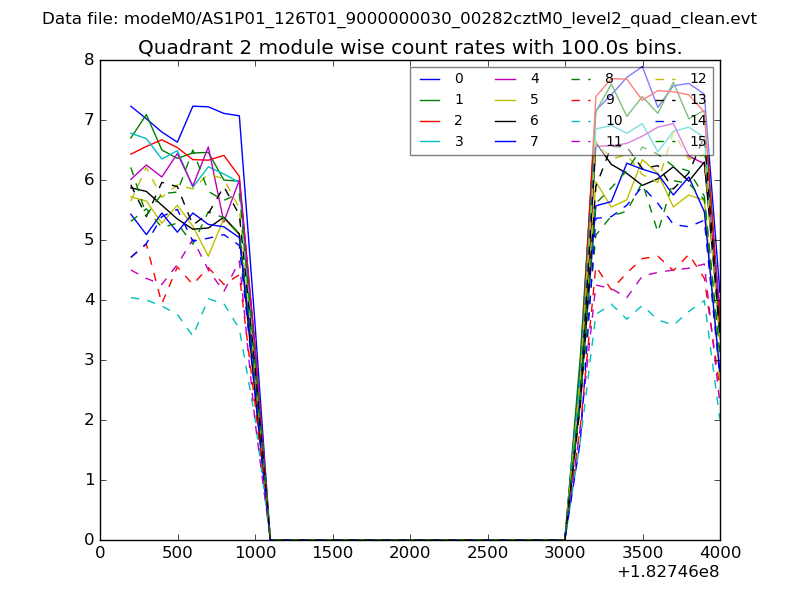
| Module-wise count rates for Quadrant B Data is divided into 100 sec bins |
 |
 |
| Module-wise count rates for Quadrant C Data is divided into 100 sec bins |
 |
 |
| Module-wise count rates for Quadrant D Data is divided into 100 sec bins |
 |
 |
| Parameter | Plot |
|---|---|
| CZT HV Monitor | 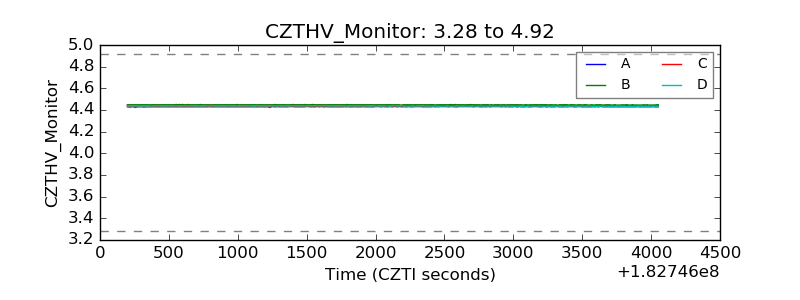 |
| D_VDD | 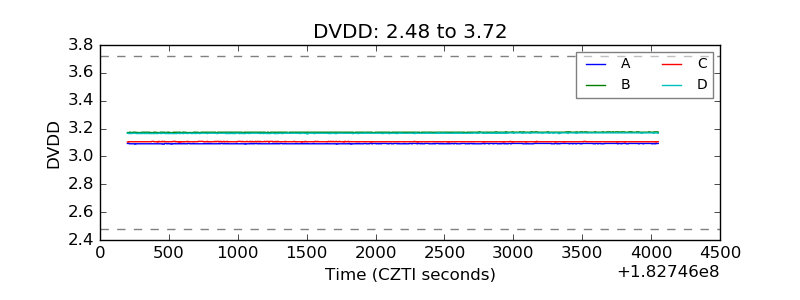 |
| Temperature 1 | 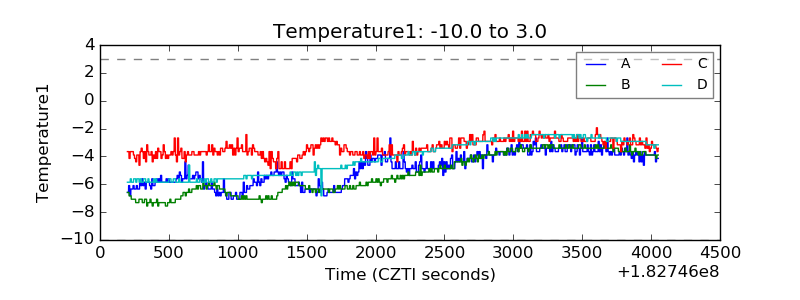 |
| Veto HV Monitor | 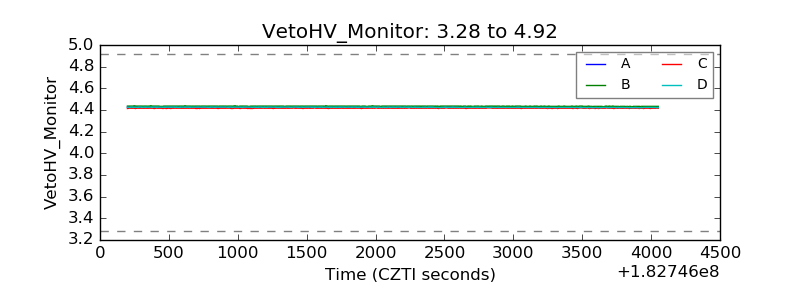 |
| Veto LLD | 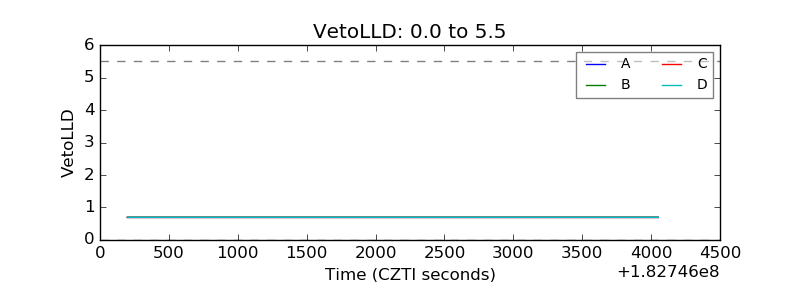 |
| Alpha Counter | 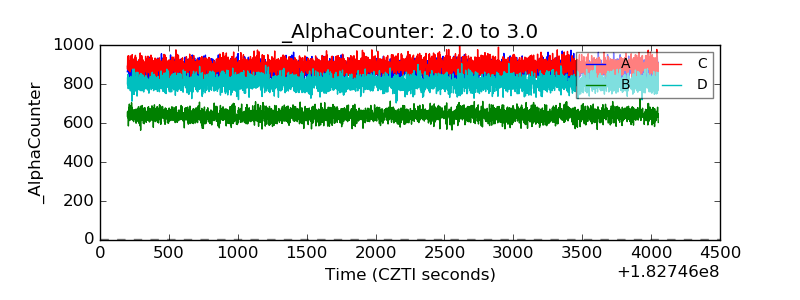 |
| _CPM_Rate | 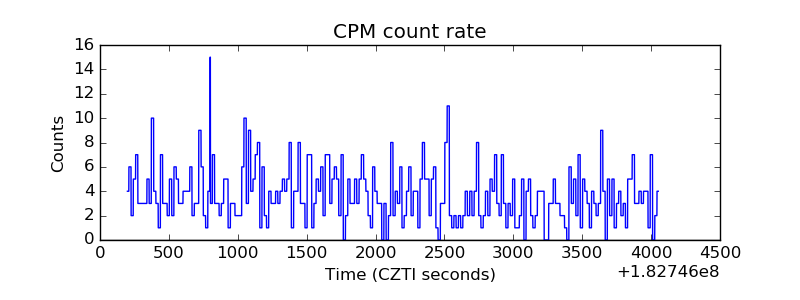 |
| CZT Counter | 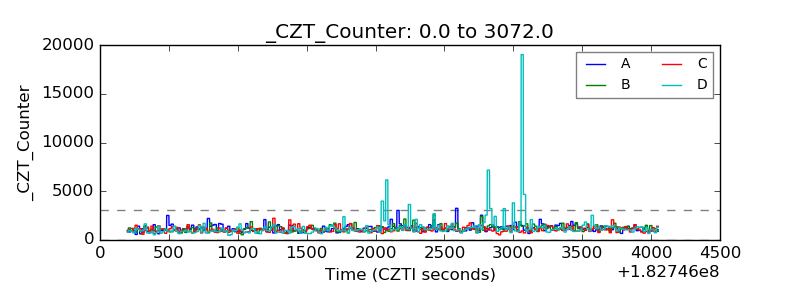 |
| +2.5 Volts monitor |  |
| +5 Volts monitor | 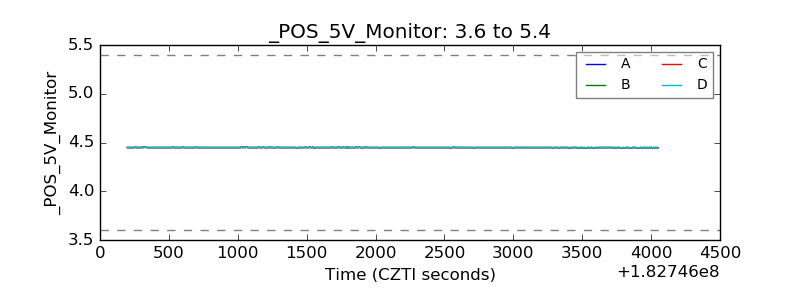 |
| _ROLL_ROT | 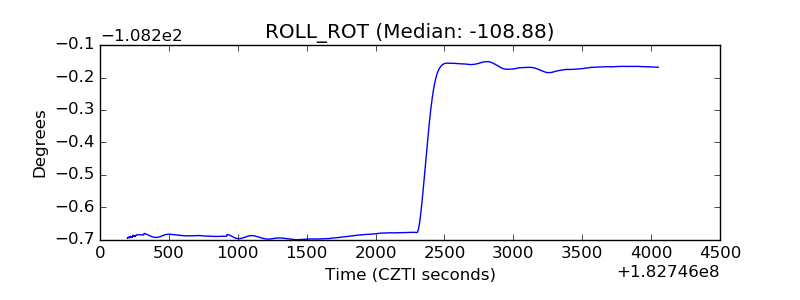 |
| _Roll_DEC | 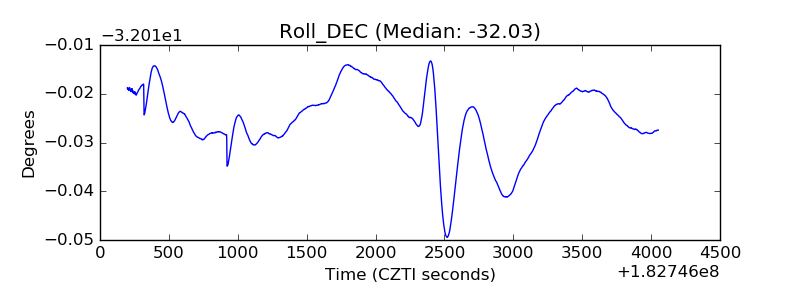 |
| _Roll_RA | 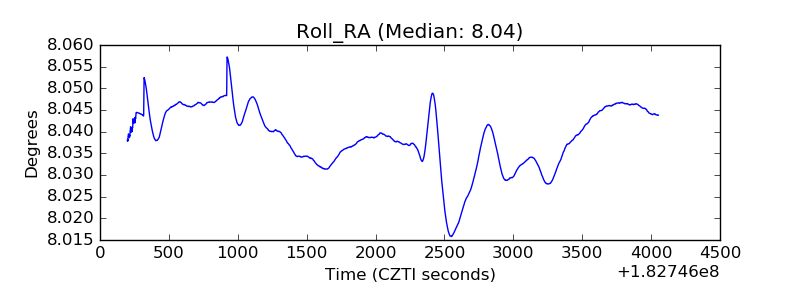 |
| Veto Counter |  |