| Param | Original file | Final file |
|---|---|---|
| Filename | modeM0/AS1P01_126T02_9000000034cztM0_level2.fits | modeM0/AS1P01_126T02_9000000034cztM0_level2_quad_clean.evt |
| Size (bytes) | 358,796,160 | 385,205,760 |
| Size | 342.2 MB | 367.4 MB |
| Events in quadrant A | 2,009,676 | 2,211,096 |
| Events in quadrant B | 2,047,454 | 2,272,281 |
| Events in quadrant C | 2,018,832 | 2,148,429 |
| Events in quadrant D | 1,719,396 | 1,963,402 |
| Mode M9 | |||
|---|---|---|---|
| Quadrant | BADHDUFLAG | Total packets | Discarded packets |
| A | 0 | 171 | 0 |
| B | 0 | 171 | 0 |
| C | 0 | 171 | 0 |
| D | 0 | 171 | 0 |
| Mode M0 | |||
|---|---|---|---|
| Quadrant | BADHDUFLAG | Total packets | Discarded packets |
| A | 0 | 225541 | 0 |
| B | 0 | 188236 | 0 |
| C | 0 | 178093 | 0 |
| D | 0 | 175757 | 0 |
| Mode SS | |||
|---|---|---|---|
| Quadrant | BADHDUFLAG | Total packets | Discarded packets |
| A | 0 | 914 | 0 |
| B | 0 | 914 | 0 |
| C | 0 | 914 | 0 |
| D | 0 | 914 | 0 |
| Quadrant | Total seconds | Saturated seconds | Saturation percentage |
|---|---|---|---|
| A | 44732 | 594 | 1.327908% |
| B | 44732 | 80 | 0.178843% |
| C | 44732 | 46 | 0.102835% |
| D | 44732 | 334 | 0.746669% |
Noise dominated data is calculated using 1-second bins in cleaned event files. If a bin has >2000 counts, and if more than 50% of those come from <1% of pixels, then it is considered to be noise-dominated and hence unusable.
| Quadrant | # 1 sec bins | Bins with >0 counts | Bins with >2000 counts | High rate bins dominated by noise | Noise dominated (total time) | Noise dominated (detector-on time) | Marked lightcurve |
|---|---|---|---|---|---|---|---|
| A | 61787 | 44722 | 0 | 0 | 0.00% | 0.00% |  |
| B | 61787 | 44732 | 0 | 0 | 0.00% | 0.00% |  |
| C | 61787 | 44732 | 0 | 0 | 0.00% | 0.00% |  |
| D | 61787 | 44715 | 0 | 0 | 0.00% | 0.00% |  |
Top three noisy pixels from each quadrant. If the there are fewer than three noisy pixels in the level2.evt file, extra rows are filled as -1
| Pixel properties | Quadrant properties | ||||||
|---|---|---|---|---|---|---|---|
| Quadrant | DetID | PixID | Counts | Sigma | Mean | Median | Sigma |
| A | 7 | 110 | 1947 | 11.58 | 522 | 487 | 126.0 |
| A | 0 | 29 | 1862 | 10.91 | 522 | 487 | 126.0 |
| A | 0 | 28 | 1435 | 7.52 | 522 | 487 | 126.0 |
| B | 2 | 9 | 1677 | 11.85 | 542 | 515 | 98.1 |
| B | 14 | 254 | 1366 | 8.67 | 542 | 515 | 98.1 |
| B | 2 | 8 | 1334 | 8.35 | 542 | 515 | 98.1 |
| C | 12 | 241 | 1452 | 7.12 | 534 | 493 | 134.7 |
| C | 2 | 191 | 1386 | 6.63 | 534 | 493 | 134.7 |
| C | 3 | 187 | 1372 | 6.53 | 534 | 493 | 134.7 |
| D | 6 | 231 | 1336 | 7.3 | 493 | 452 | 121.2 |
| D | 3 | 14 | 1275 | 6.79 | 493 | 452 | 121.2 |
| D | 1 | 19 | 1269 | 6.74 | 493 | 452 | 121.2 |
Histogram calculated using DETX and DETY for each event in the final _common_clean file
| Quadrant A | 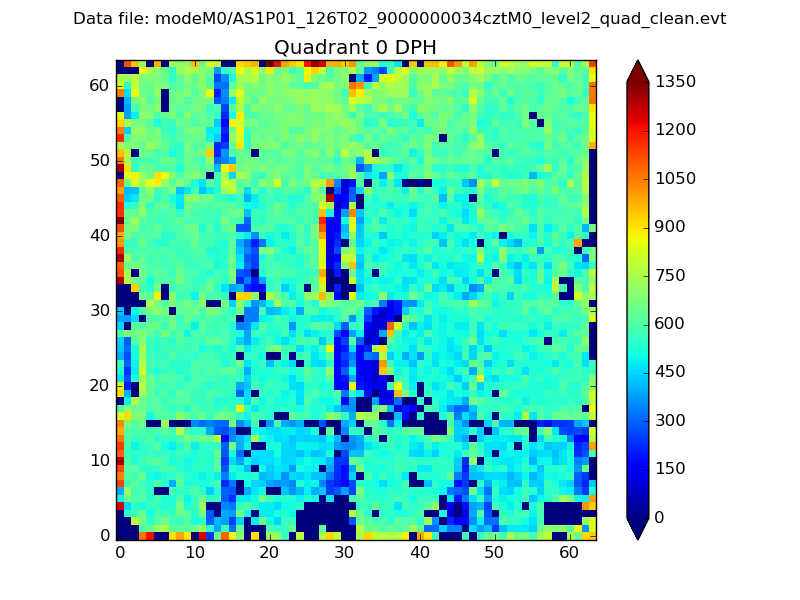 |
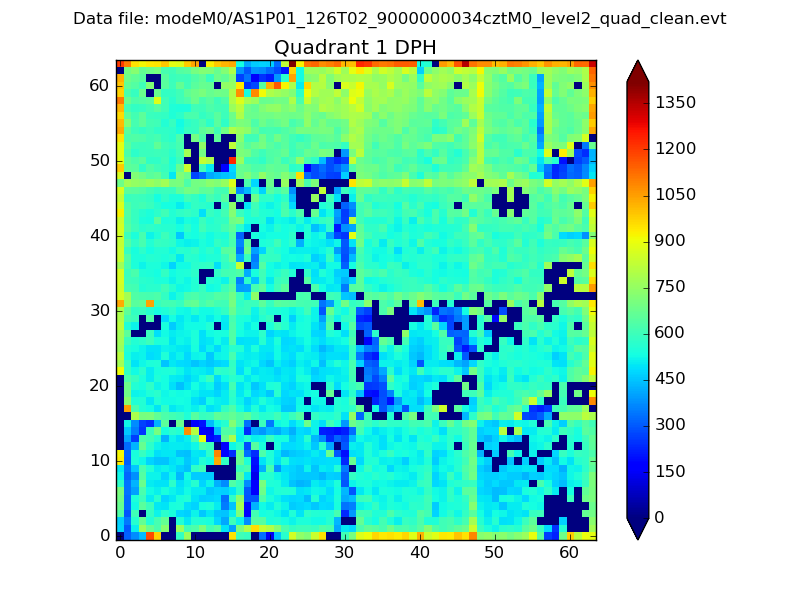 |
Quadrant B |
|---|---|---|---|
| Quadrant D |  |
 |
Quadrant C |
| Plot type | Count rate plots | Images |
|---|---|---|
| Comparison with Poisson distribution Blue bars denote a histogram of data divided into 1 sec bins. Red curve is a Poisson curve with rate = median count rate of data. |
 |
 |
| Quadrant-wise count rates Data is divided into 100 sec bins |
 |
|
| Module-wise count rates for Quadrant A Data is divided into 100 sec bins |
 |
 |
| Module-wise count rates for Quadrant B Data is divided into 100 sec bins |
 |
 |
| Module-wise count rates for Quadrant C Data is divided into 100 sec bins |
 |
 |
| Module-wise count rates for Quadrant D Data is divided into 100 sec bins |
 |
 |
| Parameter | Plot |
|---|---|
| CZT HV Monitor |  |
| D_VDD | 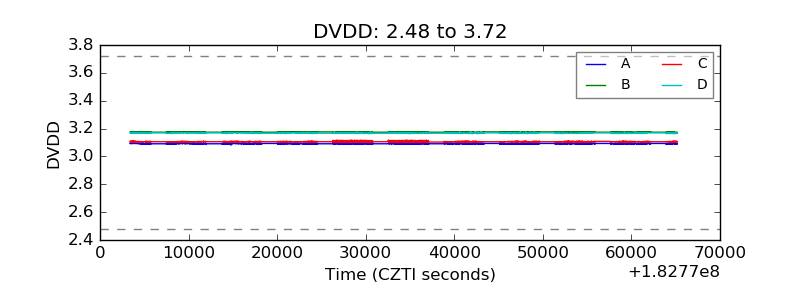 |
| Temperature 1 |  |
| Veto HV Monitor |  |
| Veto LLD |  |
| Alpha Counter | 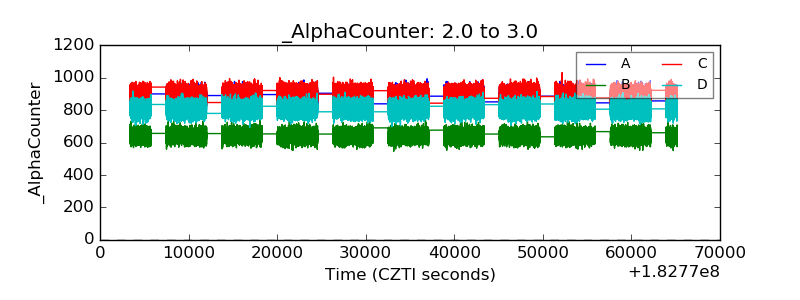 |
| _CPM_Rate | 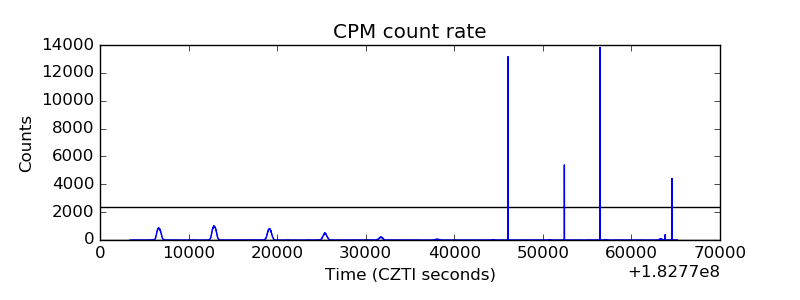 |
| CZT Counter |  |
| +2.5 Volts monitor |  |
| +5 Volts monitor |  |
| _ROLL_ROT |  |
| _Roll_DEC |  |
| _Roll_RA |  |
| Veto Counter |  |