| Param | Original file | Final file |
|---|---|---|
| Filename | modeM0/AS1P01_126T02_9000000034_00289cztM0_level2.evt | modeM0/AS1P01_126T02_9000000034_00289cztM0_level2_quad_clean.evt |
| Size (bytes) | 879,500,160 | 12,709,440 |
| Size | 838.8 MB | 12.1 MB |
| Events in quadrant A | 7,440,791 | 2,003 |
| Events in quadrant B | 6,551,278 | 2,005 |
| Events in quadrant C | 6,352,442 | 1,938 |
| Events in quadrant D | 5,935,026 | 1,918 |
| Mode M9 | |||
|---|---|---|---|
| Quadrant | BADHDUFLAG | Total packets | Discarded packets |
| A | 0 | 17 | 0 |
| B | 0 | 17 | 0 |
| C | 0 | 17 | 0 |
| D | 0 | 17 | 0 |
| Mode M0 | |||
|---|---|---|---|
| Quadrant | BADHDUFLAG | Total packets | Discarded packets |
| A | 0 | 25888 | 2 |
| B | 0 | 23240 | 1 |
| C | 0 | 22654 | 1 |
| D | 0 | 21439 | 1 |
| Mode SS | |||
|---|---|---|---|
| Quadrant | BADHDUFLAG | Total packets | Discarded packets |
| A | 0 | 110 | 0 |
| B | 0 | 110 | 0 |
| C | 0 | 110 | 0 |
| D | 0 | 110 | 0 |
| Quadrant | Total seconds | Saturated seconds | Saturation percentage |
|---|---|---|---|
| A | 5363 | 12 | 0.223755% |
| B | 5363 | 4 | 0.074585% |
| C | 5363 | 6 | 0.111878% |
| D | 5363 | 16 | 0.298340% |
Noise dominated data is calculated using 1-second bins in cleaned event files. If a bin has >2000 counts, and if more than 50% of those come from <1% of pixels, then it is considered to be noise-dominated and hence unusable.
| Quadrant | # 1 sec bins | Bins with >0 counts | Bins with >2000 counts | High rate bins dominated by noise | Noise dominated (total time) | Noise dominated (detector-on time) | Marked lightcurve |
|---|---|---|---|---|---|---|---|
| A | 7068 | 5364 | 335 | 335 | 4.74% | 6.25% | 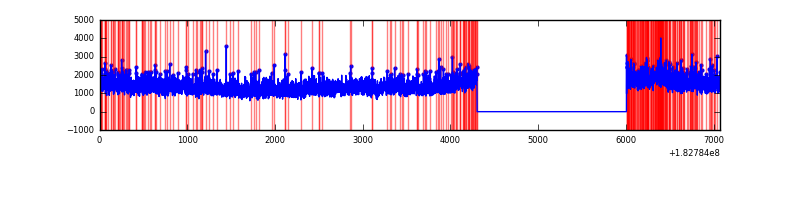 |
| B | 7068 | 5364 | 124 | 124 | 1.75% | 2.31% | 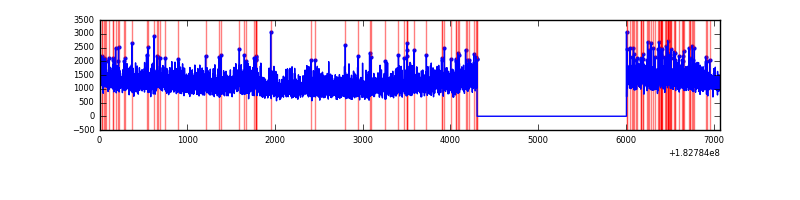 |
| C | 7068 | 5364 | 124 | 124 | 1.75% | 2.31% | 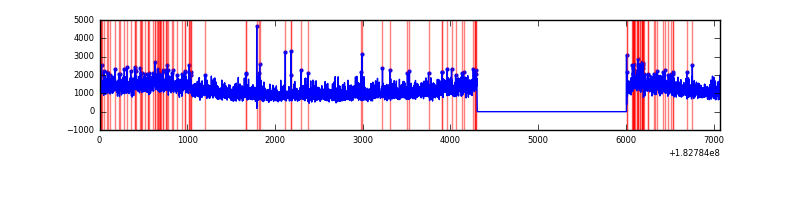 |
| D | 7068 | 5364 | 71 | 71 | 1.00% | 1.32% | 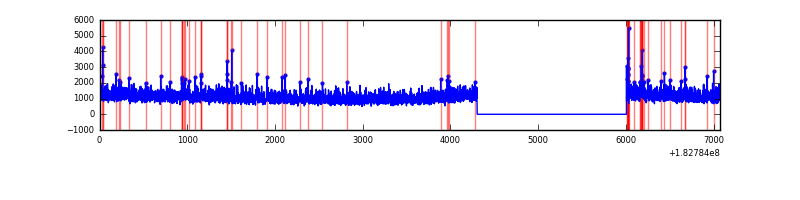 |
Top three noisy pixels from each quadrant. If the there are fewer than three noisy pixels in the level2.evt file, extra rows are filled as -1
| Pixel properties | Quadrant properties | ||||||
|---|---|---|---|---|---|---|---|
| Quadrant | DetID | PixID | Counts | Sigma | Mean | Median | Sigma |
| A | 15 | 127 | 982073 | 2668.8 | 1660 | 1646 | 367.4 |
| A | 13 | 50 | 12863 | 30.53 | 1660 | 1646 | 367.4 |
| A | 13 | 17 | 12509 | 29.57 | 1660 | 1646 | 367.4 |
| B | 0 | 183 | 66933 | 168.72 | 1646 | 1661 | 386.9 |
| B | 7 | 220 | 66225 | 166.89 | 1646 | 1661 | 386.9 |
| B | 0 | 85 | 38427 | 95.04 | 1646 | 1661 | 386.9 |
| C | 5 | 234 | 317663 | 771.42 | 1462 | 1509 | 409.8 |
| C | 1 | 1 | 234677 | 568.93 | 1462 | 1509 | 409.8 |
| C | 3 | 159 | 26683 | 61.42 | 1462 | 1509 | 409.8 |
| D | 13 | 7 | 135002 | 295.98 | 1432 | 1489 | 451.1 |
| D | 13 | 216 | 108488 | 237.2 | 1432 | 1489 | 451.1 |
| D | 1 | 4 | 108185 | 236.53 | 1432 | 1489 | 451.1 |
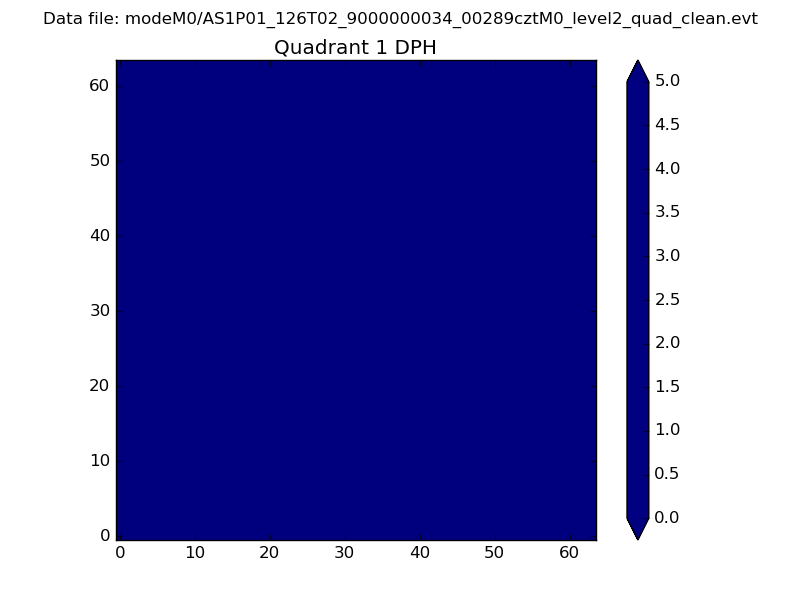
Histogram calculated using DETX and DETY for each event in the final _common_clean file
| Quadrant A |  |
 |
Quadrant B |
|---|---|---|---|
| Quadrant D | 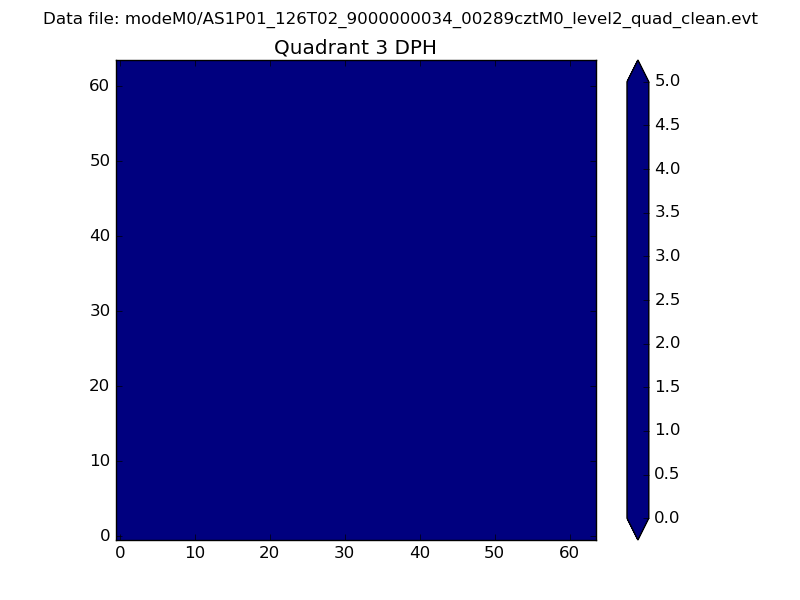 |
 |
Quadrant C |
| Plot type | Count rate plots | Images |
|---|---|---|
| Comparison with Poisson distribution Blue bars denote a histogram of data divided into 1 sec bins. Red curve is a Poisson curve with rate = median count rate of data. |
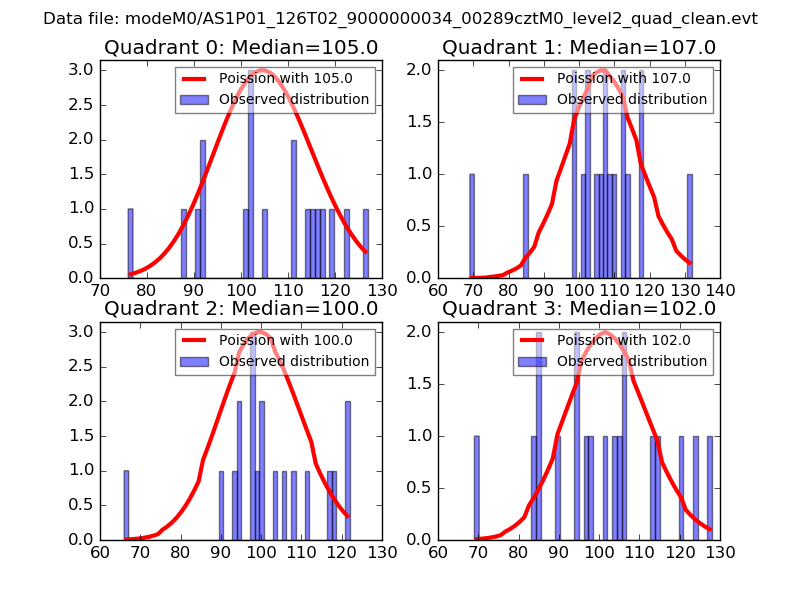 |
 |
| Quadrant-wise count rates Data is divided into 100 sec bins |
 |
|
| Module-wise count rates for Quadrant A Data is divided into 100 sec bins |
 |
 |
| Module-wise count rates for Quadrant B Data is divided into 100 sec bins |
 |
 |
| Module-wise count rates for Quadrant C Data is divided into 100 sec bins |
 |
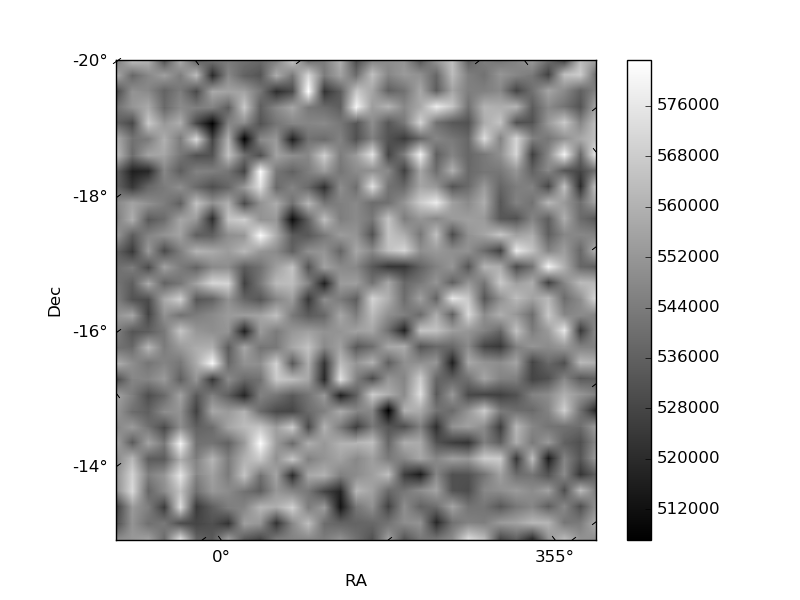 |
| Module-wise count rates for Quadrant D Data is divided into 100 sec bins |
 |
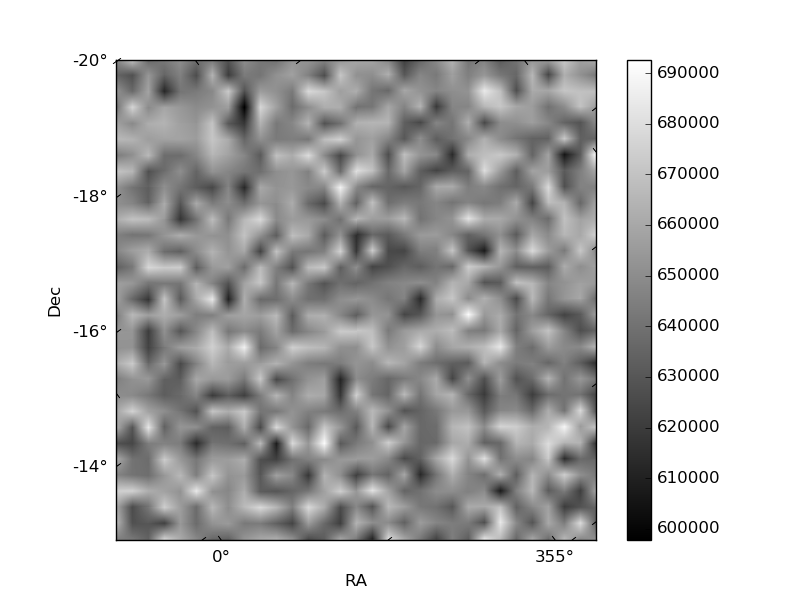 |
| Parameter | Plot |
|---|---|
| CZT HV Monitor | 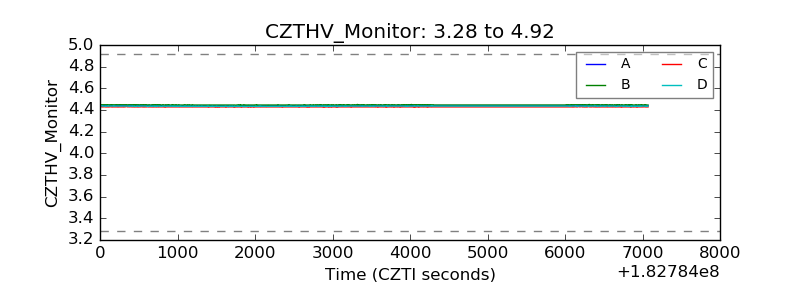 |
| D_VDD | 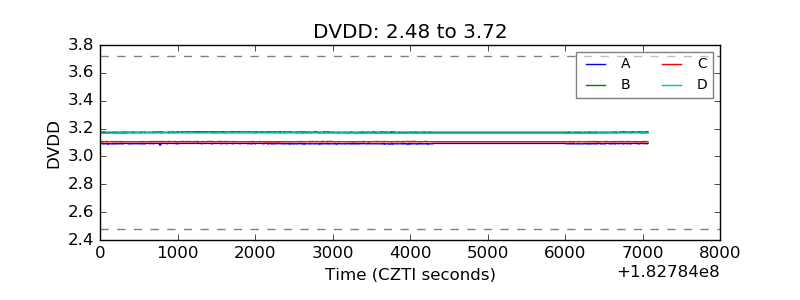 |
| Temperature 1 | 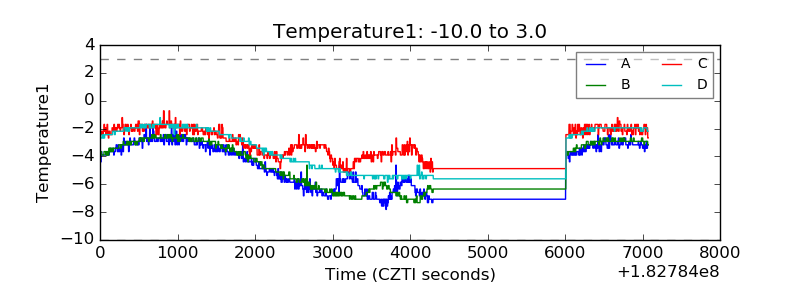 |
| Veto HV Monitor | 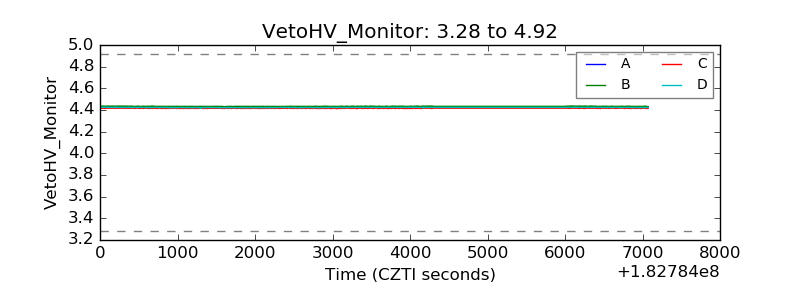 |
| Veto LLD | 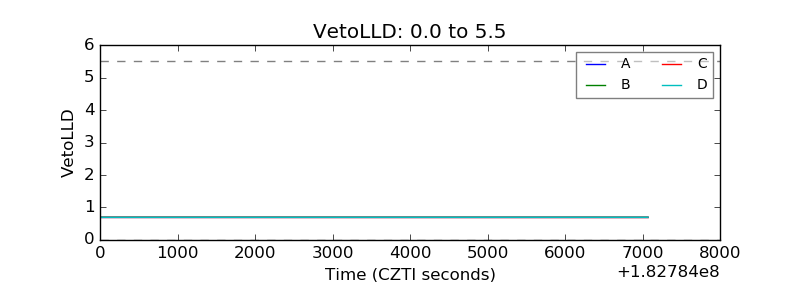 |
| Alpha Counter | 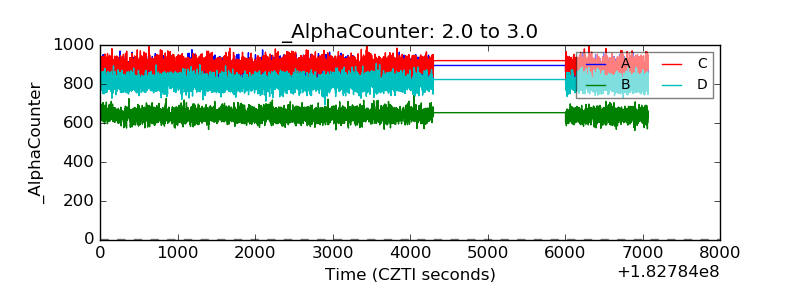 |
| _CPM_Rate | 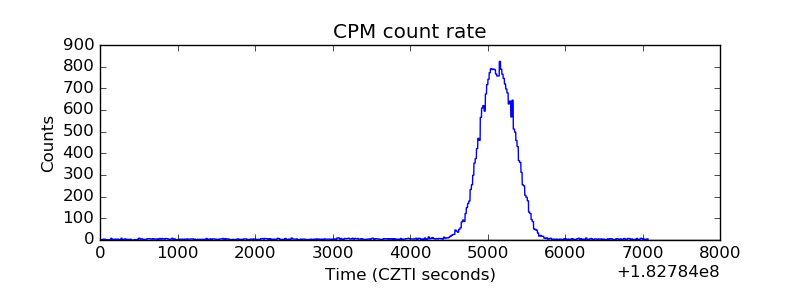 |
| CZT Counter |  |
| +2.5 Volts monitor |  |
| +5 Volts monitor | 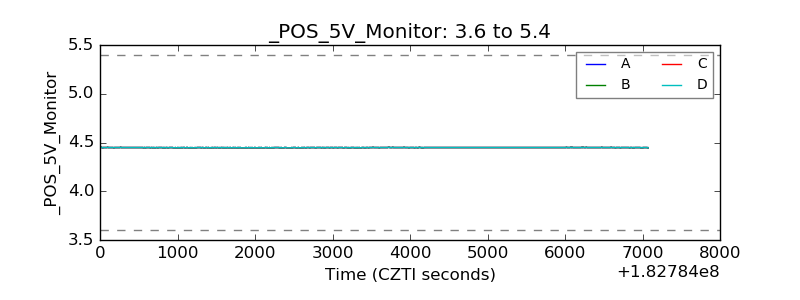 |
| _ROLL_ROT | 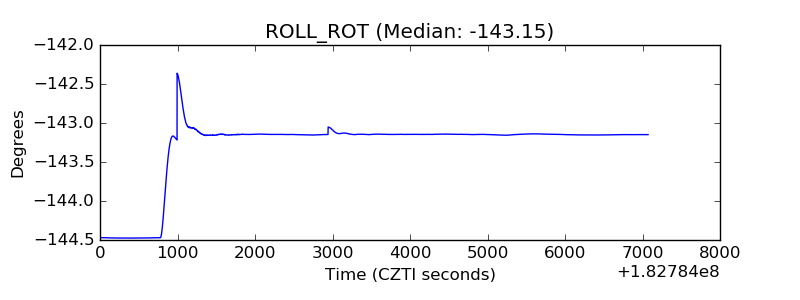 |
| _Roll_DEC | 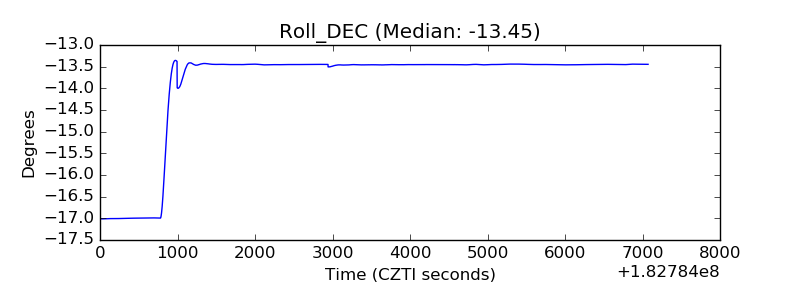 |
| _Roll_RA | 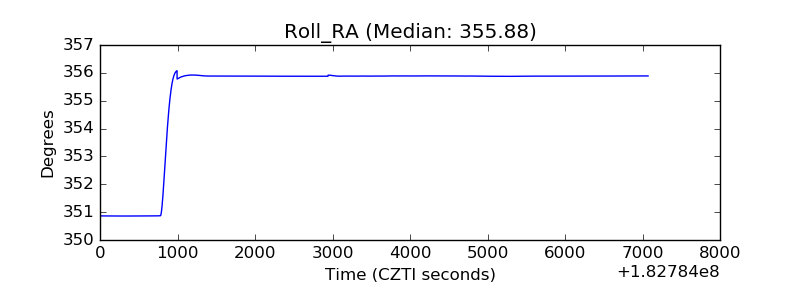 |
| Veto Counter | 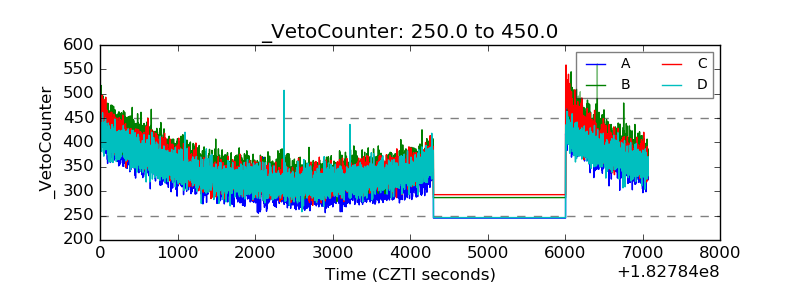 |