| Param | Original file | Final file |
|---|---|---|
| Filename | modeM0/AS1P01_126T02_9000000034_00291cztM0_level2.evt | modeM0/AS1P01_126T02_9000000034_00291cztM0_level2_quad_clean.evt |
| Size (bytes) | 1,003,000,320 | 51,396,480 |
| Size | 956.5 MB | 49.0 MB |
| Events in quadrant A | 10,287,803 | 282,990 |
| Events in quadrant B | 6,759,967 | 294,432 |
| Events in quadrant C | 6,070,154 | 286,990 |
| Events in quadrant D | 6,871,453 | 283,210 |
| Mode M9 | |||
|---|---|---|---|
| Quadrant | BADHDUFLAG | Total packets | Discarded packets |
| A | 0 | 17 | 0 |
| B | 0 | 17 | 0 |
| C | 0 | 17 | 0 |
| D | 0 | 17 | 0 |
| Mode M0 | |||
|---|---|---|---|
| Quadrant | BADHDUFLAG | Total packets | Discarded packets |
| A | 0 | 34623 | 2 |
| B | 0 | 24273 | 1 |
| C | 0 | 22222 | 1 |
| D | 0 | 24645 | 1 |
| Mode SS | |||
|---|---|---|---|
| Quadrant | BADHDUFLAG | Total packets | Discarded packets |
| A | 0 | 118 | 0 |
| B | 0 | 118 | 0 |
| C | 0 | 118 | 0 |
| D | 0 | 118 | 0 |
| Quadrant | Total seconds | Saturated seconds | Saturation percentage |
|---|---|---|---|
| A | 5842 | 25 | 0.427936% |
| B | 5842 | 8 | 0.136939% |
| C | 5842 | 7 | 0.119822% |
| D | 5842 | 141 | 2.413557% |
Noise dominated data is calculated using 1-second bins in cleaned event files. If a bin has >2000 counts, and if more than 50% of those come from <1% of pixels, then it is considered to be noise-dominated and hence unusable.
| Quadrant | # 1 sec bins | Bins with >0 counts | Bins with >2000 counts | High rate bins dominated by noise | Noise dominated (total time) | Noise dominated (detector-on time) | Marked lightcurve |
|---|---|---|---|---|---|---|---|
| A | 7547 | 5843 | 1347 | 1347 | 17.85% | 23.05% | 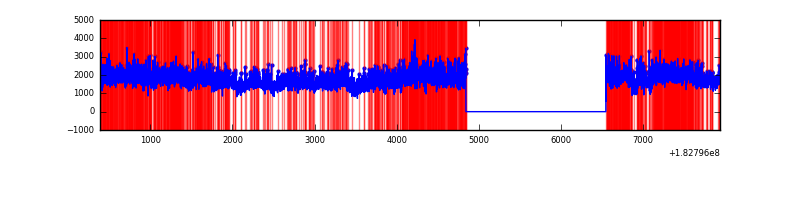 |
| B | 7547 | 5843 | 99 | 99 | 1.31% | 1.69% | 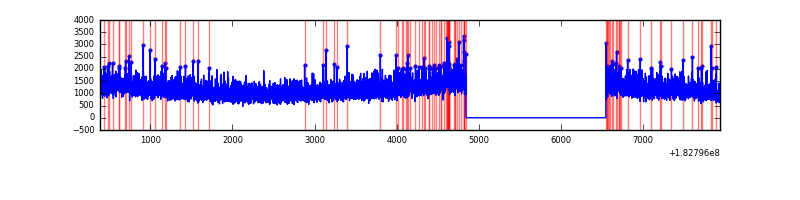 |
| C | 7547 | 5843 | 52 | 52 | 0.69% | 0.89% | 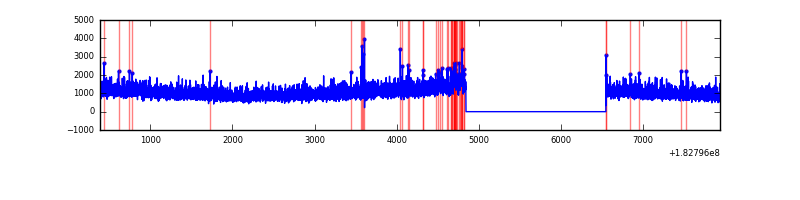 |
| D | 7547 | 5843 | 452 | 452 | 5.99% | 7.74% | 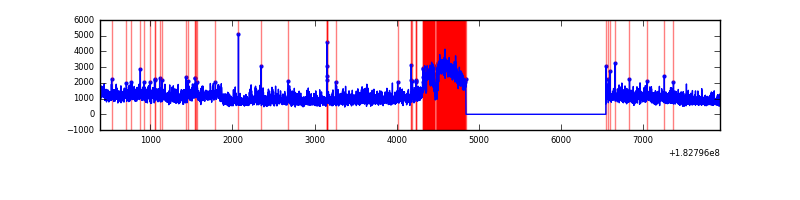 |
Top three noisy pixels from each quadrant. If the there are fewer than three noisy pixels in the level2.evt file, extra rows are filled as -1
| Pixel properties | Quadrant properties | ||||||
|---|---|---|---|---|---|---|---|
| Quadrant | DetID | PixID | Counts | Sigma | Mean | Median | Sigma |
| A | 15 | 127 | 3550697 | 9295.91 | 1724 | 1710 | 381.8 |
| A | 13 | 50 | 43203 | 108.68 | 1724 | 1710 | 381.8 |
| A | 11 | 242 | 15138 | 35.17 | 1724 | 1710 | 381.8 |
| B | 11 | 51 | 29823 | 69.31 | 1728 | 1743 | 405.1 |
| B | 5 | 46 | 27932 | 64.64 | 1728 | 1743 | 405.1 |
| B | 0 | 183 | 22215 | 50.53 | 1728 | 1743 | 405.1 |
| C | 1 | 192 | 42685 | 96.12 | 1523 | 1574 | 427.7 |
| C | 3 | 159 | 15477 | 32.51 | 1523 | 1574 | 427.7 |
| C | 7 | 255 | 15004 | 31.4 | 1523 | 1574 | 427.7 |
| D | 2 | 253 | 714899 | 1533.51 | 1473 | 1532 | 465.2 |
| D | 10 | 62 | 181444 | 386.75 | 1473 | 1532 | 465.2 |
| D | 13 | 216 | 170176 | 362.53 | 1473 | 1532 | 465.2 |
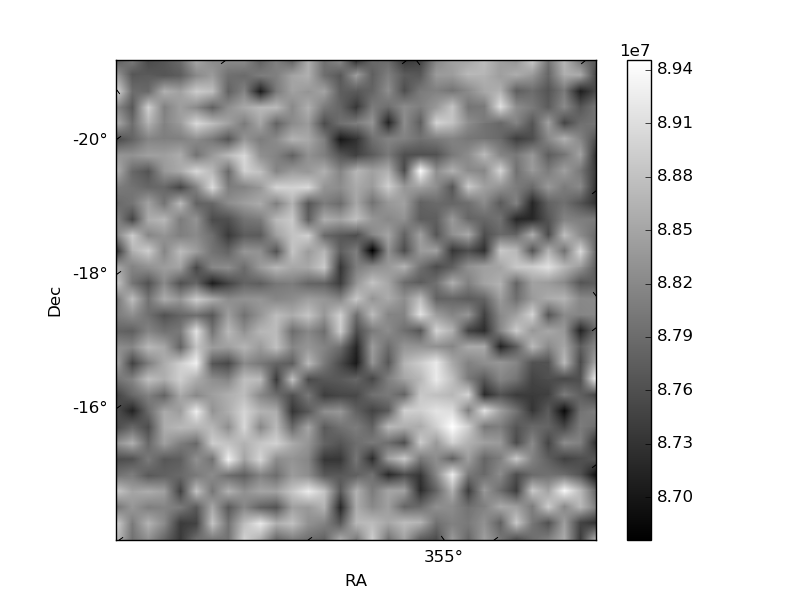
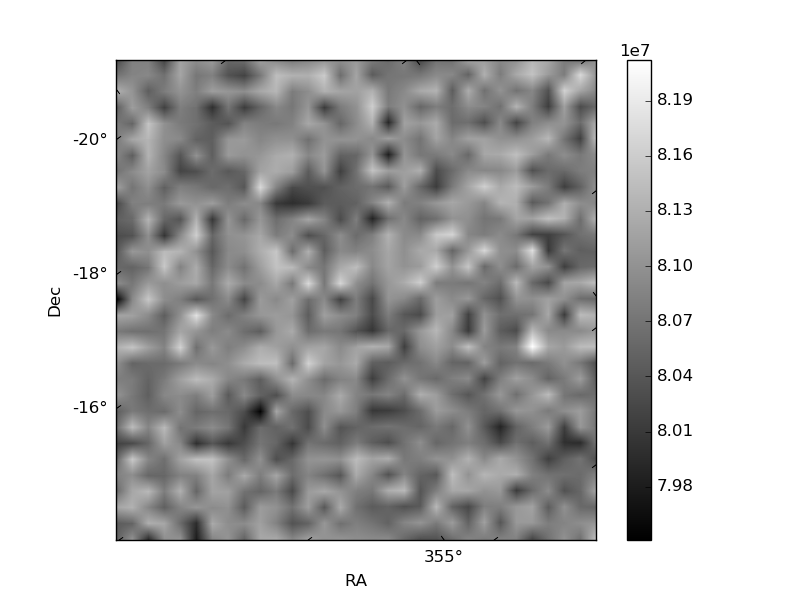
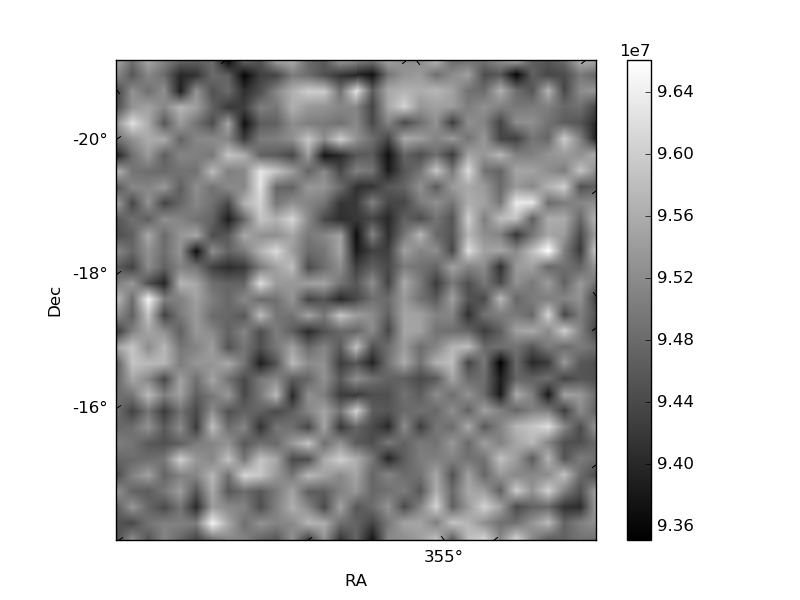
Histogram calculated using DETX and DETY for each event in the final _common_clean file
| Quadrant A | 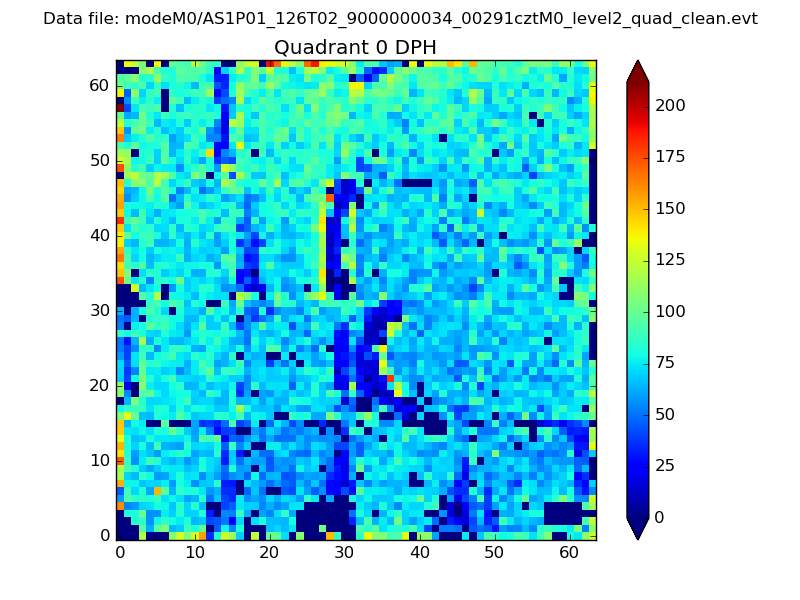 |
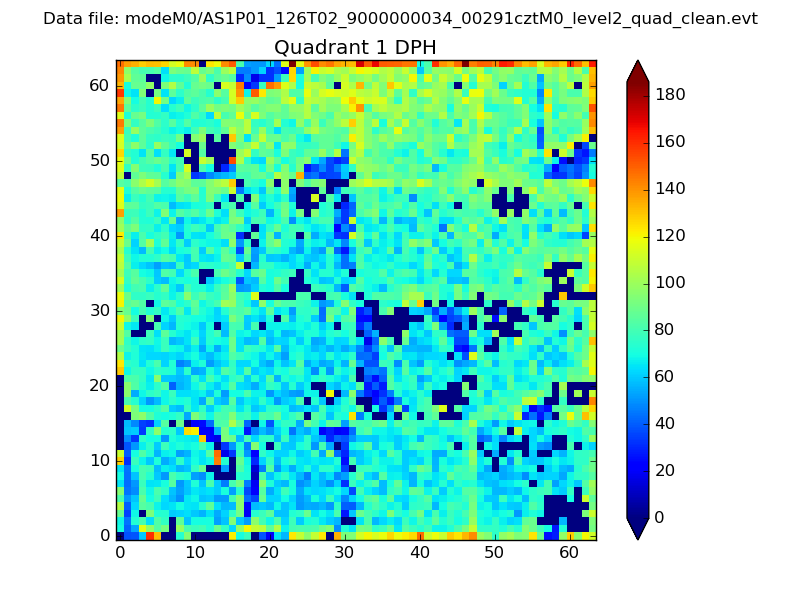 |
Quadrant B |
|---|---|---|---|
| Quadrant D | 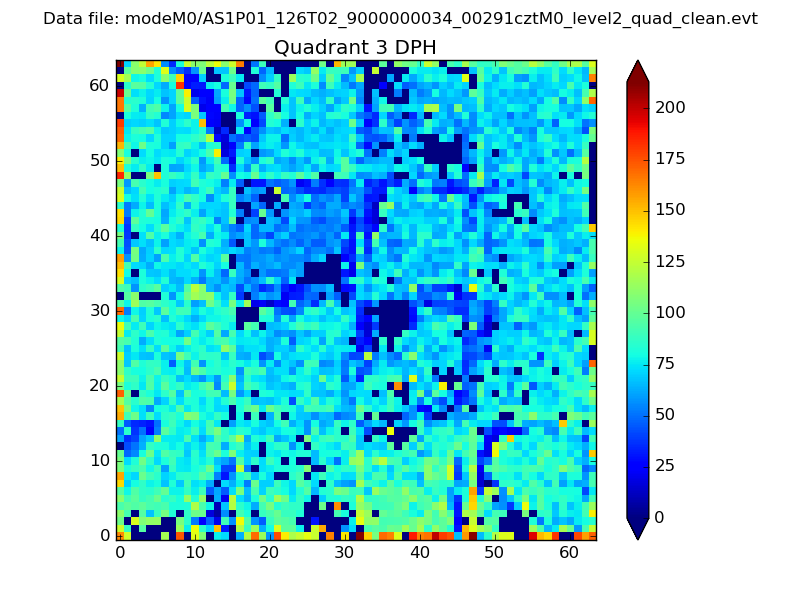 |
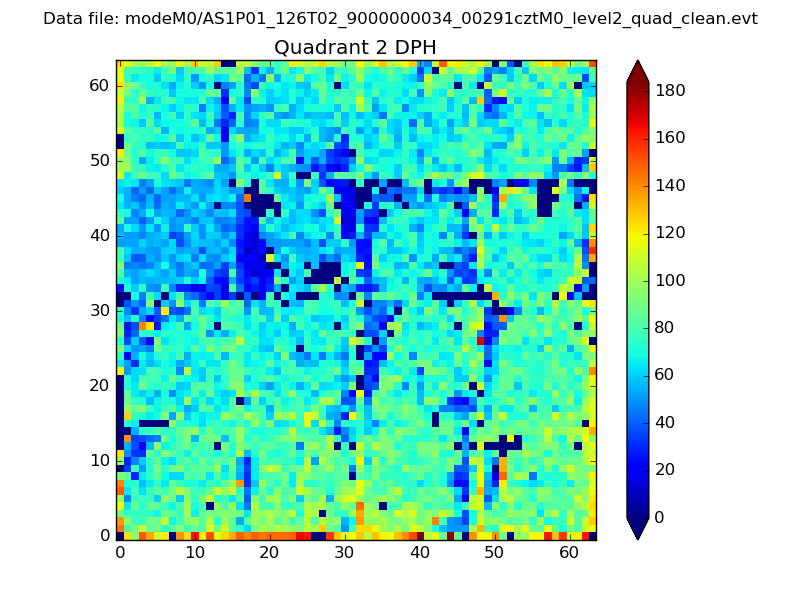 |
Quadrant C |
| Plot type | Count rate plots | Images |
|---|---|---|
| Comparison with Poisson distribution Blue bars denote a histogram of data divided into 1 sec bins. Red curve is a Poisson curve with rate = median count rate of data. |
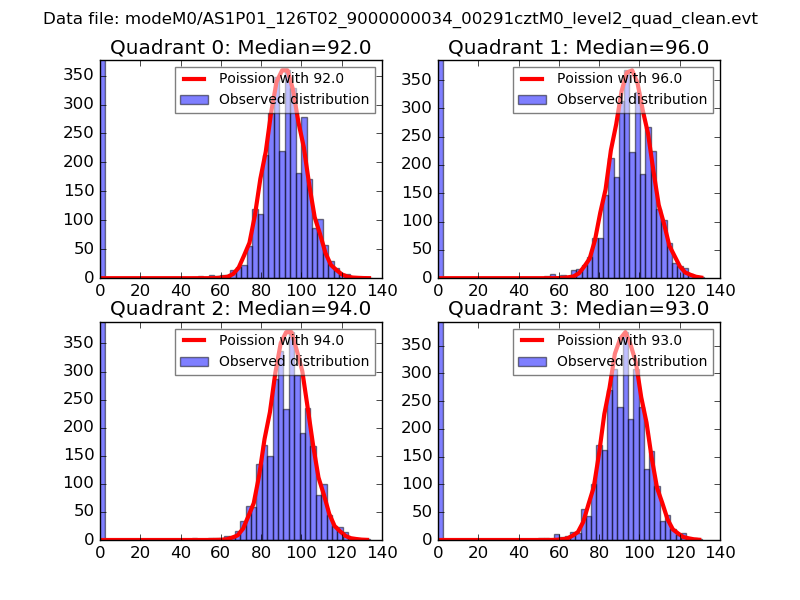 |
 |
| Quadrant-wise count rates Data is divided into 100 sec bins |
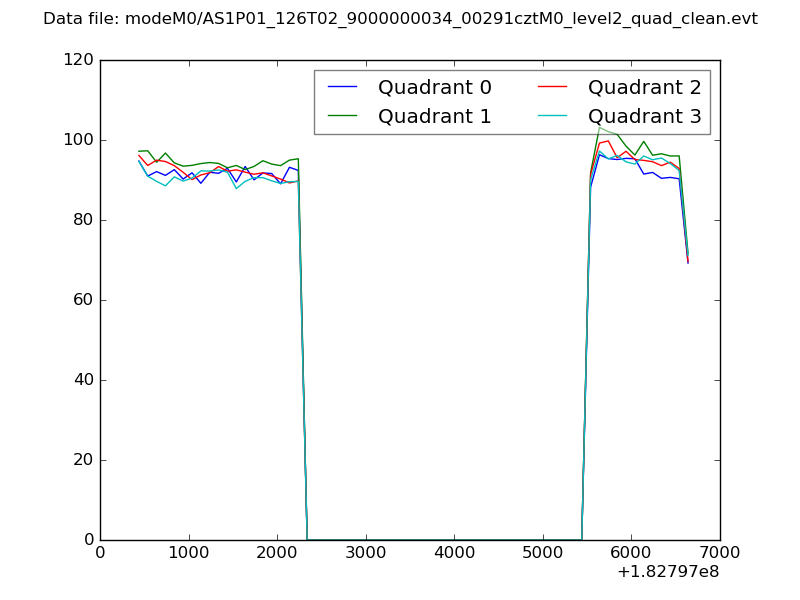 |
|
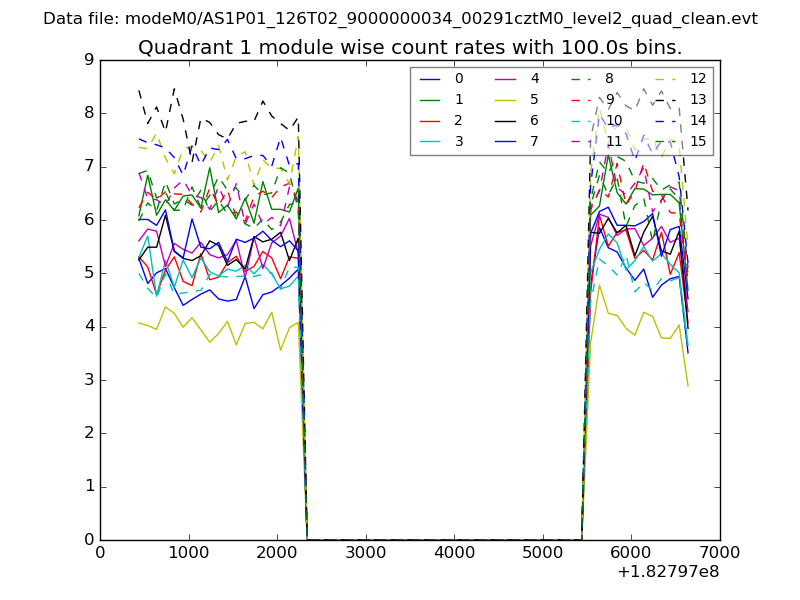
| Module-wise count rates for Quadrant A Data is divided into 100 sec bins |
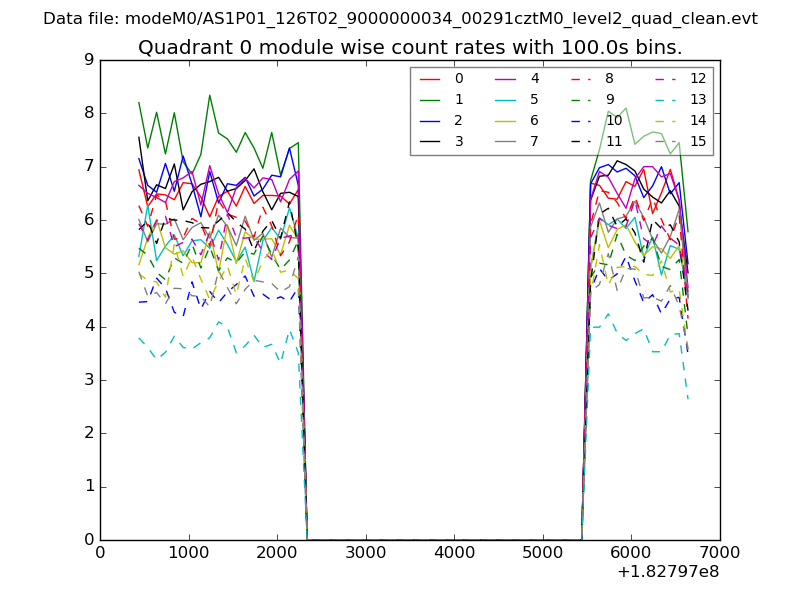 |
 |
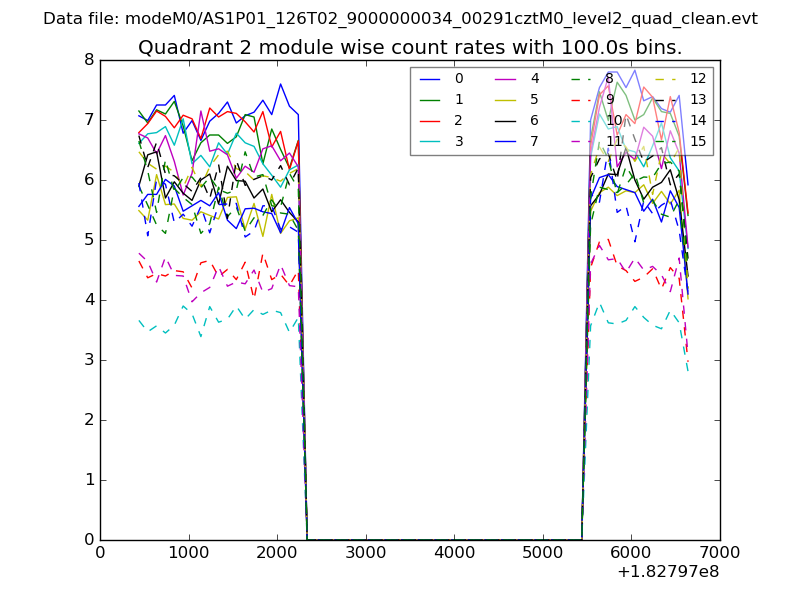
| Module-wise count rates for Quadrant B Data is divided into 100 sec bins |
 |
 |
| Module-wise count rates for Quadrant C Data is divided into 100 sec bins |
 |
 |
| Module-wise count rates for Quadrant D Data is divided into 100 sec bins |
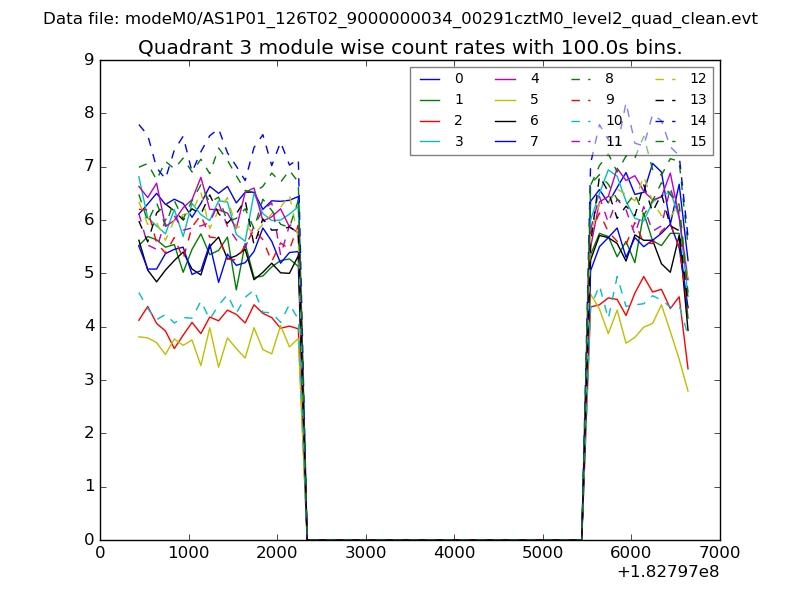 |
 |
| Parameter | Plot |
|---|---|
| CZT HV Monitor | 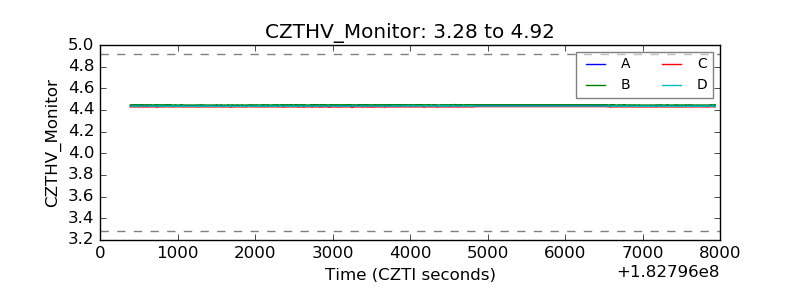 |
| D_VDD | 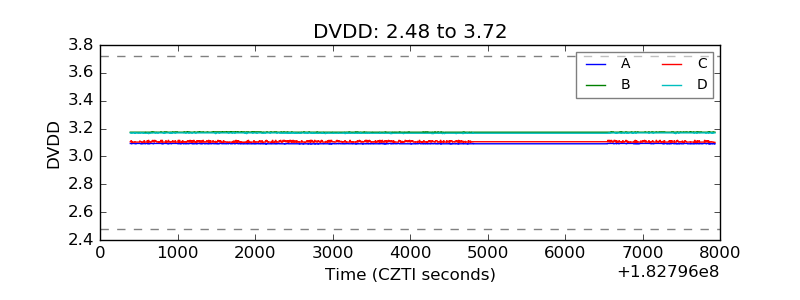 |
| Temperature 1 | 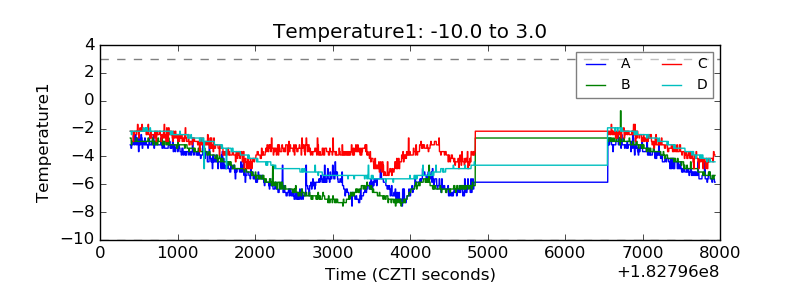 |
| Veto HV Monitor |  |
| Veto LLD |  |
| Alpha Counter | 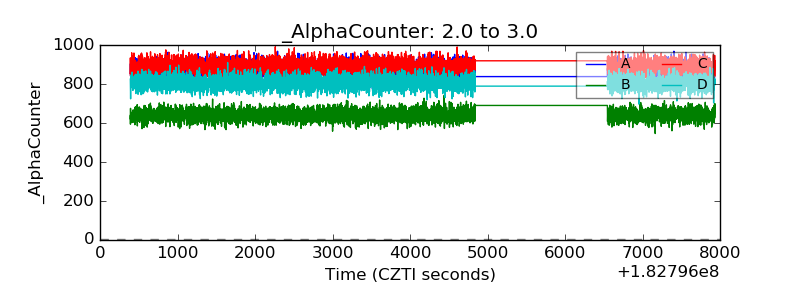 |
| _CPM_Rate | 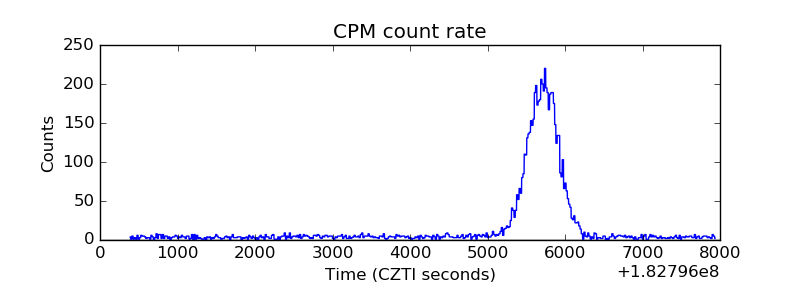 |
| CZT Counter | 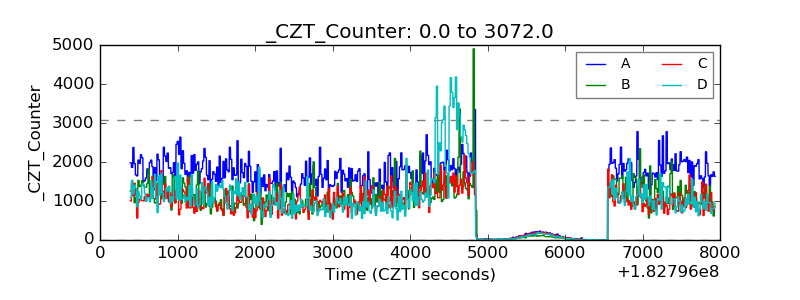 |
| +2.5 Volts monitor |  |
| +5 Volts monitor |  |
| _ROLL_ROT | 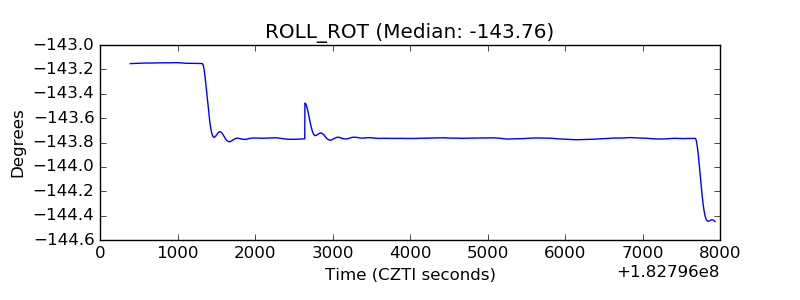 |
| _Roll_DEC | 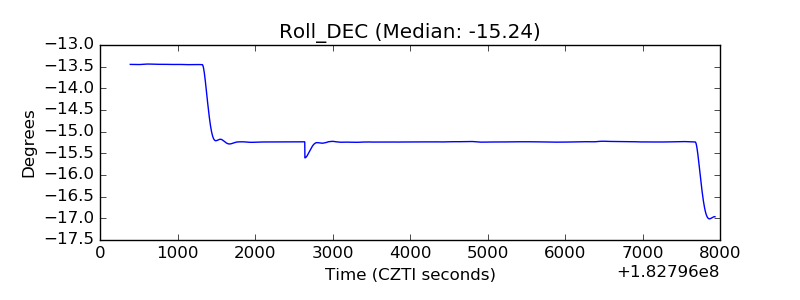 |
| _Roll_RA |  |
| Veto Counter | 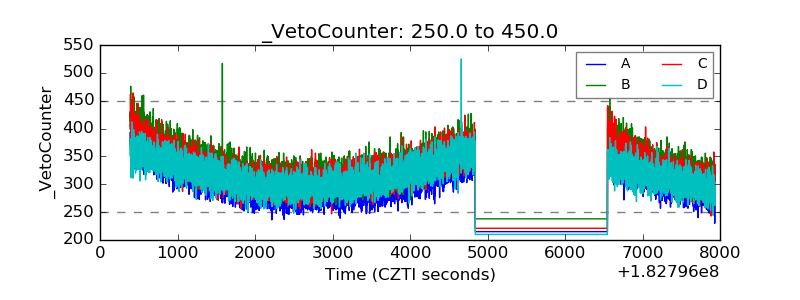 |