| Param | Original file | Final file |
|---|---|---|
| Filename | modeM0/AS1P01_126T04_9000000036_00297cztM0_level2.evt | modeM0/AS1P01_126T04_9000000036_00297cztM0_level2_quad_clean.evt |
| Size (bytes) | 683,683,200 | 32,503,680 |
| Size | 652.0 MB | 31.0 MB |
| Events in quadrant A | 5,112,899 | 173,174 |
| Events in quadrant B | 5,203,702 | 177,187 |
| Events in quadrant C | 5,515,757 | 173,950 |
| Events in quadrant D | 4,600,397 | 170,191 |
| Mode M9 | |||
|---|---|---|---|
| Quadrant | BADHDUFLAG | Total packets | Discarded packets |
| A | 0 | 17 | 0 |
| B | 0 | 17 | 0 |
| C | 0 | 17 | 0 |
| D | 0 | 17 | 0 |
| Mode SS | |||
|---|---|---|---|
| Quadrant | BADHDUFLAG | Total packets | Discarded packets |
| A | 0 | 84 | 0 |
| B | 0 | 84 | 0 |
| C | 0 | 84 | 0 |
| D | 0 | 84 | 0 |
| Mode M0 | |||
|---|---|---|---|
| Quadrant | BADHDUFLAG | Total packets | Discarded packets |
| A | 0 | 18102 | 2 |
| B | 0 | 18376 | 1 |
| C | 0 | 19304 | 1 |
| D | 0 | 16608 | 1 |
| Quadrant | Total seconds | Saturated seconds | Saturation percentage |
|---|---|---|---|
| A | 4098 | 6 | 0.146413% |
| B | 4098 | 34 | 0.829673% |
| C | 4098 | 41 | 1.000488% |
| D | 4098 | 5 | 0.122011% |
Noise dominated data is calculated using 1-second bins in cleaned event files. If a bin has >2000 counts, and if more than 50% of those come from <1% of pixels, then it is considered to be noise-dominated and hence unusable.
| Quadrant | # 1 sec bins | Bins with >0 counts | Bins with >2000 counts | High rate bins dominated by noise | Noise dominated (total time) | Noise dominated (detector-on time) | Marked lightcurve |
|---|---|---|---|---|---|---|---|
| A | 5833 | 4099 | 117 | 117 | 2.01% | 2.85% | 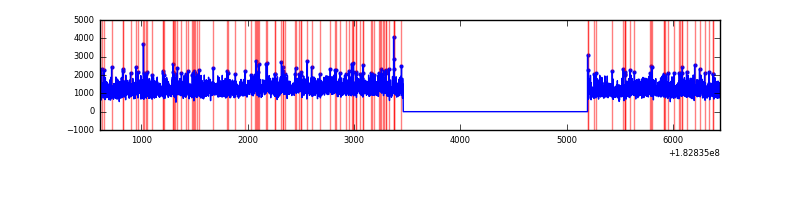 |
| B | 5833 | 4099 | 134 | 134 | 2.30% | 3.27% | 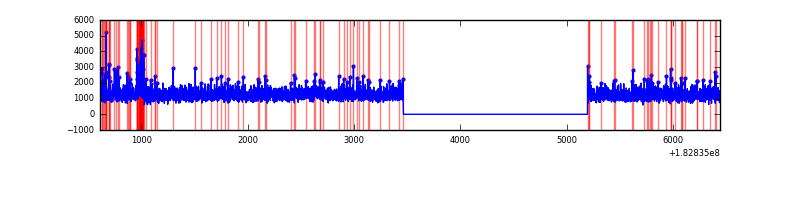 |
| C | 5833 | 4099 | 202 | 202 | 3.46% | 4.93% | 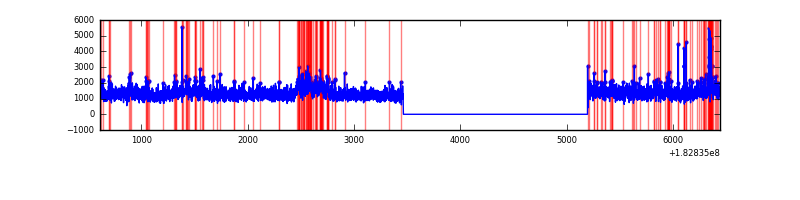 |
| D | 5833 | 4099 | 45 | 45 | 0.77% | 1.10% | 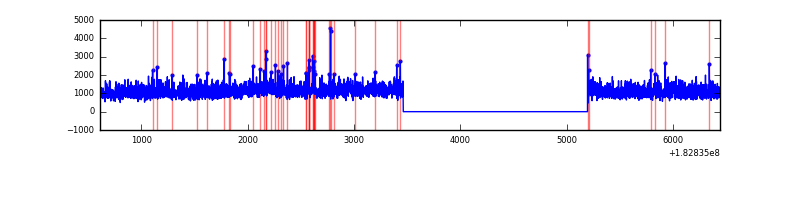 |
Top three noisy pixels from each quadrant. If the there are fewer than three noisy pixels in the level2.evt file, extra rows are filled as -1
| Pixel properties | Quadrant properties | ||||||
|---|---|---|---|---|---|---|---|
| Quadrant | DetID | PixID | Counts | Sigma | Mean | Median | Sigma |
| A | 0 | 6 | 33364 | 108.34 | 1305 | 1288 | 296.1 |
| A | 13 | 17 | 11160 | 33.34 | 1305 | 1288 | 296.1 |
| A | 5 | 243 | 10618 | 31.51 | 1305 | 1288 | 296.1 |
| B | 5 | 46 | 183327 | 590.97 | 1295 | 1302 | 308.0 |
| B | 0 | 183 | 40248 | 126.44 | 1295 | 1302 | 308.0 |
| B | 0 | 182 | 12206 | 35.4 | 1295 | 1302 | 308.0 |
| C | 1 | 1 | 694093 | 2095.13 | 1166 | 1203 | 330.7 |
| C | 2 | 192 | 214006 | 643.46 | 1166 | 1203 | 330.7 |
| C | 7 | 223 | 25402 | 73.17 | 1166 | 1203 | 330.7 |
| D | 13 | 216 | 88757 | 243.67 | 1137 | 1180 | 359.4 |
| D | 1 | 5 | 74182 | 203.12 | 1137 | 1180 | 359.4 |
| D | 7 | 85 | 22123 | 58.27 | 1137 | 1180 | 359.4 |
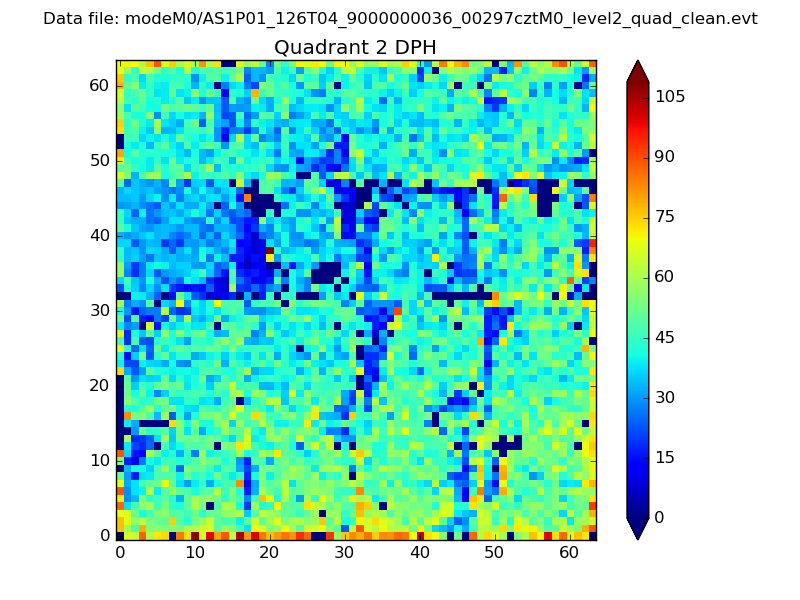
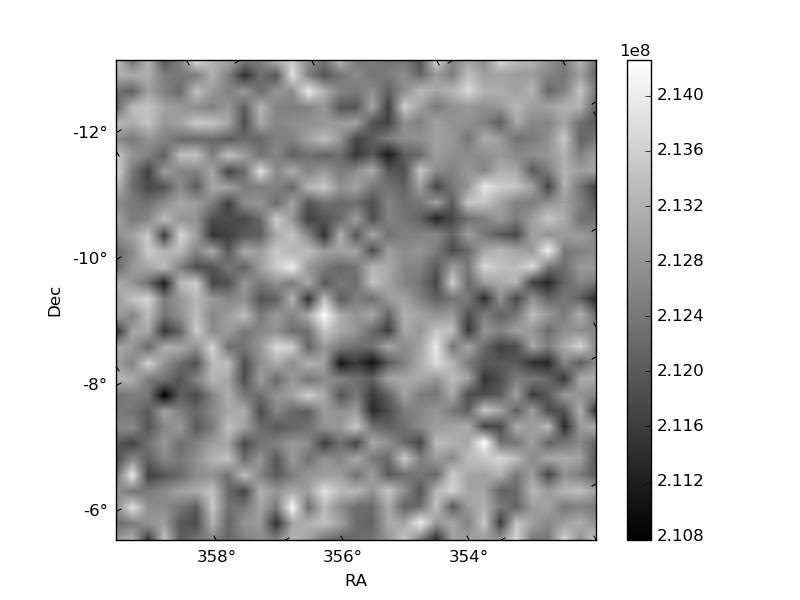
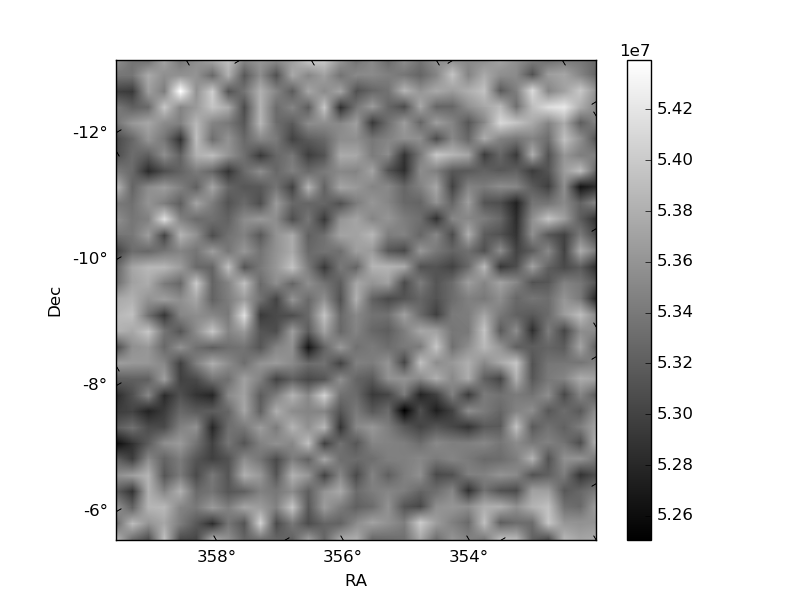
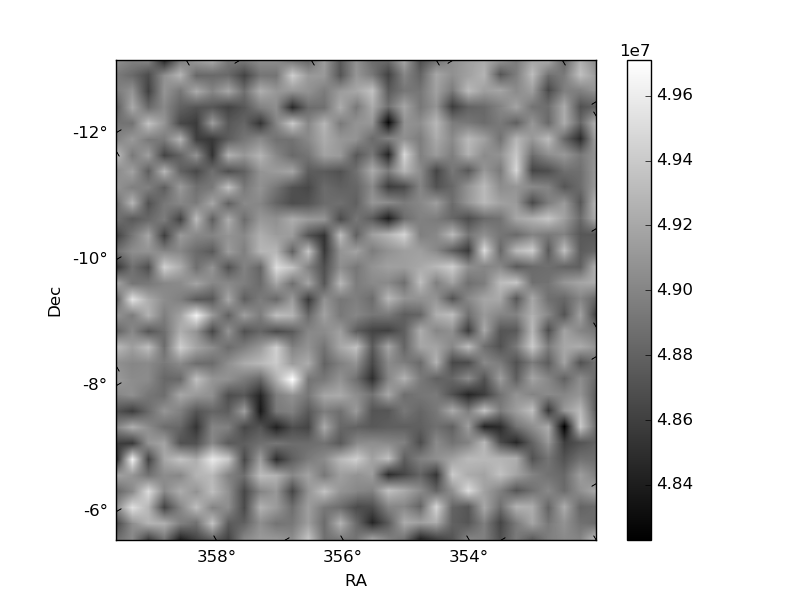
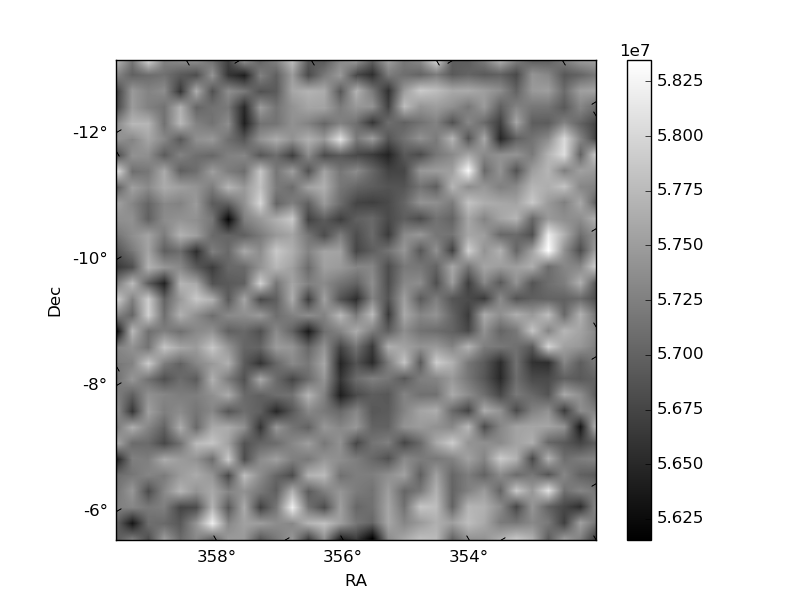
Histogram calculated using DETX and DETY for each event in the final _common_clean file
| Quadrant A | 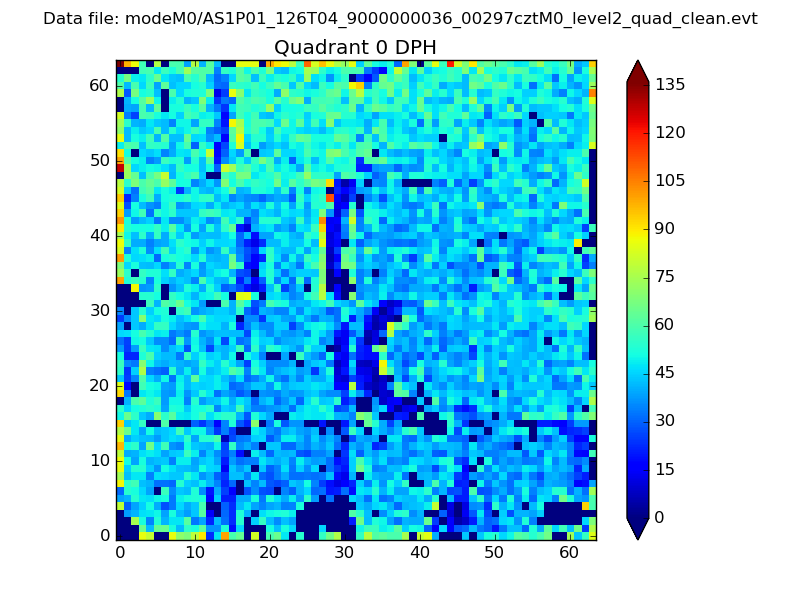 |
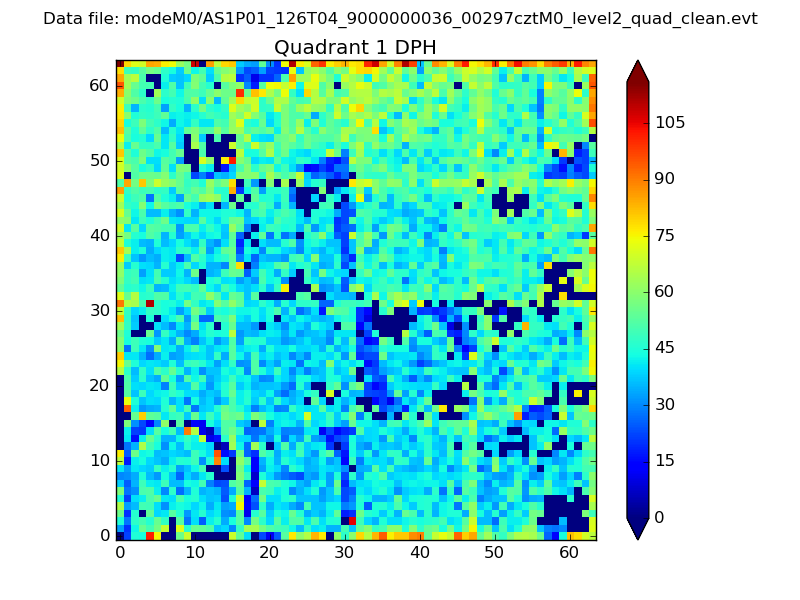 |
Quadrant B |
|---|---|---|---|
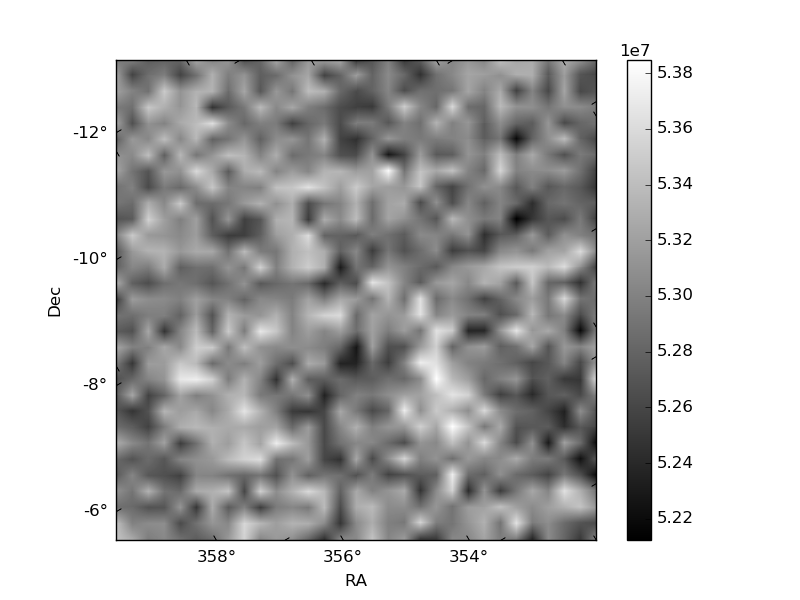
| Quadrant D | 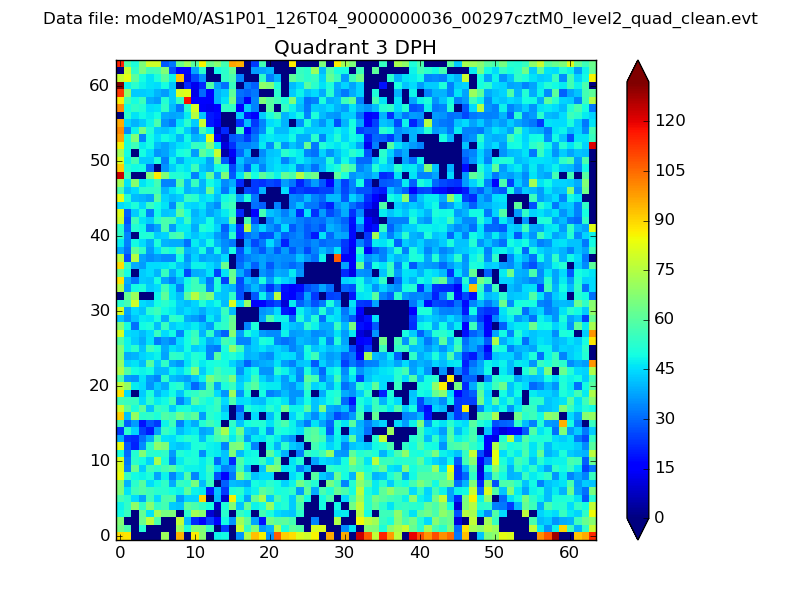 |
 |
Quadrant C |
| Plot type | Count rate plots | Images |
|---|---|---|
| Comparison with Poisson distribution Blue bars denote a histogram of data divided into 1 sec bins. Red curve is a Poisson curve with rate = median count rate of data. |
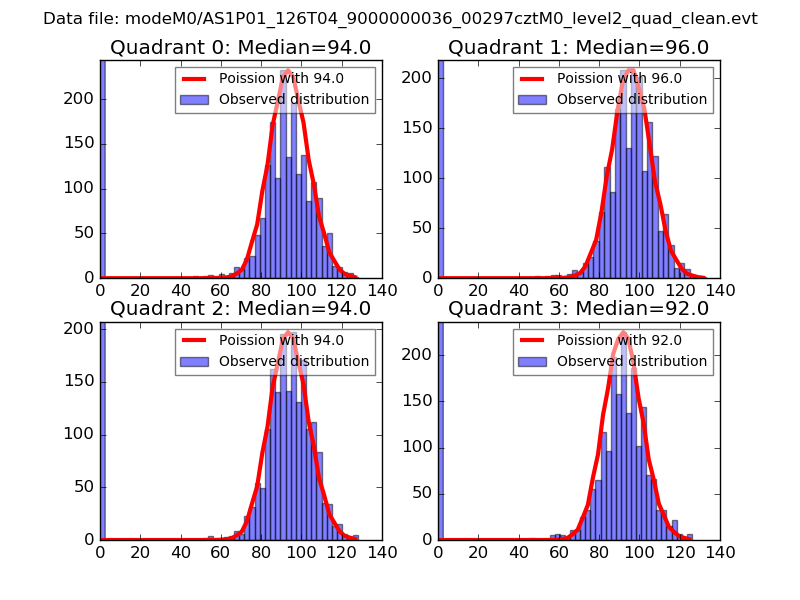 |
 |
| Quadrant-wise count rates Data is divided into 100 sec bins |
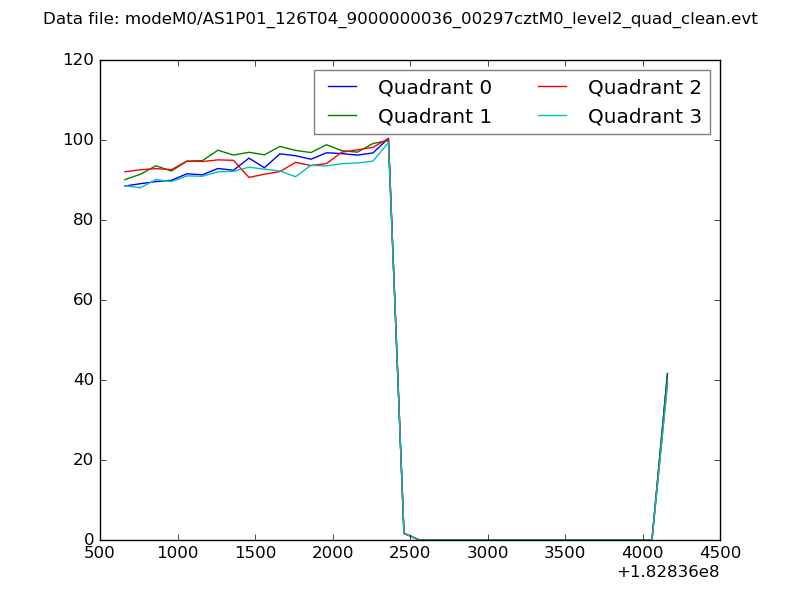 |
|
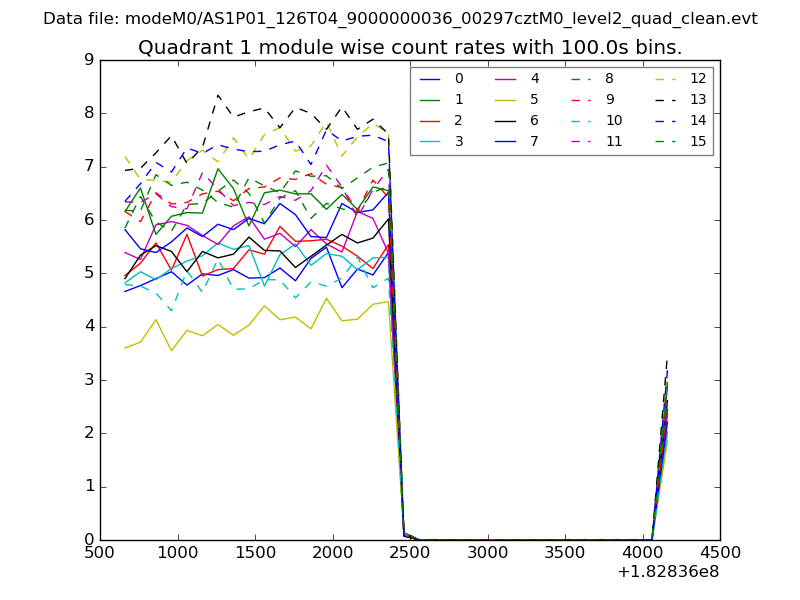
| Module-wise count rates for Quadrant A Data is divided into 100 sec bins |
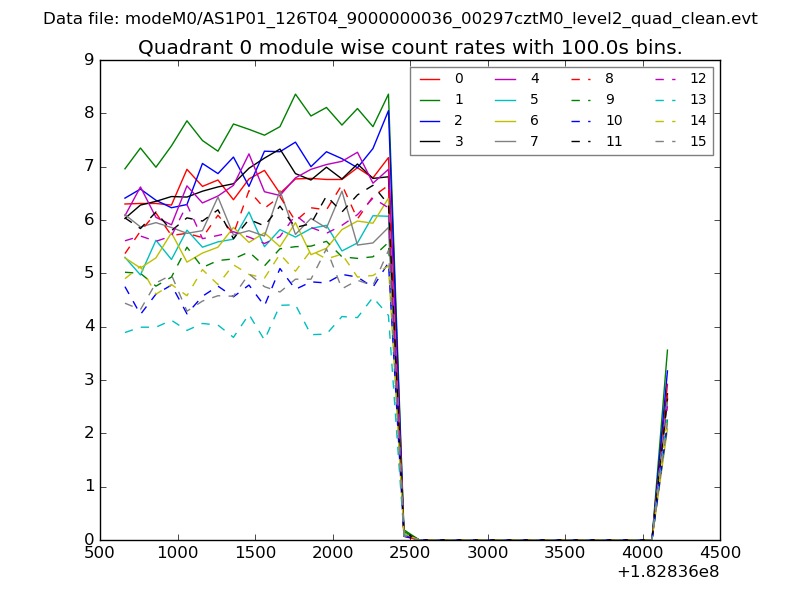 |
 |
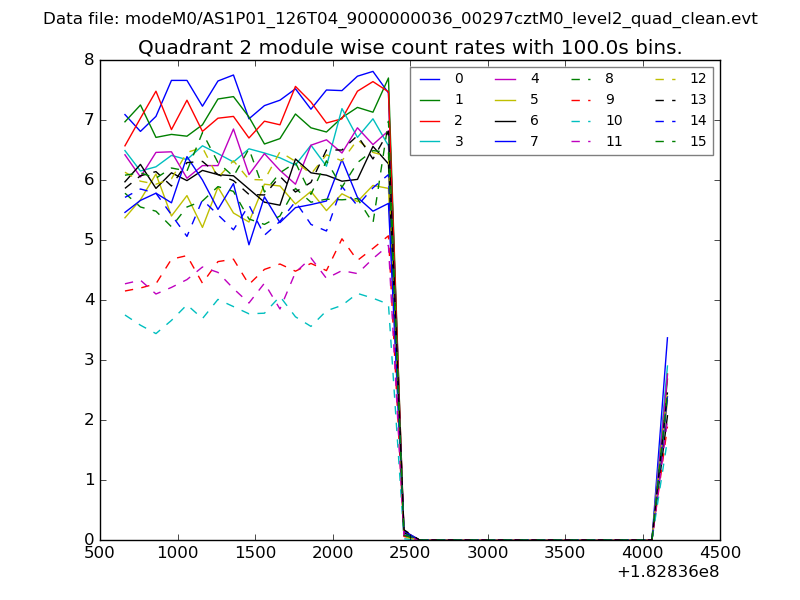
| Module-wise count rates for Quadrant B Data is divided into 100 sec bins |
 |
 |
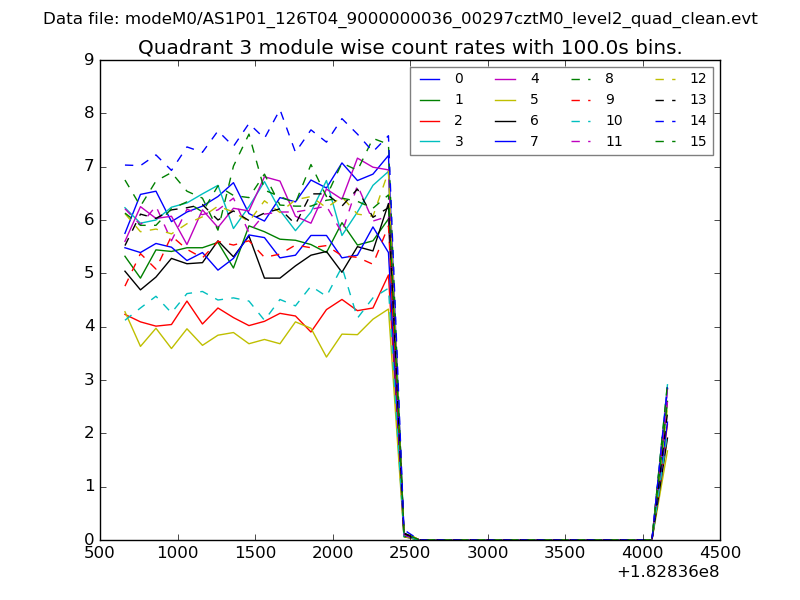
| Module-wise count rates for Quadrant C Data is divided into 100 sec bins |
 |
 |
| Module-wise count rates for Quadrant D Data is divided into 100 sec bins |
 |
 |
| Parameter | Plot |
|---|---|
| CZT HV Monitor | 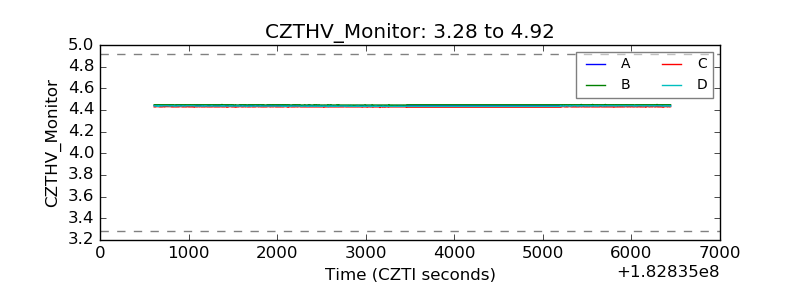 |
| D_VDD | 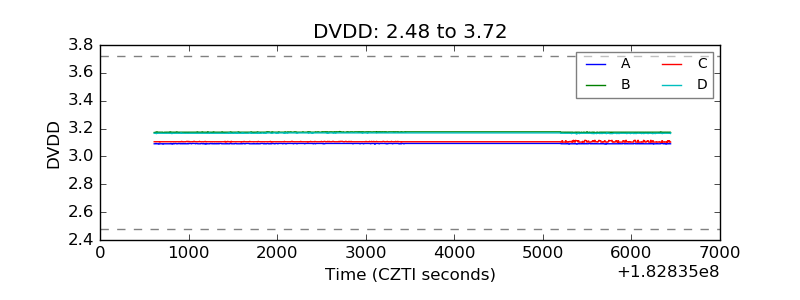 |
| Temperature 1 | 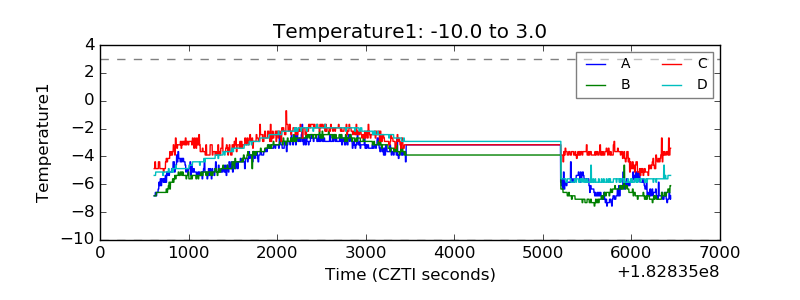 |
| Veto HV Monitor | 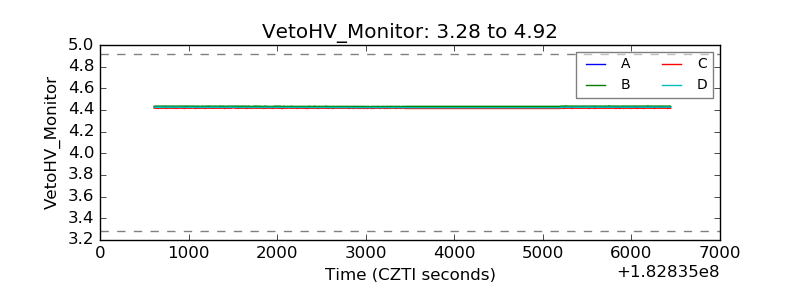 |
| Veto LLD | 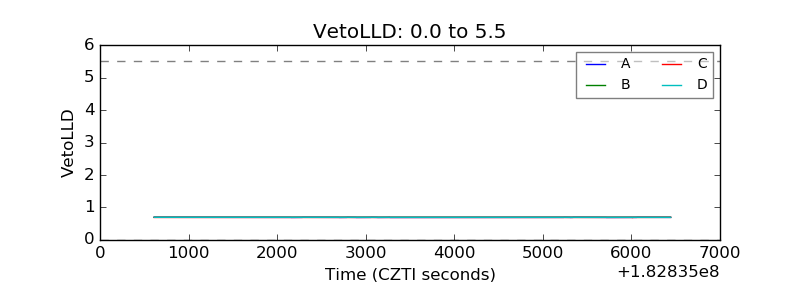 |
| Alpha Counter | 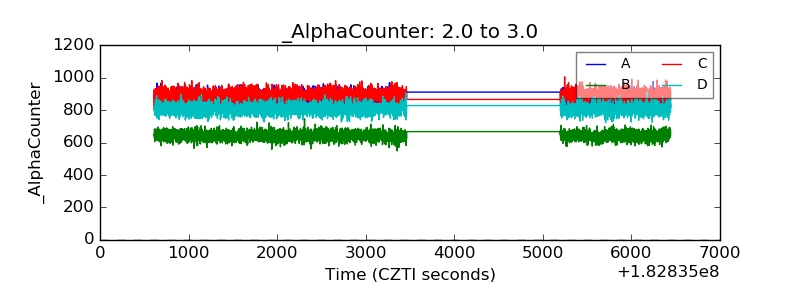 |
| _CPM_Rate | 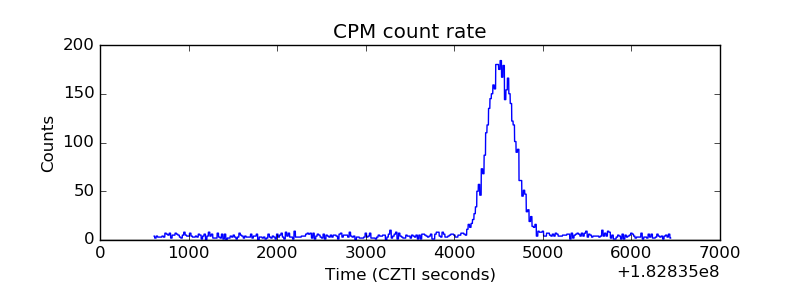 |
| CZT Counter | 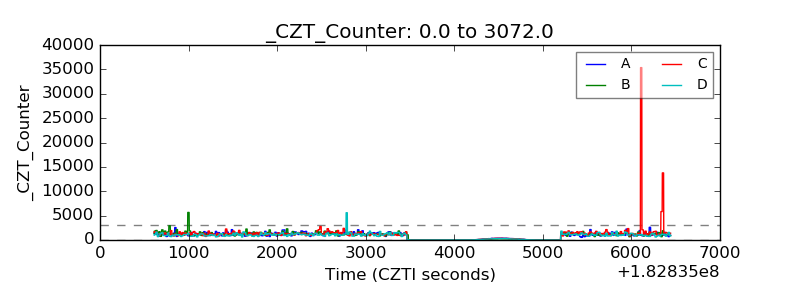 |
| +2.5 Volts monitor |  |
| +5 Volts monitor |  |
| _ROLL_ROT | 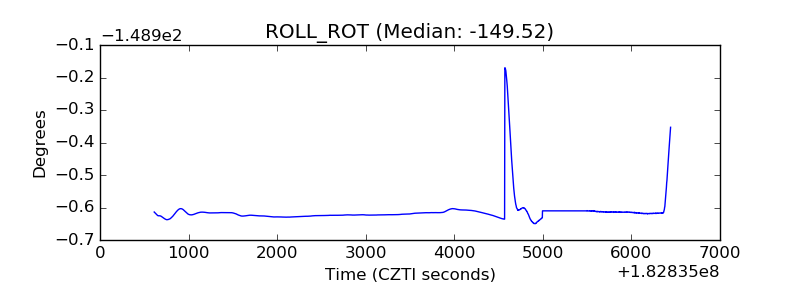 |
| _Roll_DEC | 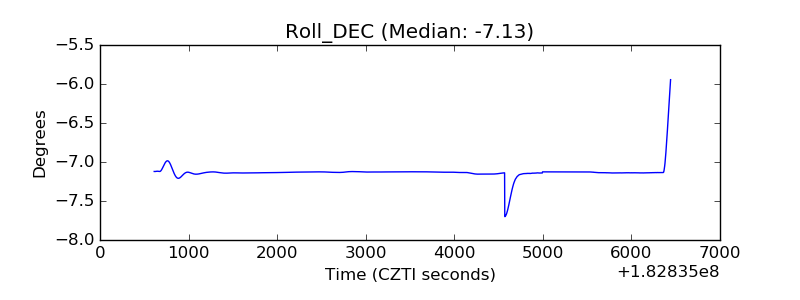 |
| _Roll_RA | 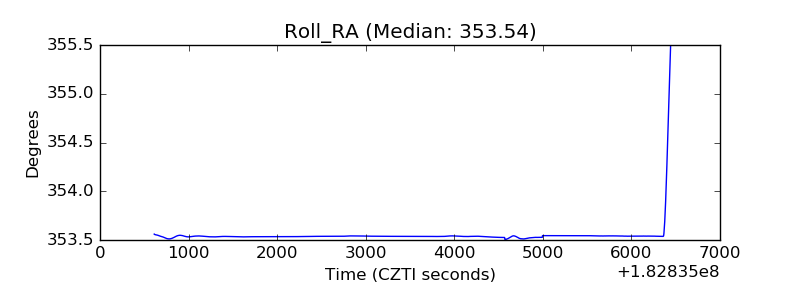 |
| Veto Counter | 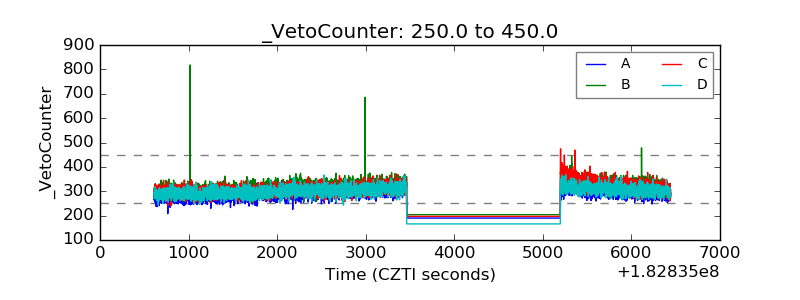 |