| Param | Original file | Final file |
|---|---|---|
| Filename | modeM0/AS1P01_126T04_9000000036_00298cztM0_level2.evt | modeM0/AS1P01_126T04_9000000036_00298cztM0_level2_quad_clean.evt |
| Size (bytes) | 955,440,000 | 13,596,480 |
| Size | 911.2 MB | 13.0 MB |
| Events in quadrant A | 6,917,660 | 3,898 |
| Events in quadrant B | 7,103,814 | 3,917 |
| Events in quadrant C | 8,246,317 | 3,641 |
| Events in quadrant D | 6,293,158 | 3,646 |
| Mode M9 | |||
|---|---|---|---|
| Quadrant | BADHDUFLAG | Total packets | Discarded packets |
| A | 0 | 18 | 0 |
| B | 0 | 18 | 0 |
| C | 0 | 18 | 0 |
| D | 0 | 18 | 0 |
| Mode SS | |||
|---|---|---|---|
| Quadrant | BADHDUFLAG | Total packets | Discarded packets |
| A | 0 | 114 | 0 |
| B | 0 | 114 | 0 |
| C | 0 | 114 | 0 |
| D | 0 | 114 | 0 |
| Mode M0 | |||
|---|---|---|---|
| Quadrant | BADHDUFLAG | Total packets | Discarded packets |
| A | 0 | 24583 | 3 |
| B | 0 | 25127 | 2 |
| C | 0 | 28502 | 2 |
| D | 0 | 22723 | 2 |
| Quadrant | Total seconds | Saturated seconds | Saturation percentage |
|---|---|---|---|
| A | 5656 | 3 | 0.053041% |
| B | 5656 | 4 | 0.070721% |
| C | 5656 | 150 | 2.652051% |
| D | 5656 | 4 | 0.070721% |
Noise dominated data is calculated using 1-second bins in cleaned event files. If a bin has >2000 counts, and if more than 50% of those come from <1% of pixels, then it is considered to be noise-dominated and hence unusable.
| Quadrant | # 1 sec bins | Bins with >0 counts | Bins with >2000 counts | High rate bins dominated by noise | Noise dominated (total time) | Noise dominated (detector-on time) | Marked lightcurve |
|---|---|---|---|---|---|---|---|
| A | 7392 | 5657 | 131 | 131 | 1.77% | 2.32% | 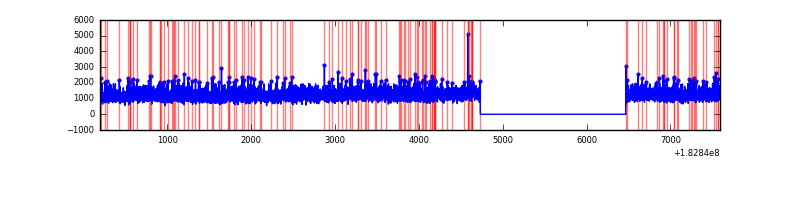 |
| B | 7392 | 5657 | 149 | 149 | 2.02% | 2.63% | 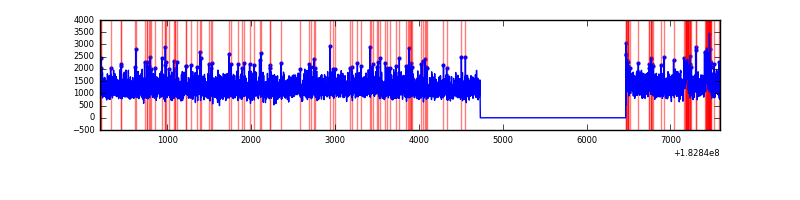 |
| C | 7392 | 5657 | 612 | 612 | 8.28% | 10.82% | 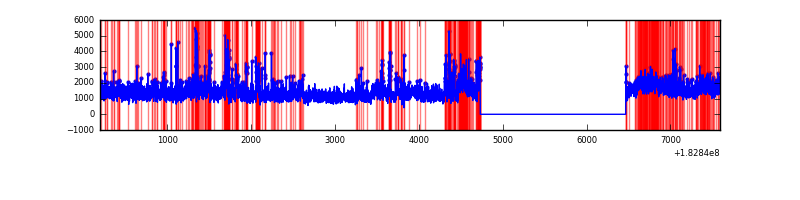 |
| D | 7392 | 5657 | 71 | 71 | 0.96% | 1.26% | 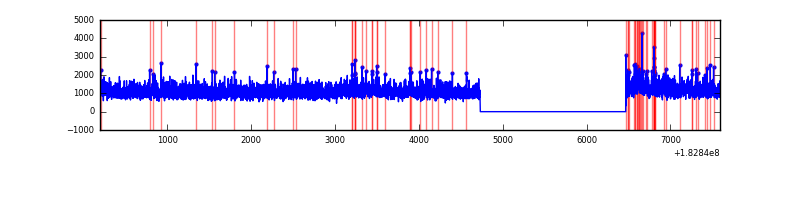 |
Top three noisy pixels from each quadrant. If the there are fewer than three noisy pixels in the level2.evt file, extra rows are filled as -1
| Pixel properties | Quadrant properties | ||||||
|---|---|---|---|---|---|---|---|
| Quadrant | DetID | PixID | Counts | Sigma | Mean | Median | Sigma |
| A | 5 | 243 | 42973 | 105.09 | 1766 | 1748 | 392.3 |
| A | 0 | 6 | 25591 | 60.78 | 1766 | 1748 | 392.3 |
| A | 13 | 17 | 8536 | 17.3 | 1766 | 1748 | 392.3 |
| B | 0 | 183 | 82934 | 189.89 | 1800 | 1805 | 427.2 |
| B | 8 | 6 | 82807 | 189.59 | 1800 | 1805 | 427.2 |
| B | 5 | 46 | 44211 | 99.25 | 1800 | 1805 | 427.2 |
| C | 2 | 192 | 860462 | 1885.8 | 1611 | 1662 | 455.4 |
| C | 1 | 1 | 837276 | 1834.89 | 1611 | 1662 | 455.4 |
| C | 3 | 159 | 82349 | 177.18 | 1611 | 1662 | 455.4 |
| D | 13 | 216 | 202427 | 410.3 | 1553 | 1619 | 489.4 |
| D | 1 | 5 | 72391 | 144.6 | 1553 | 1619 | 489.4 |
| D | 12 | 237 | 23241 | 44.18 | 1553 | 1619 | 489.4 |
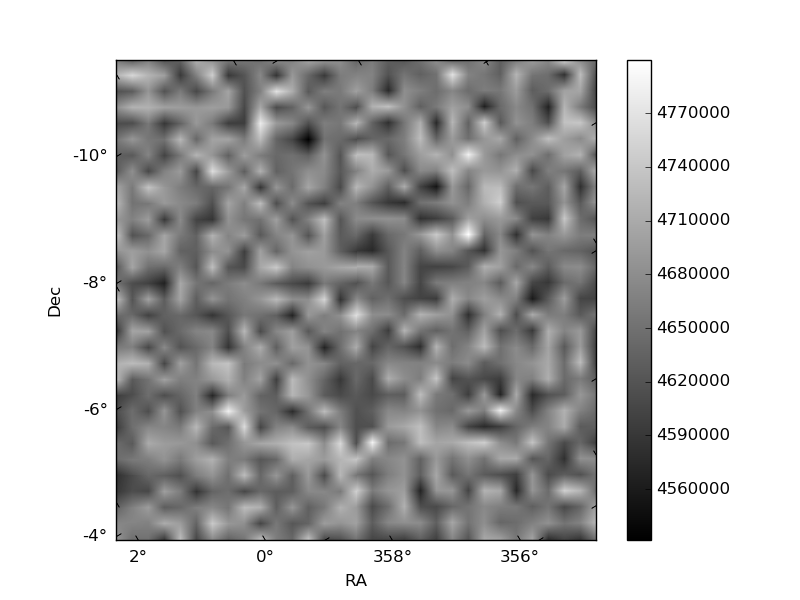
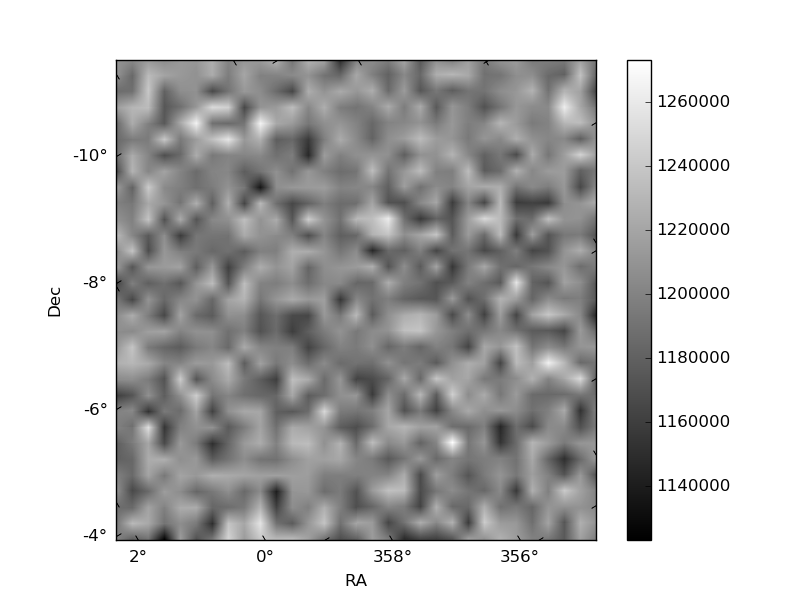
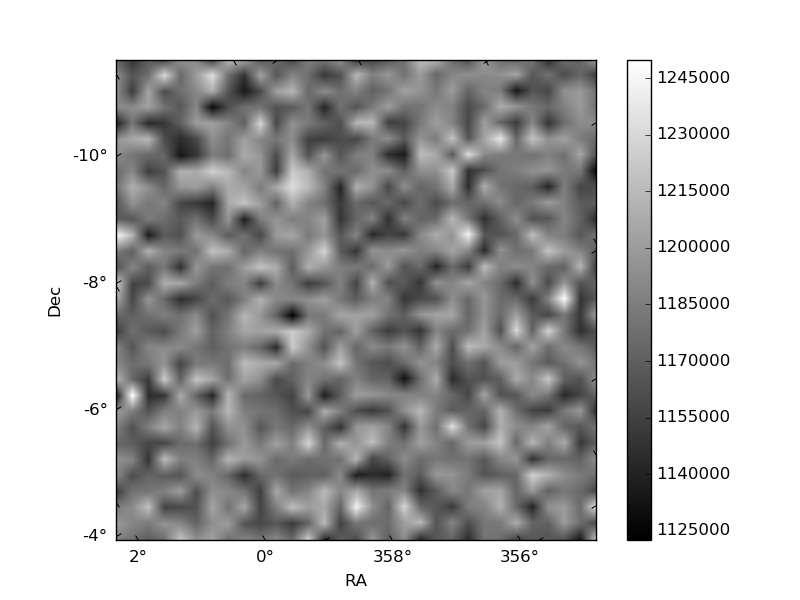
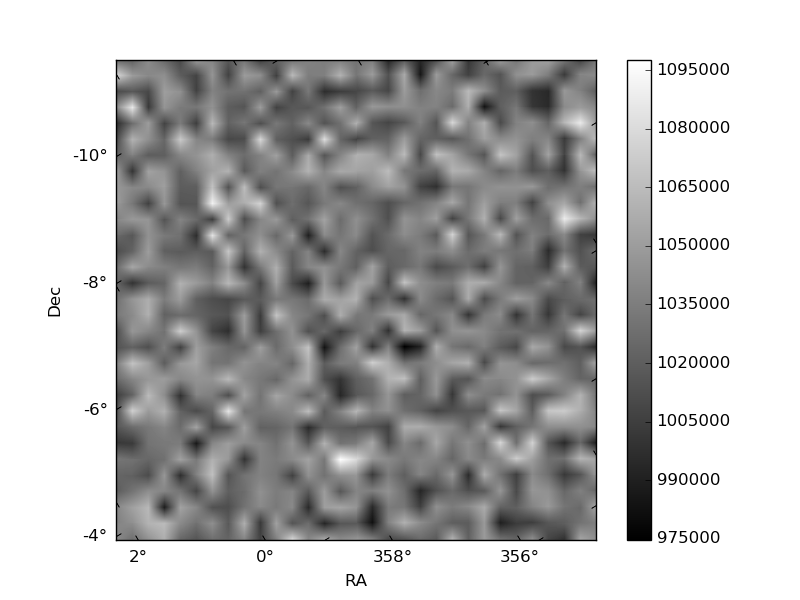
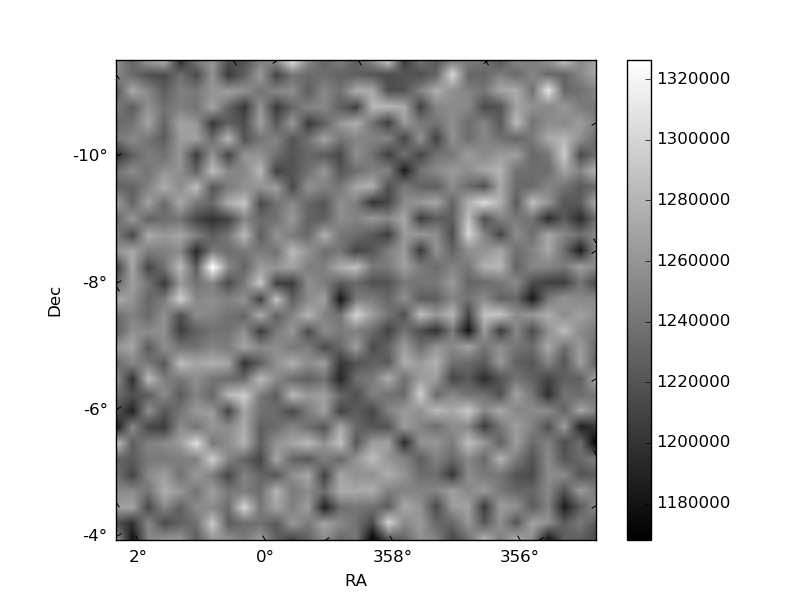
Histogram calculated using DETX and DETY for each event in the final _common_clean file
| Quadrant A | 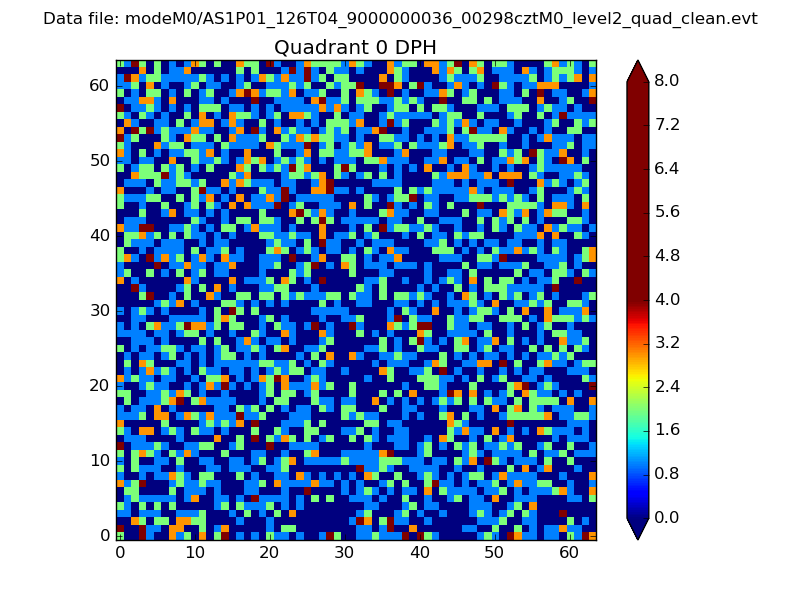 |
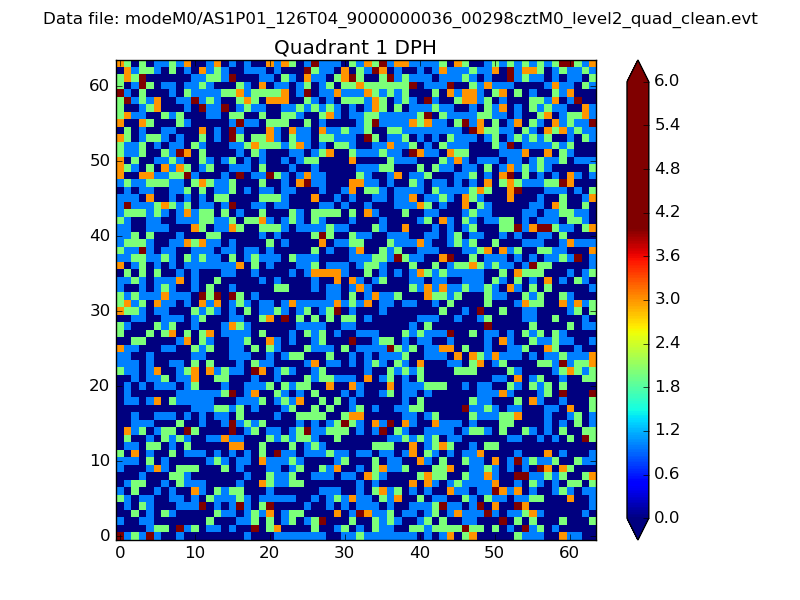 |
Quadrant B |
|---|---|---|---|
| Quadrant D | 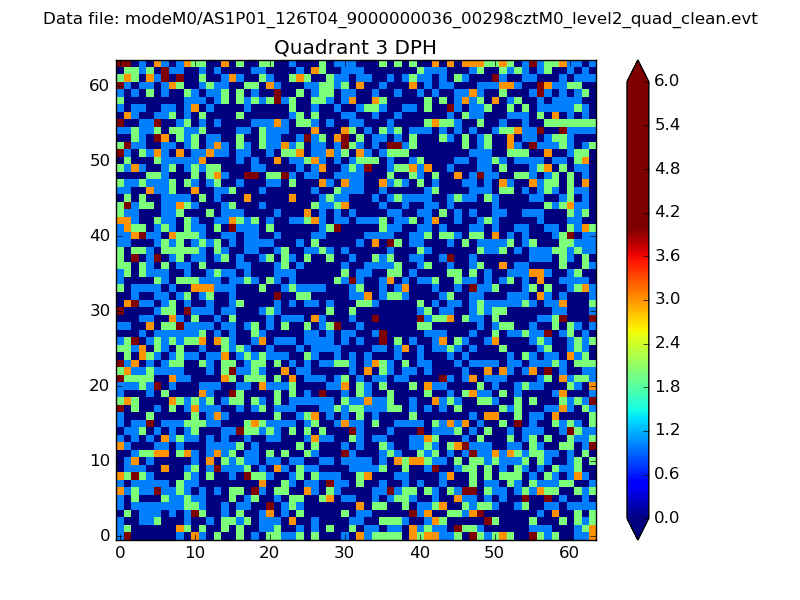 |
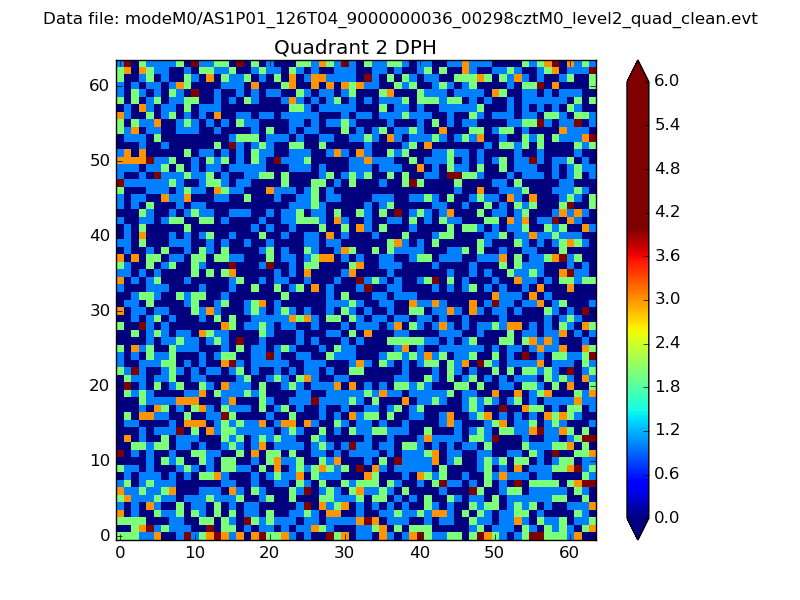 |
Quadrant C |
| Plot type | Count rate plots | Images |
|---|---|---|
| Comparison with Poisson distribution Blue bars denote a histogram of data divided into 1 sec bins. Red curve is a Poisson curve with rate = median count rate of data. |
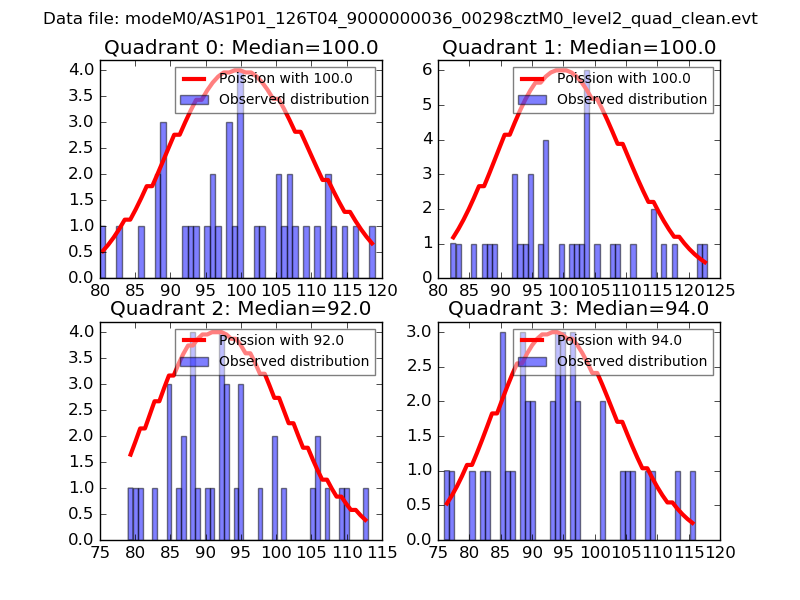 |
 |
| Quadrant-wise count rates Data is divided into 100 sec bins |
 |
|
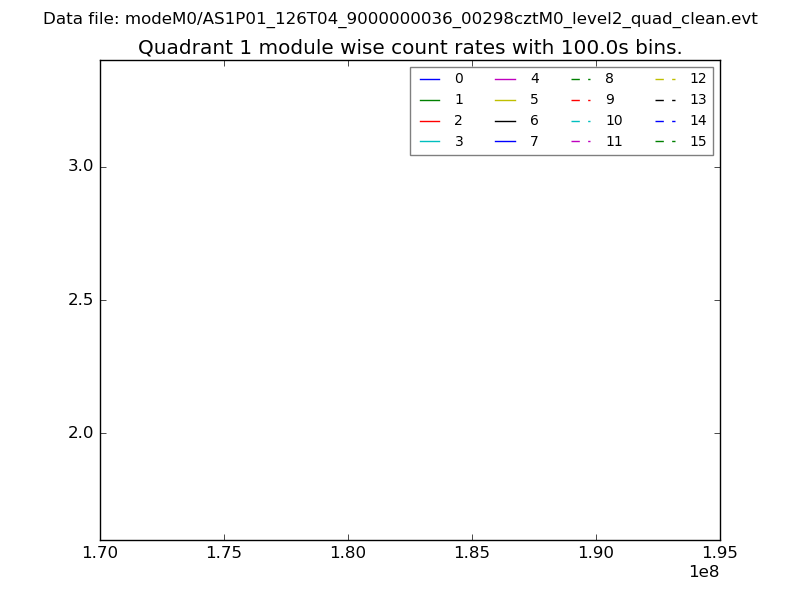
| Module-wise count rates for Quadrant A Data is divided into 100 sec bins |
 |
 |
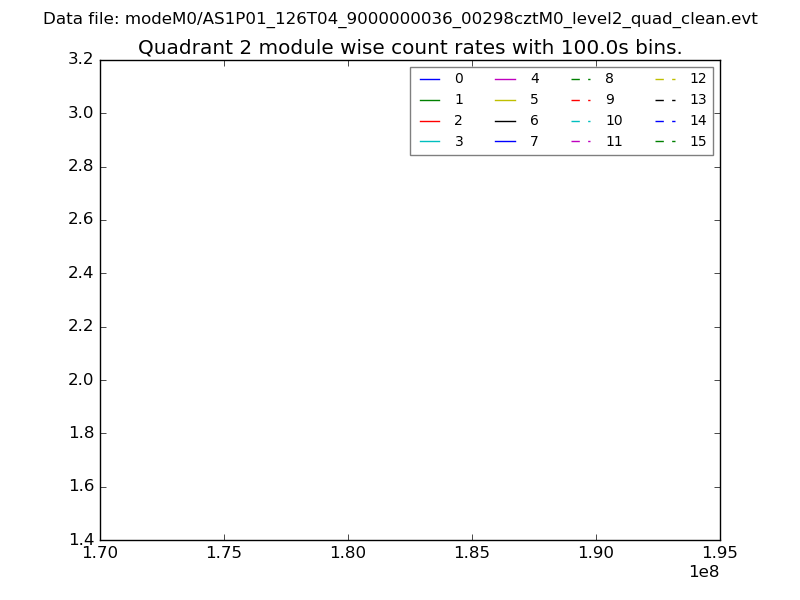
| Module-wise count rates for Quadrant B Data is divided into 100 sec bins |
 |
 |
| Module-wise count rates for Quadrant C Data is divided into 100 sec bins |
 |
 |
| Module-wise count rates for Quadrant D Data is divided into 100 sec bins |
 |
 |
| Parameter | Plot |
|---|---|
| CZT HV Monitor | 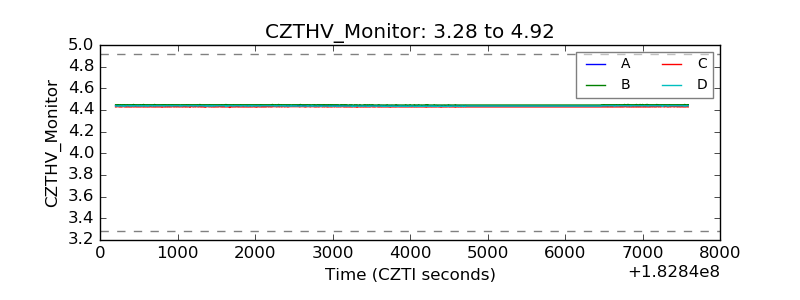 |
| D_VDD | 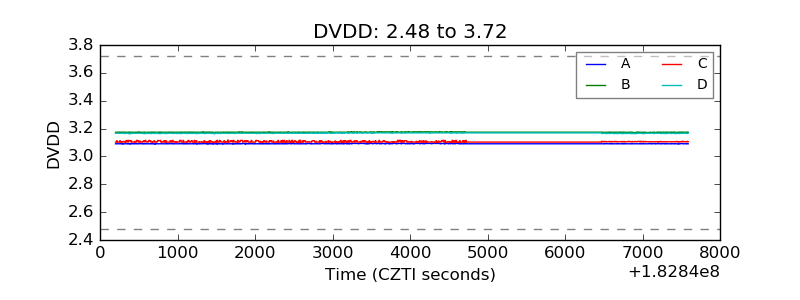 |
| Temperature 1 | 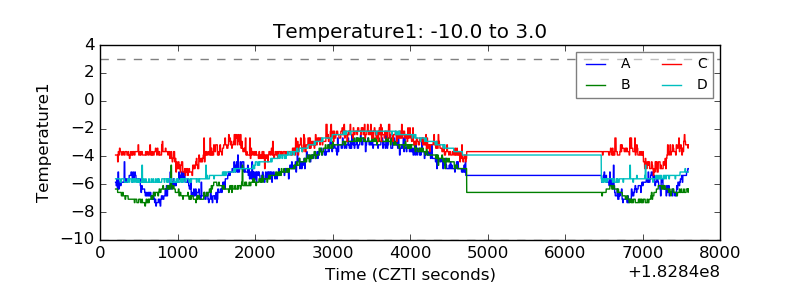 |
| Veto HV Monitor | 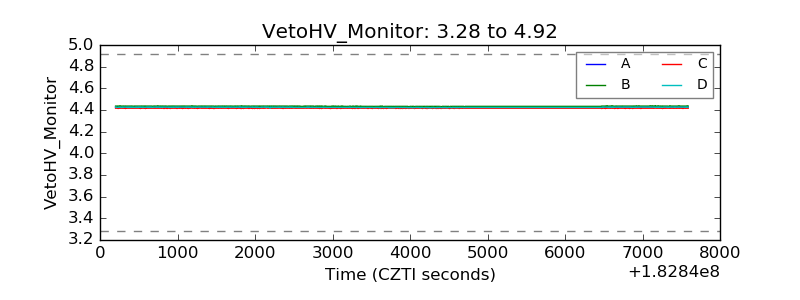 |
| Veto LLD | 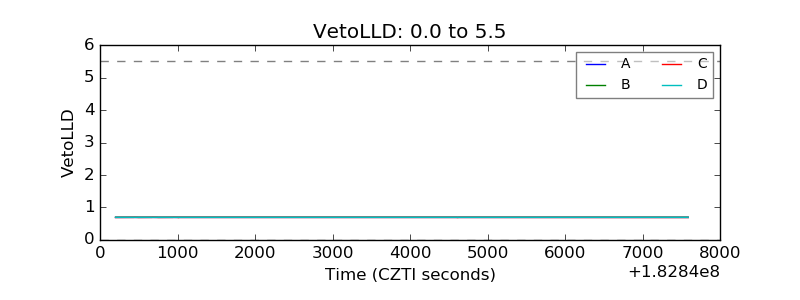 |
| Alpha Counter | 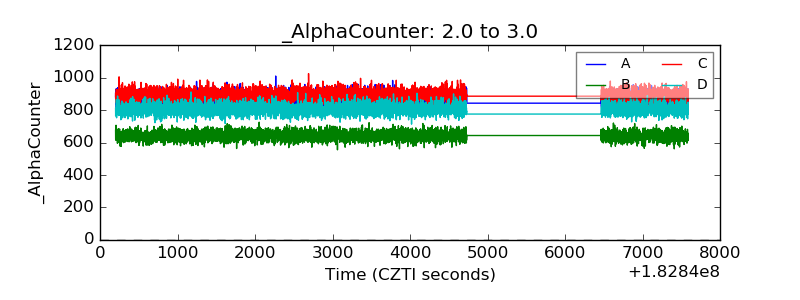 |
| _CPM_Rate | 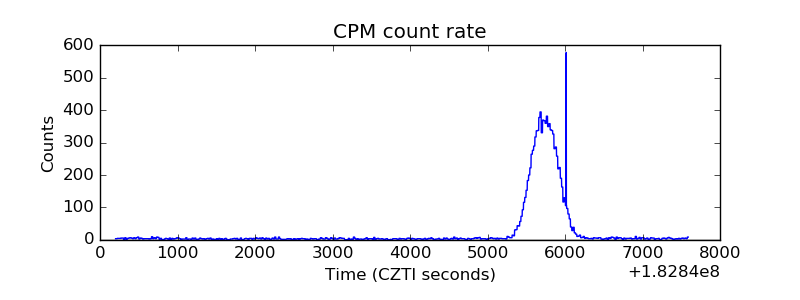 |
| CZT Counter | 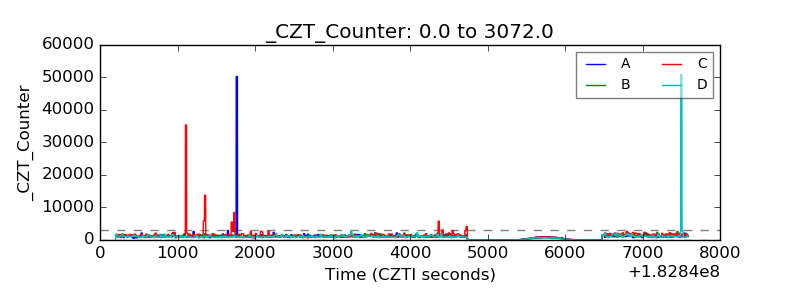 |
| +2.5 Volts monitor |  |
| +5 Volts monitor |  |
| _ROLL_ROT | 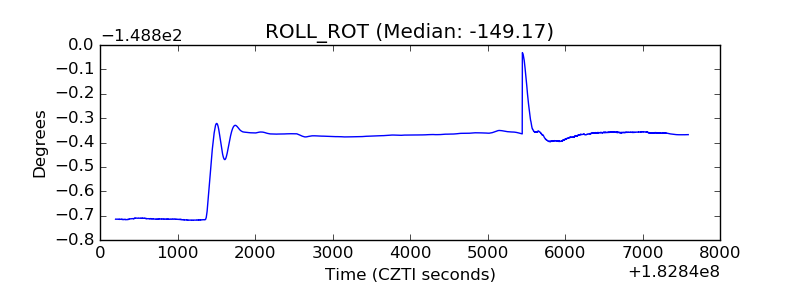 |
| _Roll_DEC |  |
| _Roll_RA | 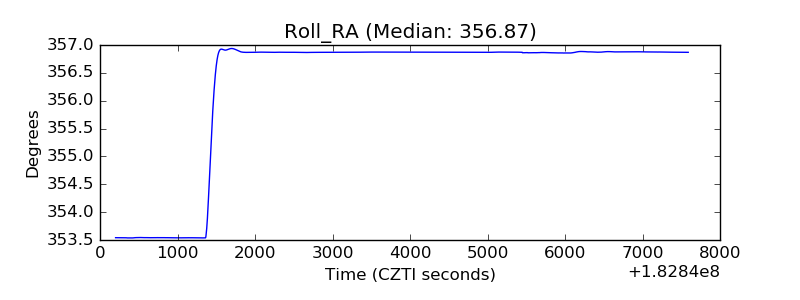 |
| Veto Counter | 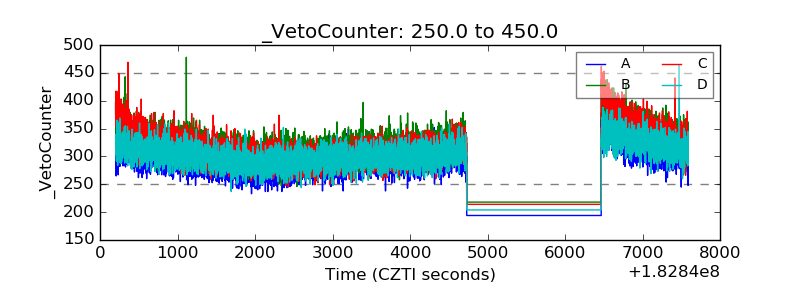 |