| Param | Original file | Final file |
|---|---|---|
| Filename | modeM0/AS1P01_126T04_9000000036_00303cztM0_level2.evt | modeM0/AS1P01_126T04_9000000036_00303cztM0_level2_quad_clean.evt |
| Size (bytes) | 891,288,000 | 64,915,200 |
| Size | 850.0 MB | 61.9 MB |
| Events in quadrant A | 7,103,336 | 394,045 |
| Events in quadrant B | 6,929,616 | 402,038 |
| Events in quadrant C | 6,333,591 | 390,134 |
| Events in quadrant D | 6,250,980 | 384,176 |
| Mode M9 | |||
|---|---|---|---|
| Quadrant | BADHDUFLAG | Total packets | Discarded packets |
| A | 0 | 19 | 0 |
| B | 0 | 19 | 0 |
| C | 0 | 19 | 0 |
| D | 0 | 20 | 0 |
| Mode SS | |||
|---|---|---|---|
| Quadrant | BADHDUFLAG | Total packets | Discarded packets |
| A | 0 | 116 | 0 |
| B | 0 | 116 | 0 |
| C | 0 | 116 | 0 |
| D | 0 | 116 | 0 |
| Mode M0 | |||
|---|---|---|---|
| Quadrant | BADHDUFLAG | Total packets | Discarded packets |
| A | 0 | 25095 | 3 |
| B | 0 | 24625 | 2 |
| C | 0 | 22856 | 2 |
| D | 0 | 22606 | 2 |
| Quadrant | Total seconds | Saturated seconds | Saturation percentage |
|---|---|---|---|
| A | 5644 | 6 | 0.106308% |
| B | 5644 | 3 | 0.053154% |
| C | 5644 | 3 | 0.053154% |
| D | 5644 | 3 | 0.053154% |
Noise dominated data is calculated using 1-second bins in cleaned event files. If a bin has >2000 counts, and if more than 50% of those come from <1% of pixels, then it is considered to be noise-dominated and hence unusable.
| Quadrant | # 1 sec bins | Bins with >0 counts | Bins with >2000 counts | High rate bins dominated by noise | Noise dominated (total time) | Noise dominated (detector-on time) | Marked lightcurve |
|---|---|---|---|---|---|---|---|
| A | 7349 | 5645 | 206 | 206 | 2.80% | 3.65% | 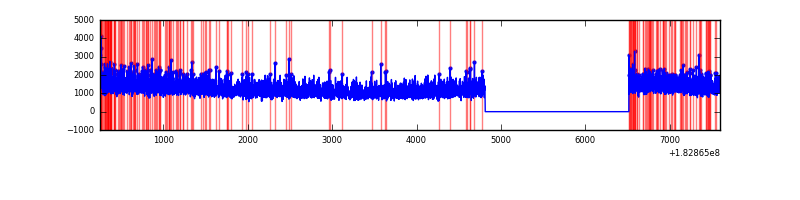 |
| B | 7349 | 5645 | 113 | 113 | 1.54% | 2.00% | 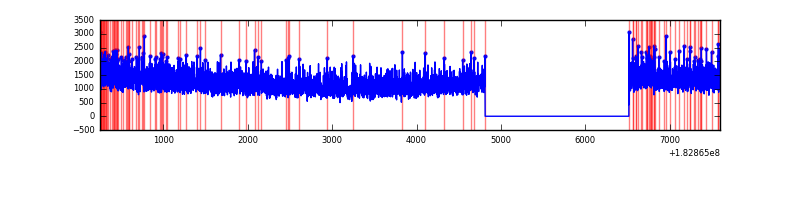 |
| C | 7349 | 5645 | 59 | 59 | 0.80% | 1.05% | 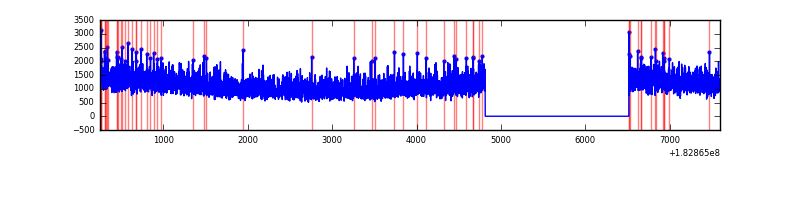 |
| D | 7349 | 5645 | 67 | 67 | 0.91% | 1.19% | 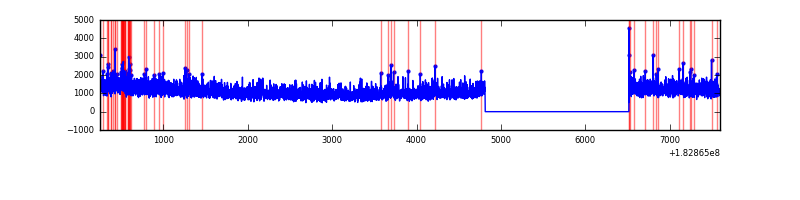 |
Top three noisy pixels from each quadrant. If the there are fewer than three noisy pixels in the level2.evt file, extra rows are filled as -1
| Pixel properties | Quadrant properties | ||||||
|---|---|---|---|---|---|---|---|
| Quadrant | DetID | PixID | Counts | Sigma | Mean | Median | Sigma |
| A | 15 | 127 | 83052 | 203.64 | 1801 | 1790 | 399.1 |
| A | 0 | 6 | 42681 | 102.47 | 1801 | 1790 | 399.1 |
| A | 11 | 242 | 8244 | 16.17 | 1801 | 1790 | 399.1 |
| B | 0 | 183 | 101981 | 239.79 | 1769 | 1778 | 417.9 |
| B | 0 | 85 | 32748 | 74.11 | 1769 | 1778 | 417.9 |
| B | 5 | 46 | 12302 | 25.18 | 1769 | 1778 | 417.9 |
| C | 2 | 192 | 57067 | 126.72 | 1576 | 1632 | 437.4 |
| C | 1 | 1 | 27645 | 59.47 | 1576 | 1632 | 437.4 |
| C | 9 | 68 | 17850 | 37.07 | 1576 | 1632 | 437.4 |
| D | 13 | 216 | 135237 | 273.41 | 1557 | 1624 | 488.7 |
| D | 7 | 85 | 33291 | 64.8 | 1557 | 1624 | 488.7 |
| D | 10 | 167 | 26065 | 50.01 | 1557 | 1624 | 488.7 |
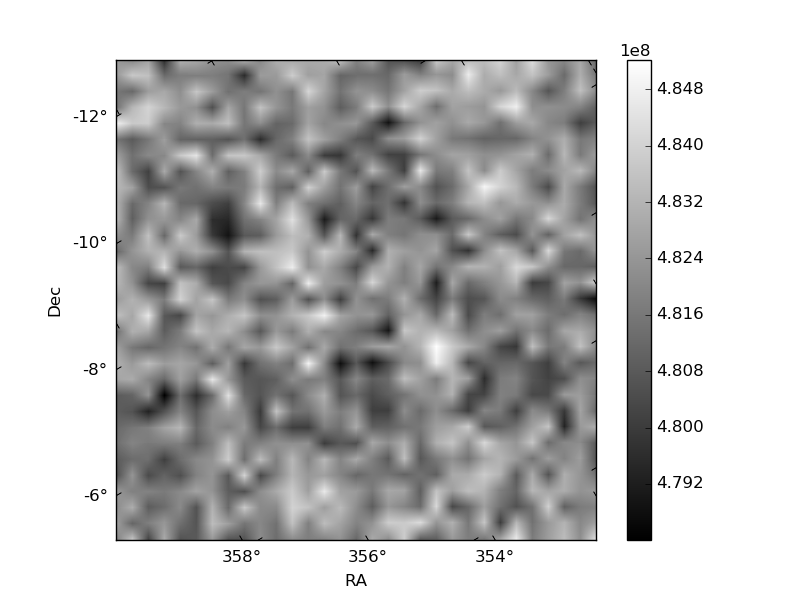
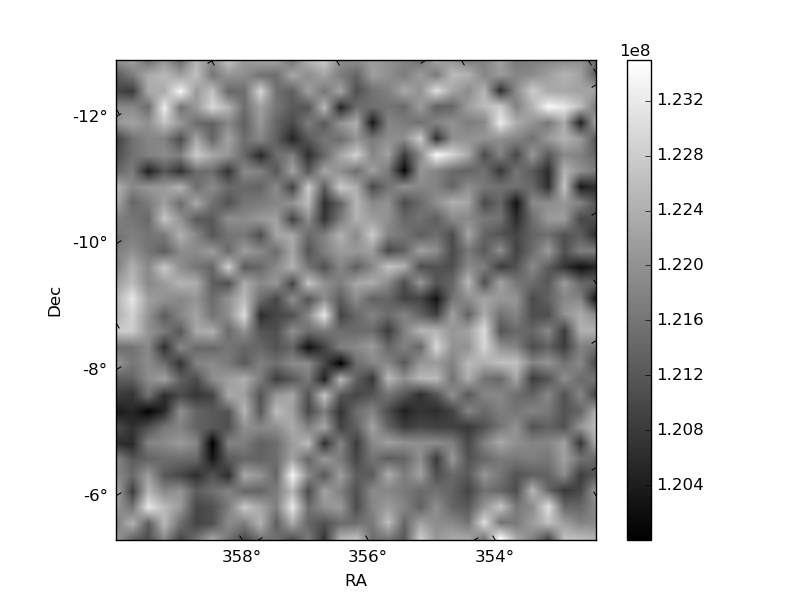
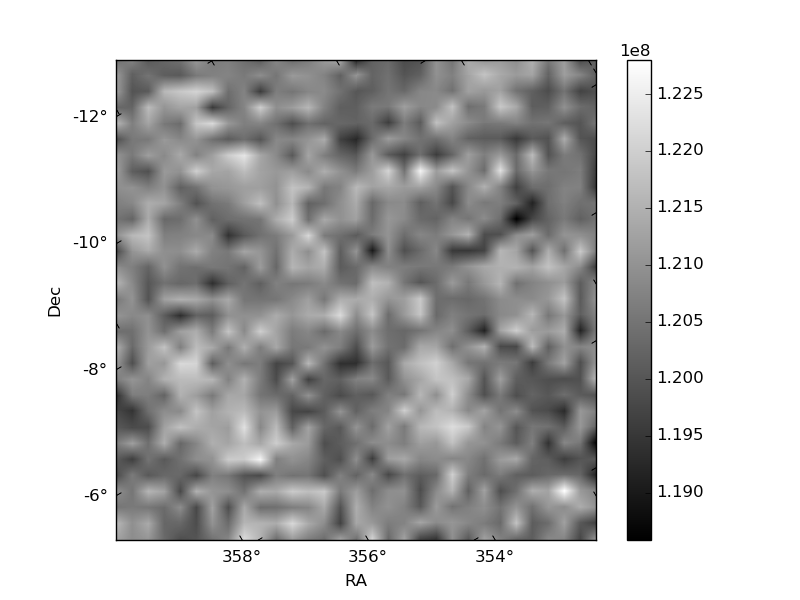
Histogram calculated using DETX and DETY for each event in the final _common_clean file
| Quadrant A | 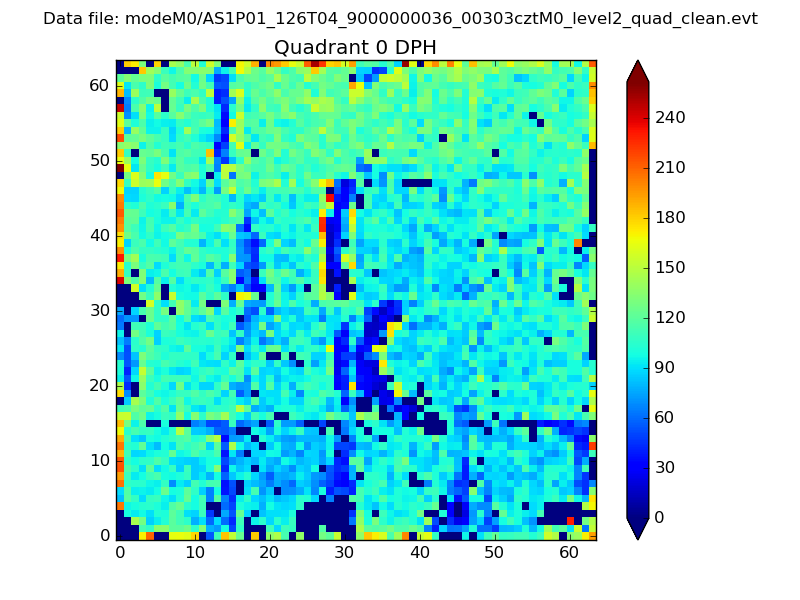 |
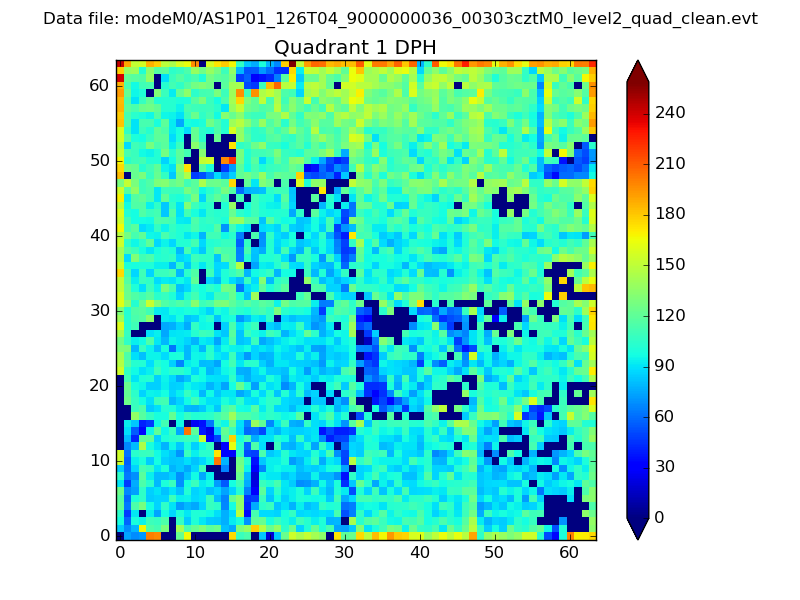 |
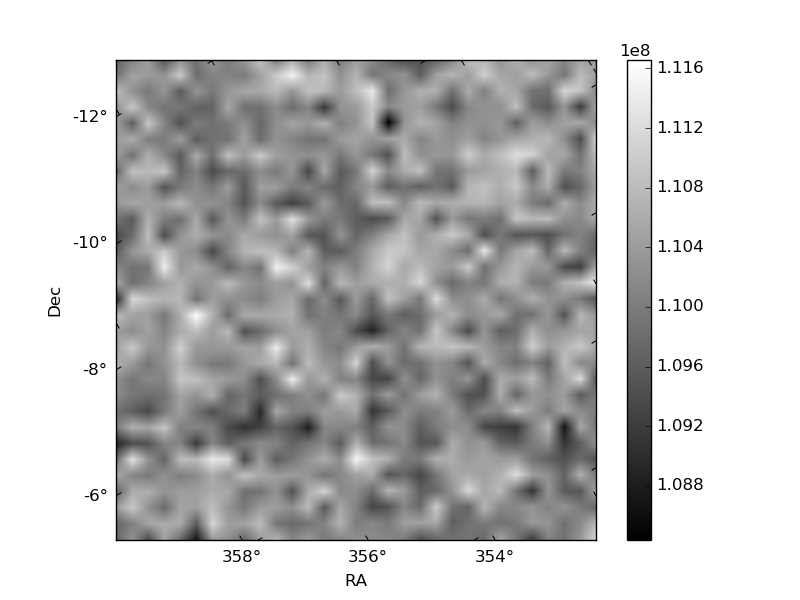
Quadrant B |
|---|---|---|---|
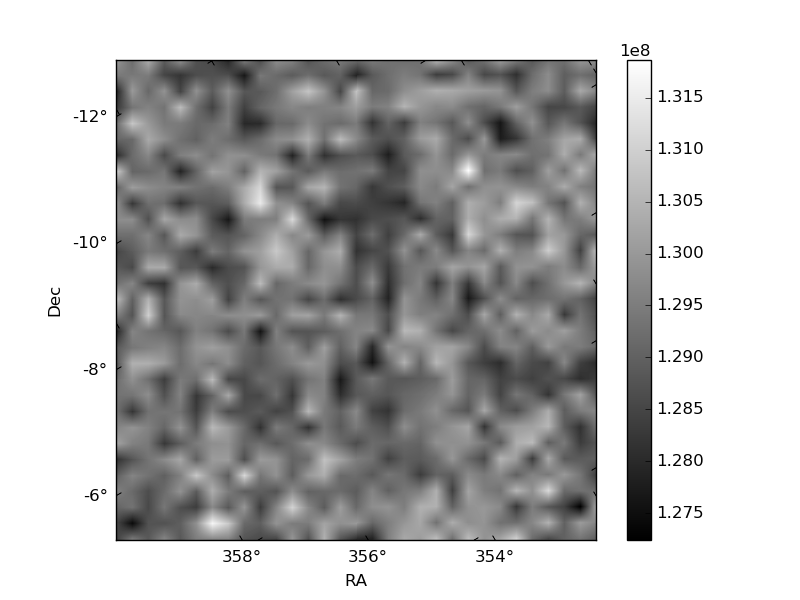
| Quadrant D | 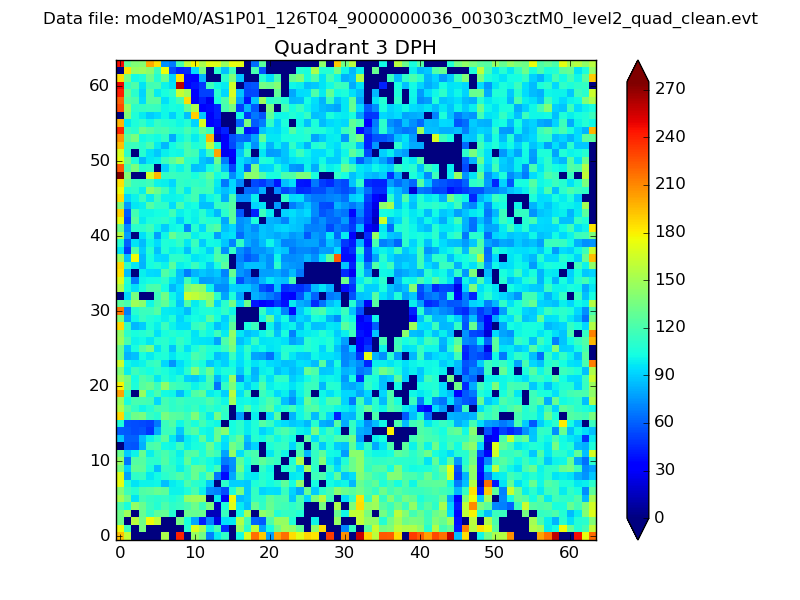 |
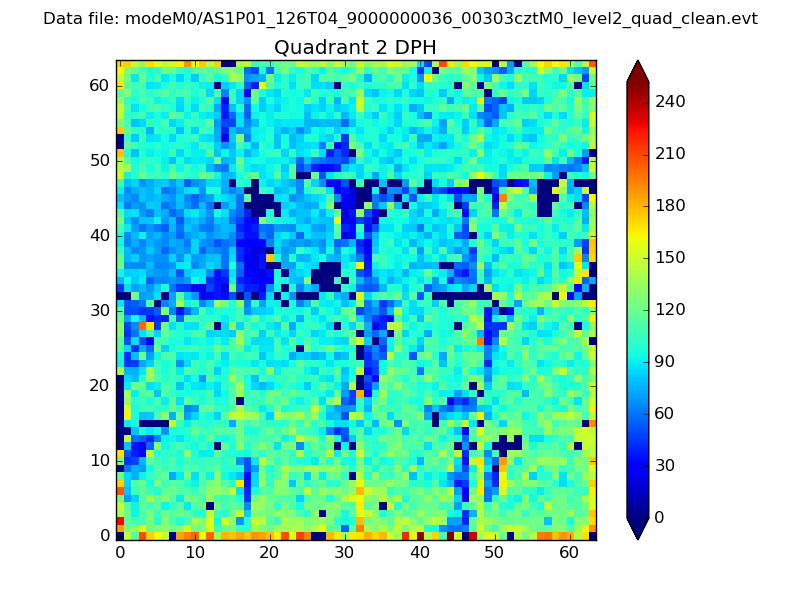 |
Quadrant C |
| Plot type | Count rate plots | Images |
|---|---|---|
| Comparison with Poisson distribution Blue bars denote a histogram of data divided into 1 sec bins. Red curve is a Poisson curve with rate = median count rate of data. |
 |
 |
| Quadrant-wise count rates Data is divided into 100 sec bins |
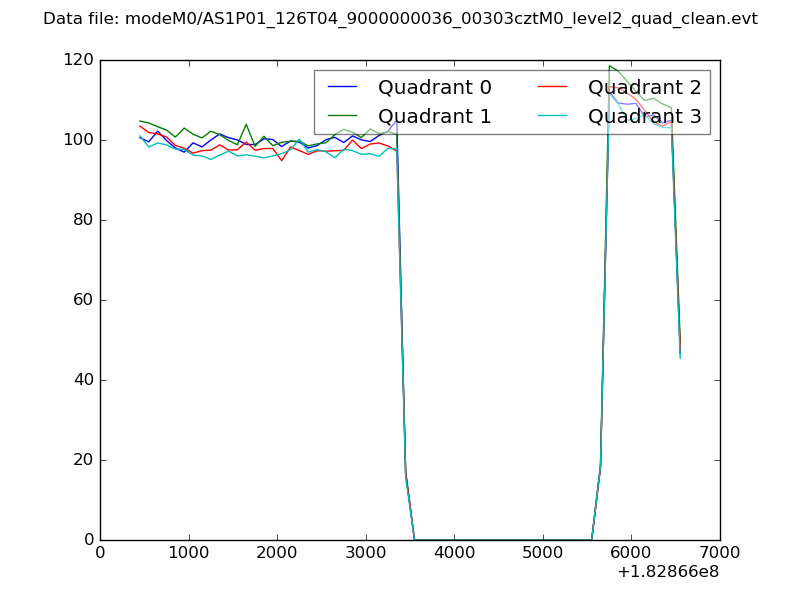 |
|
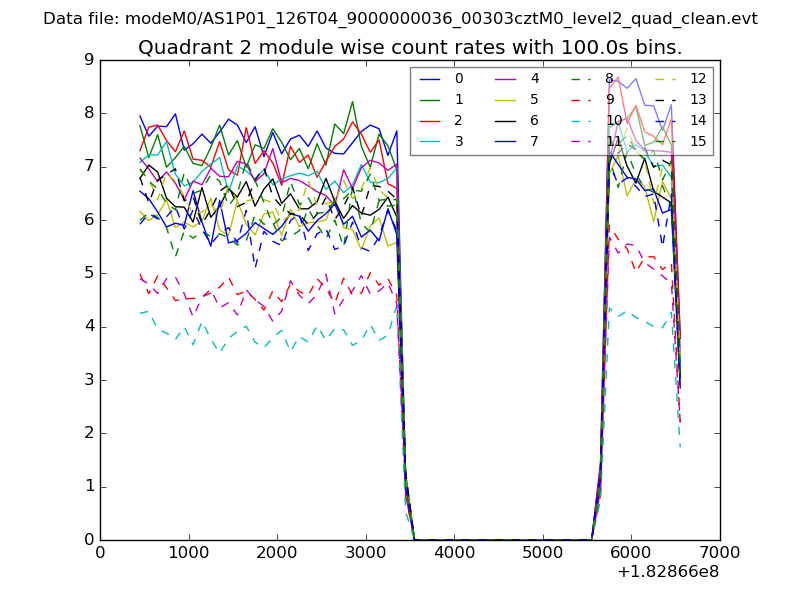
| Module-wise count rates for Quadrant A Data is divided into 100 sec bins |
 |
 |
| Module-wise count rates for Quadrant B Data is divided into 100 sec bins |
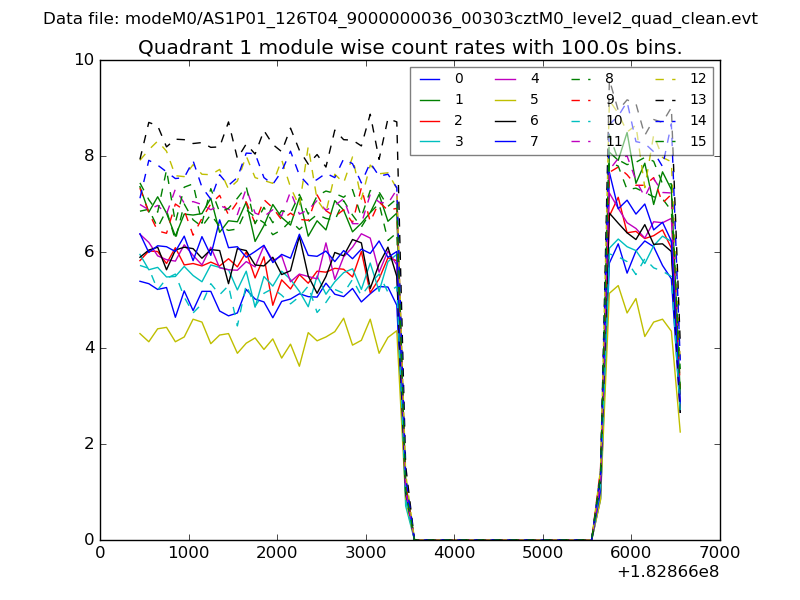 |
 |
| Module-wise count rates for Quadrant C Data is divided into 100 sec bins |
 |
 |
| Module-wise count rates for Quadrant D Data is divided into 100 sec bins |
 |
 |
| Parameter | Plot |
|---|---|
| CZT HV Monitor | 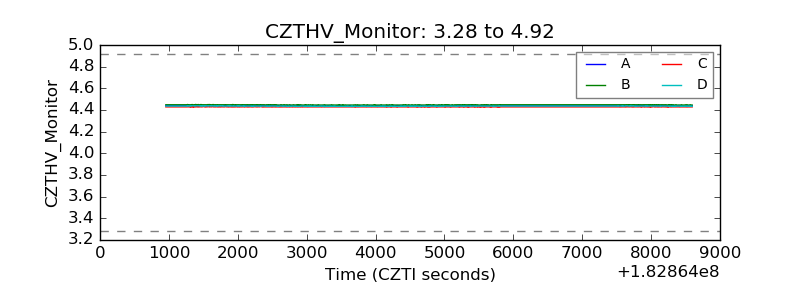 |
| D_VDD | 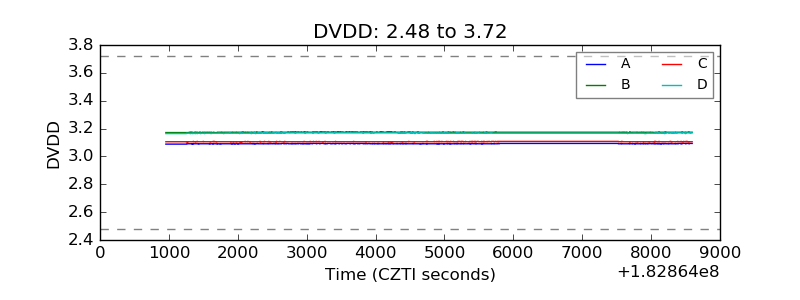 |
| Temperature 1 | 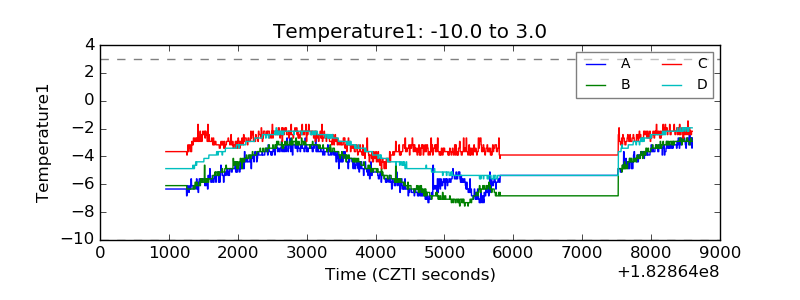 |
| Veto HV Monitor | 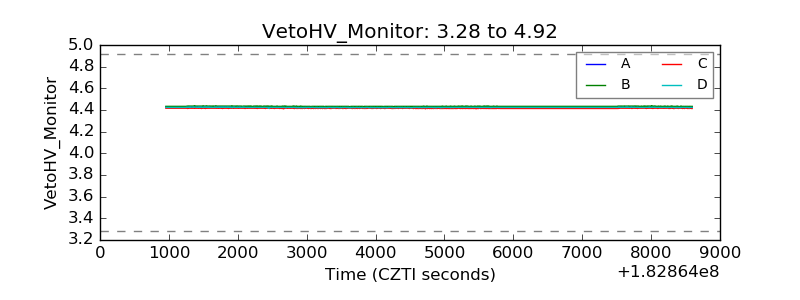 |
| Veto LLD | 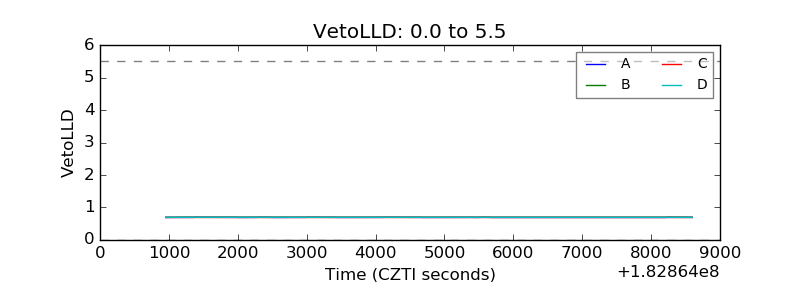 |
| Alpha Counter | 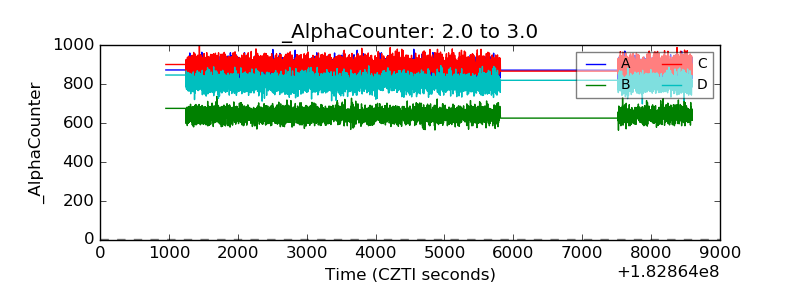 |
| _CPM_Rate | 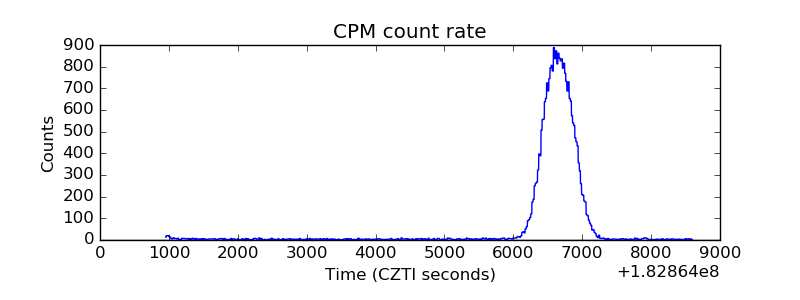 |
| CZT Counter | 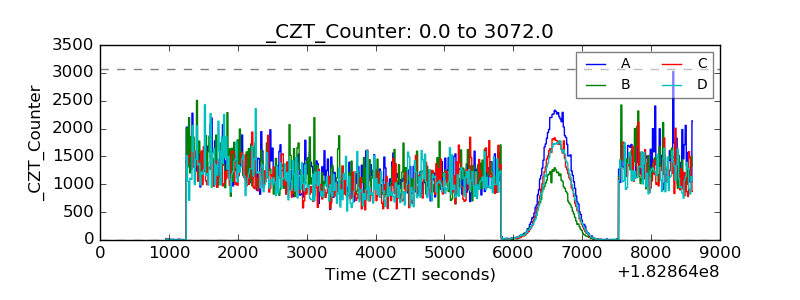 |
| +2.5 Volts monitor |  |
| +5 Volts monitor |  |
| _ROLL_ROT | 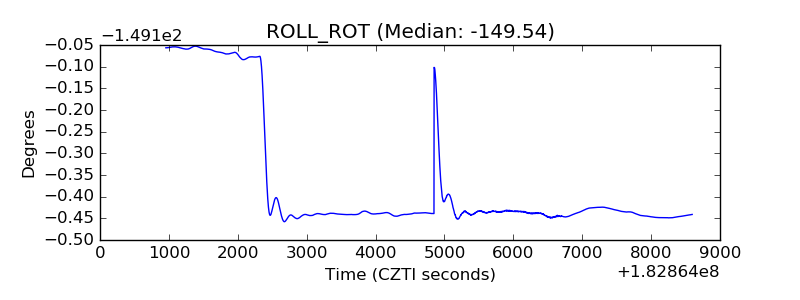 |
| _Roll_DEC | 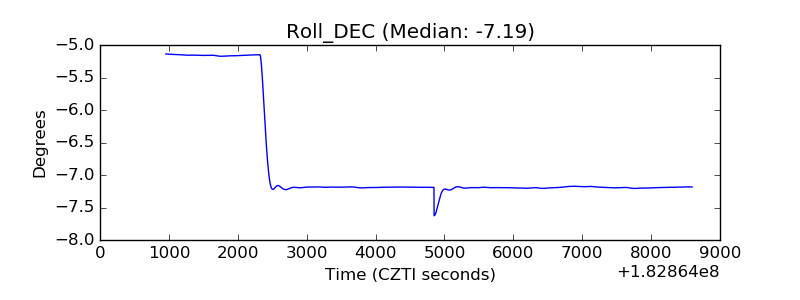 |
| _Roll_RA | 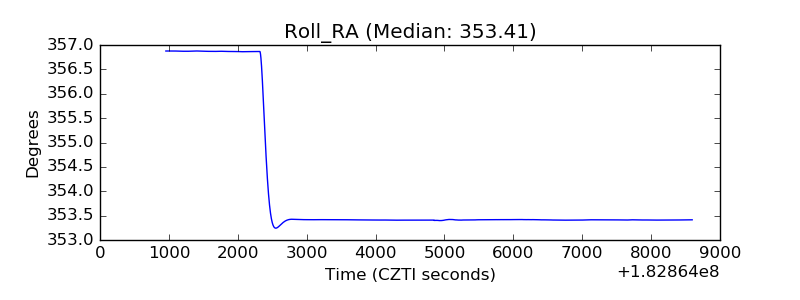 |
| Veto Counter |  |