| Param | Original file | Final file |
|---|---|---|
| Filename | modeM0/AS1P01_126T04_9000000036_00305cztM0_level2.evt | modeM0/AS1P01_126T04_9000000036_00305cztM0_level2_quad_clean.evt |
| Size (bytes) | 846,308,160 | 70,142,400 |
| Size | 807.1 MB | 66.9 MB |
| Events in quadrant A | 6,633,747 | 436,757 |
| Events in quadrant B | 6,532,141 | 443,460 |
| Events in quadrant C | 6,115,968 | 428,562 |
| Events in quadrant D | 5,977,102 | 424,539 |
| Mode M9 | |||
|---|---|---|---|
| Quadrant | BADHDUFLAG | Total packets | Discarded packets |
| A | 0 | 19 | 0 |
| B | 0 | 19 | 0 |
| C | 0 | 19 | 0 |
| D | 0 | 20 | 0 |
| Mode SS | |||
|---|---|---|---|
| Quadrant | BADHDUFLAG | Total packets | Discarded packets |
| A | 0 | 112 | 0 |
| B | 0 | 112 | 0 |
| C | 0 | 112 | 0 |
| D | 0 | 112 | 0 |
| Mode M0 | |||
|---|---|---|---|
| Quadrant | BADHDUFLAG | Total packets | Discarded packets |
| A | 0 | 23698 | 3 |
| B | 0 | 23375 | 2 |
| C | 0 | 22165 | 2 |
| D | 0 | 21776 | 2 |
| Quadrant | Total seconds | Saturated seconds | Saturation percentage |
|---|---|---|---|
| A | 5588 | 2 | 0.035791% |
| B | 5588 | 9 | 0.161059% |
| C | 5588 | 5 | 0.089477% |
| D | 5588 | 24 | 0.429492% |
Noise dominated data is calculated using 1-second bins in cleaned event files. If a bin has >2000 counts, and if more than 50% of those come from <1% of pixels, then it is considered to be noise-dominated and hence unusable.
| Quadrant | # 1 sec bins | Bins with >0 counts | Bins with >2000 counts | High rate bins dominated by noise | Noise dominated (total time) | Noise dominated (detector-on time) | Marked lightcurve |
|---|---|---|---|---|---|---|---|
| A | 7323 | 5589 | 135 | 135 | 1.84% | 2.42% | 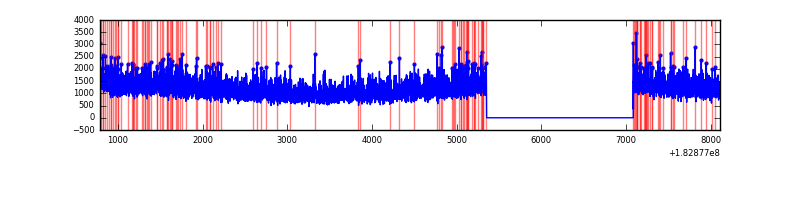 |
| B | 7323 | 5589 | 80 | 80 | 1.09% | 1.43% | 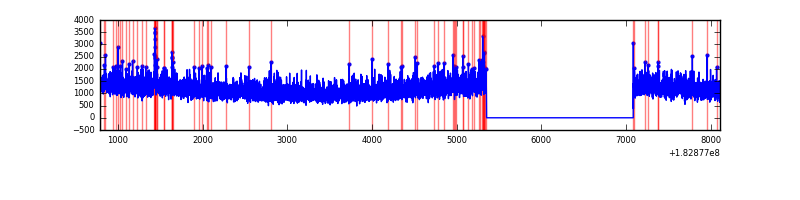 |
| C | 7323 | 5589 | 60 | 60 | 0.82% | 1.07% | 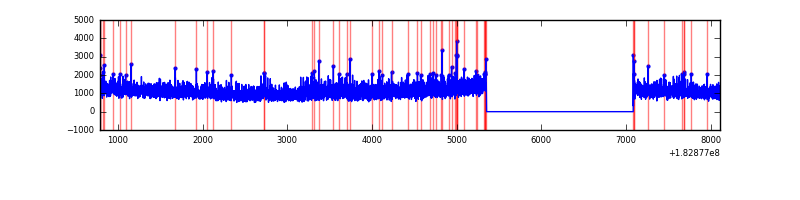 |
| D | 7323 | 5589 | 94 | 94 | 1.28% | 1.68% | 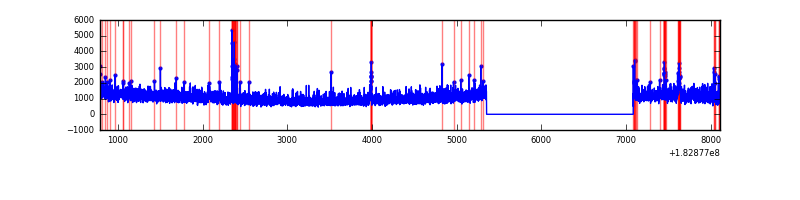 |
Top three noisy pixels from each quadrant. If the there are fewer than three noisy pixels in the level2.evt file, extra rows are filled as -1
| Pixel properties | Quadrant properties | ||||||
|---|---|---|---|---|---|---|---|
| Quadrant | DetID | PixID | Counts | Sigma | Mean | Median | Sigma |
| A | 0 | 6 | 19199 | 46.68 | 1703 | 1698 | 374.9 |
| A | 15 | 127 | 11030 | 24.89 | 1703 | 1698 | 374.9 |
| A | 12 | 189 | 5899 | 11.21 | 1703 | 1698 | 374.9 |
| B | 0 | 207 | 33970 | 81.89 | 1682 | 1695 | 394.1 |
| B | 8 | 54 | 21970 | 51.44 | 1682 | 1695 | 394.1 |
| B | 0 | 182 | 15837 | 35.88 | 1682 | 1695 | 394.1 |
| C | 2 | 192 | 136959 | 320.24 | 1506 | 1554 | 422.8 |
| C | 1 | 1 | 35949 | 81.35 | 1506 | 1554 | 422.8 |
| C | 10 | 19 | 13039 | 27.16 | 1506 | 1554 | 422.8 |
| D | 1 | 5 | 100150 | 213.63 | 1462 | 1520 | 461.7 |
| D | 13 | 216 | 81753 | 173.78 | 1462 | 1520 | 461.7 |
| D | 7 | 85 | 80215 | 170.45 | 1462 | 1520 | 461.7 |
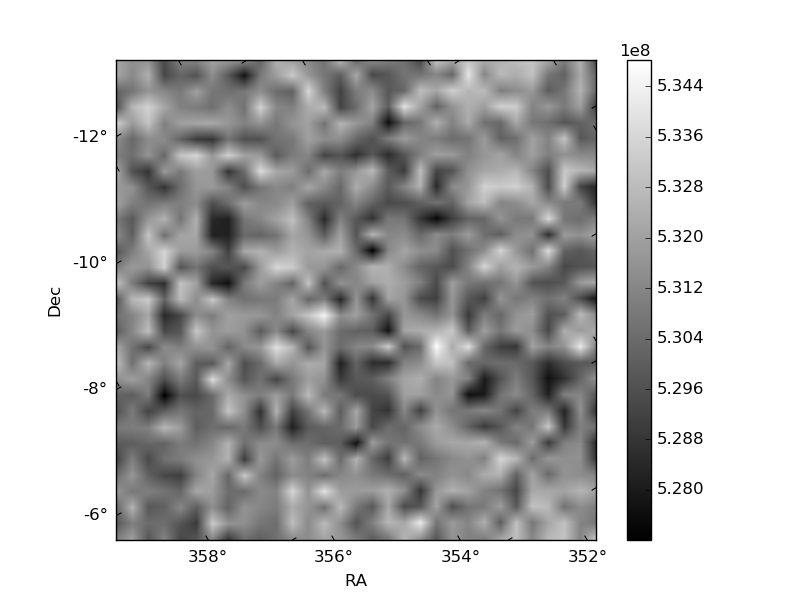
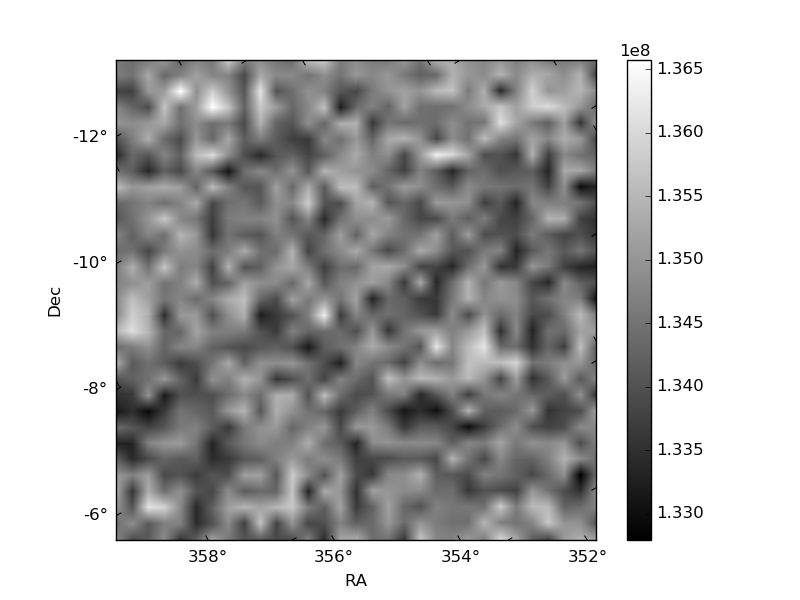
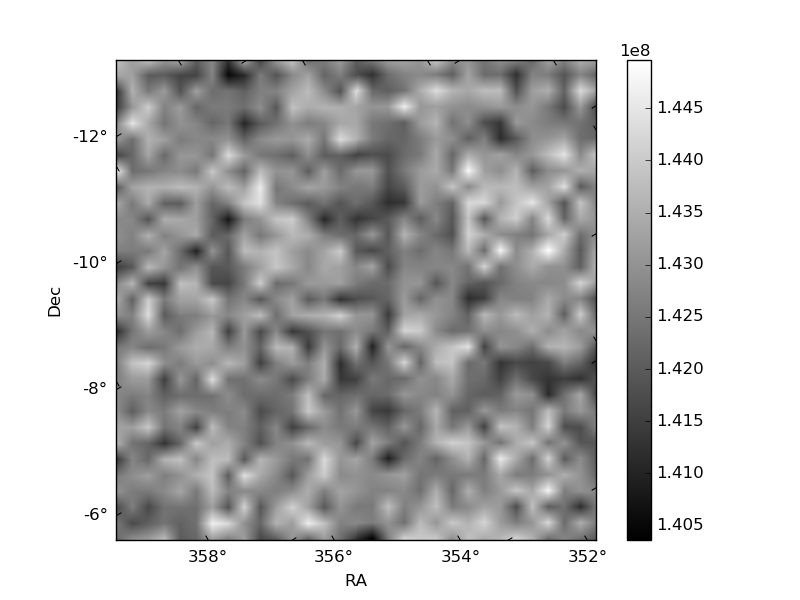
Histogram calculated using DETX and DETY for each event in the final _common_clean file
| Quadrant A | 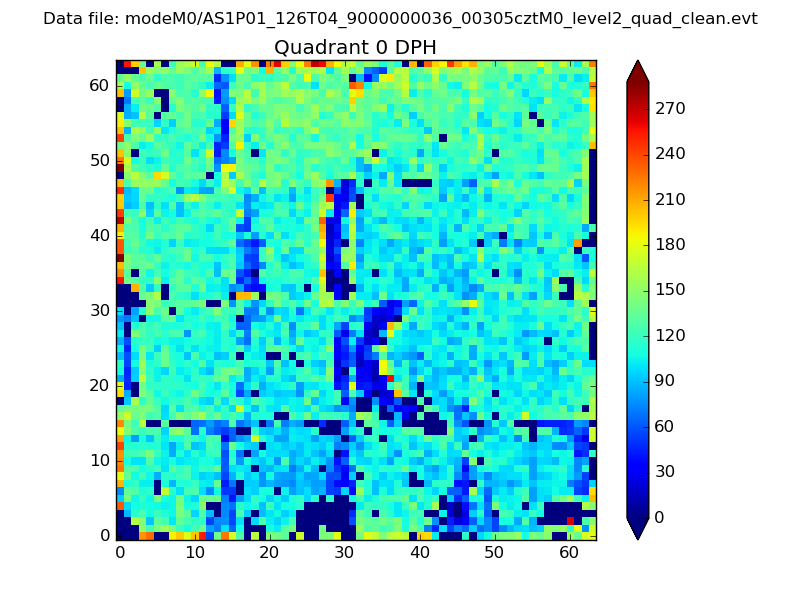 |
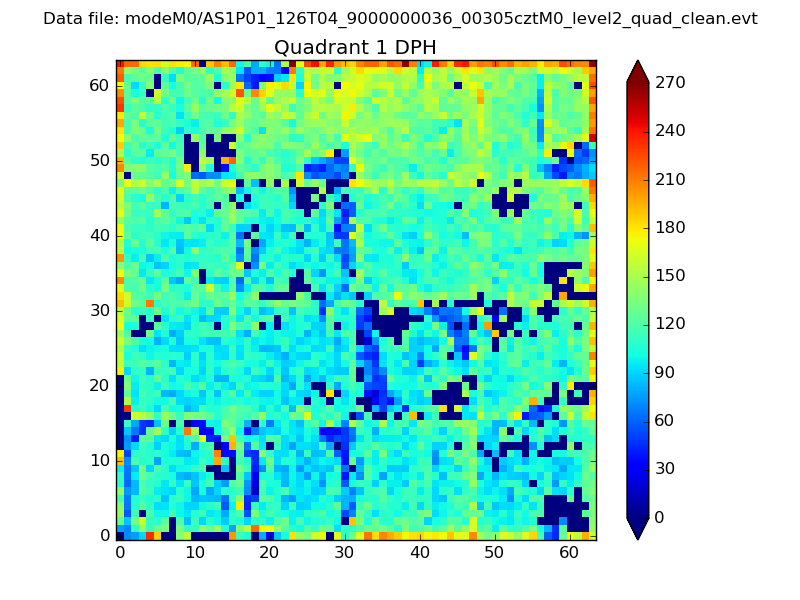 |
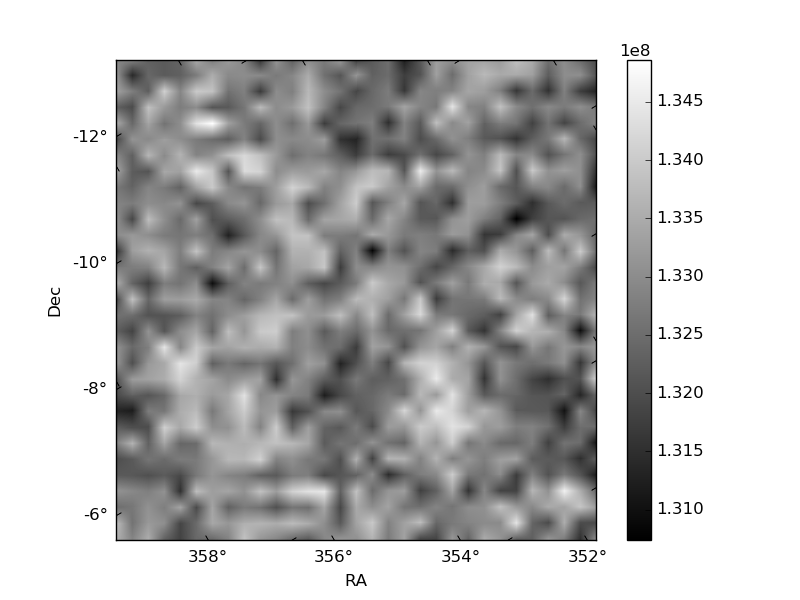
Quadrant B |
|---|---|---|---|
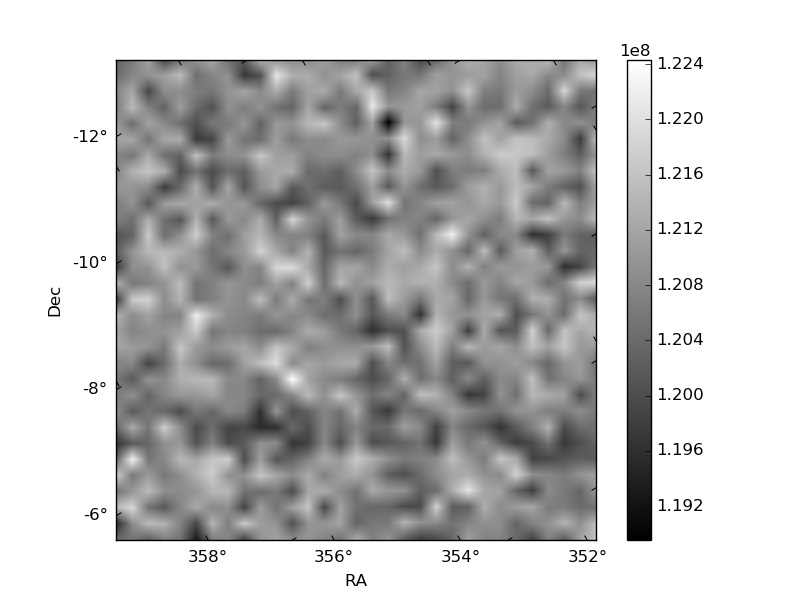
| Quadrant D | 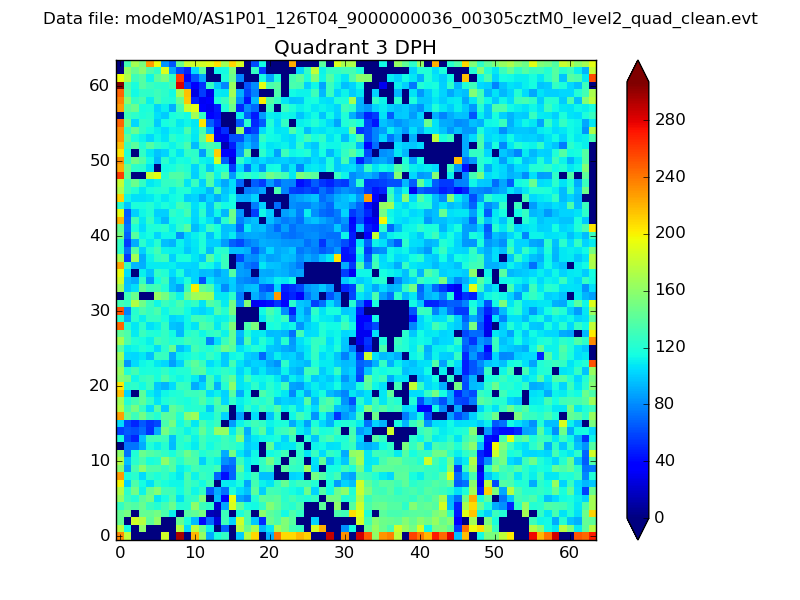 |
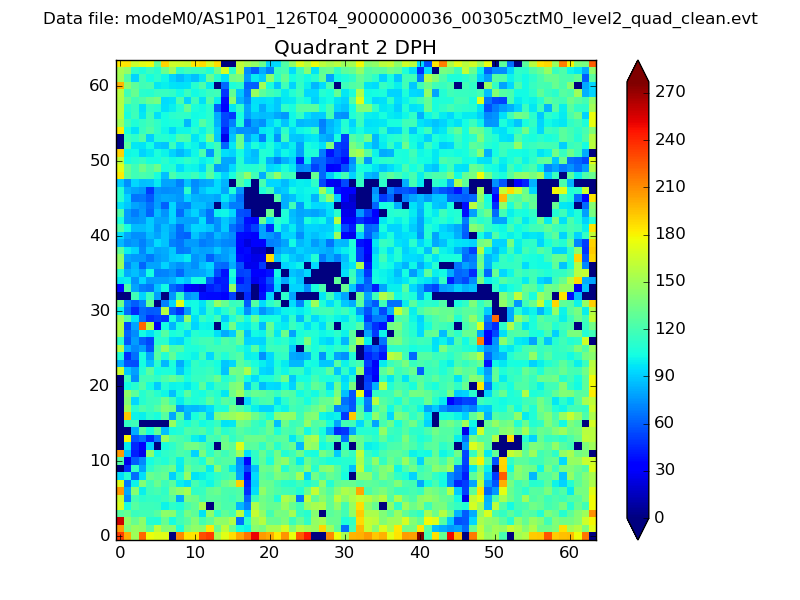 |
Quadrant C |
| Plot type | Count rate plots | Images |
|---|---|---|
| Comparison with Poisson distribution Blue bars denote a histogram of data divided into 1 sec bins. Red curve is a Poisson curve with rate = median count rate of data. |
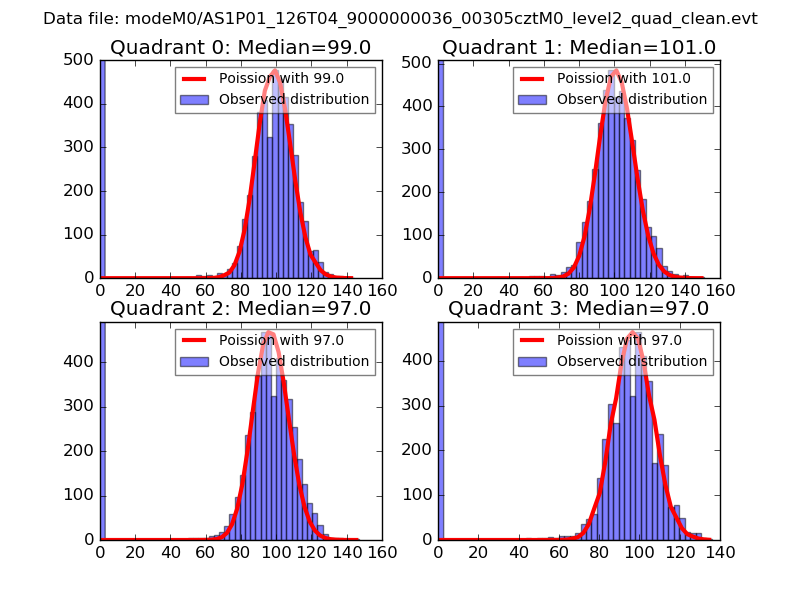 |
 |
| Quadrant-wise count rates Data is divided into 100 sec bins |
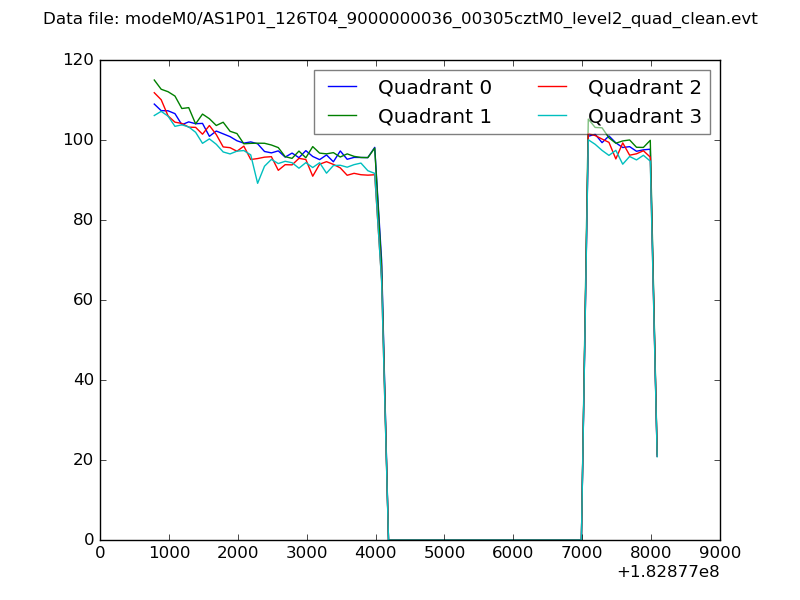 |
|
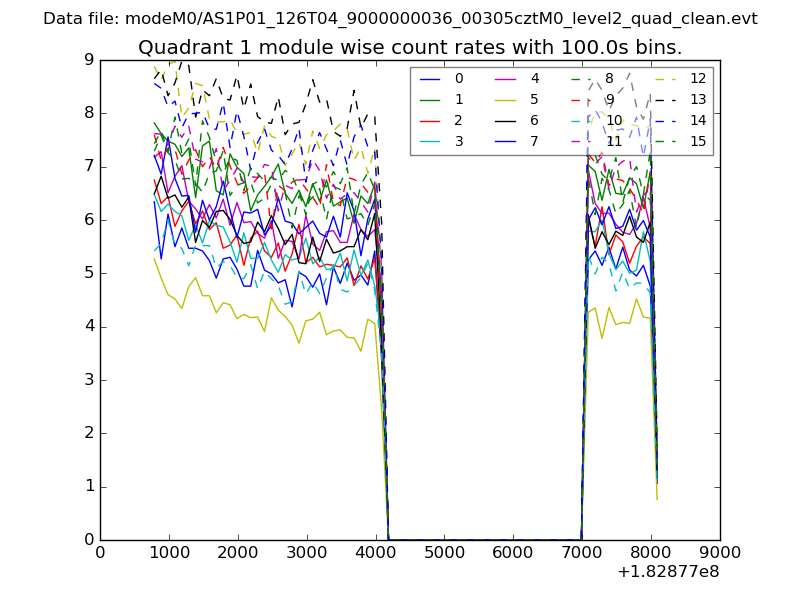
| Module-wise count rates for Quadrant A Data is divided into 100 sec bins |
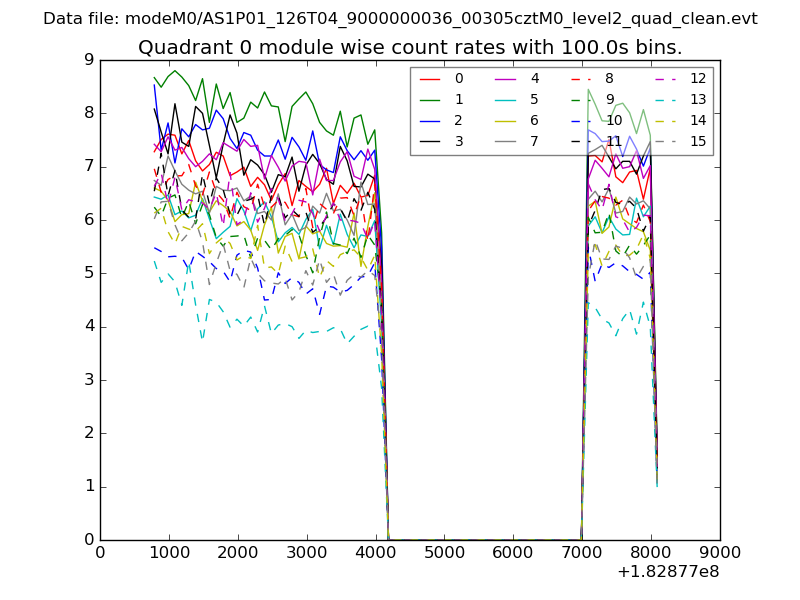 |
 |
| Module-wise count rates for Quadrant B Data is divided into 100 sec bins |
 |
 |
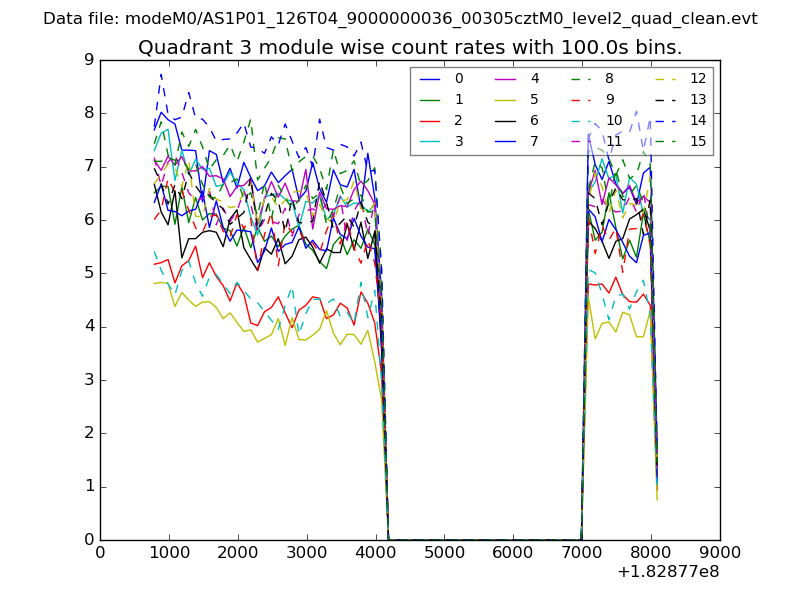
| Module-wise count rates for Quadrant C Data is divided into 100 sec bins |
 |
 |
| Module-wise count rates for Quadrant D Data is divided into 100 sec bins |
 |
 |
| Parameter | Plot |
|---|---|
| CZT HV Monitor | 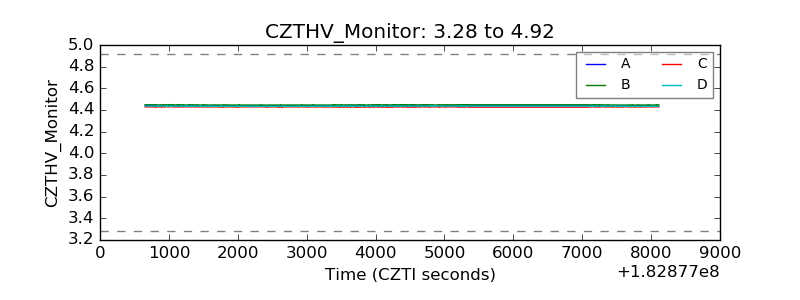 |
| D_VDD | 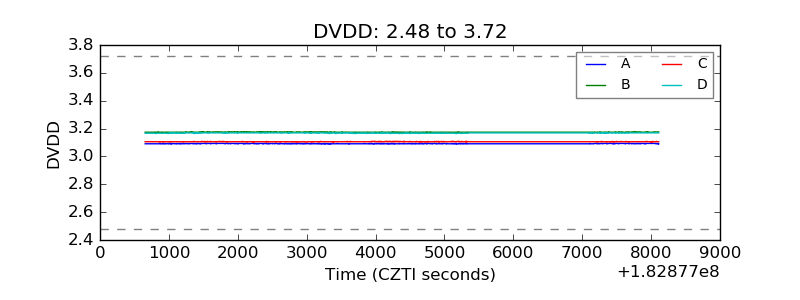 |
| Temperature 1 | 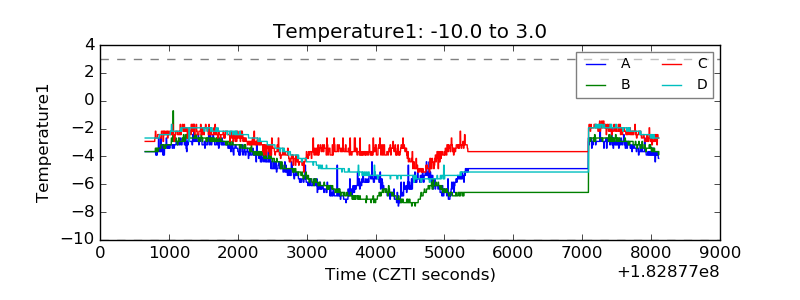 |
| Veto HV Monitor | 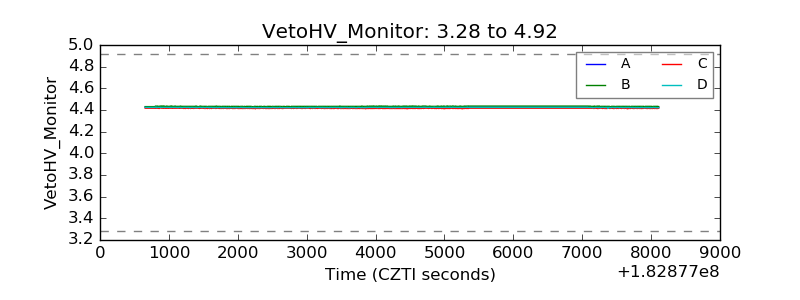 |
| Veto LLD | 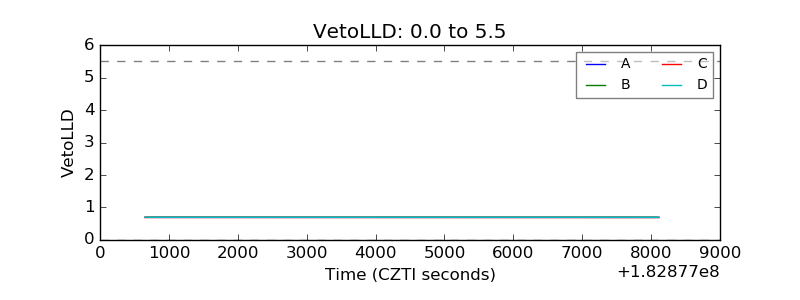 |
| Alpha Counter | 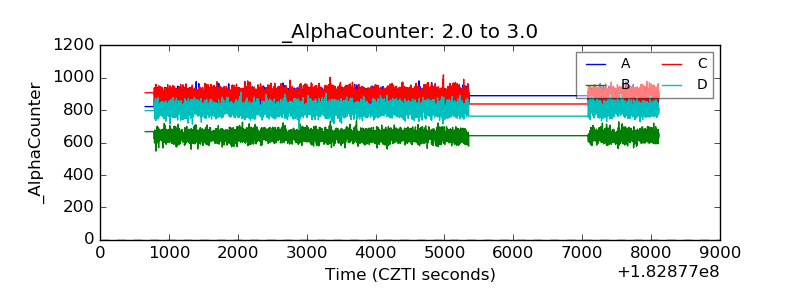 |
| _CPM_Rate | 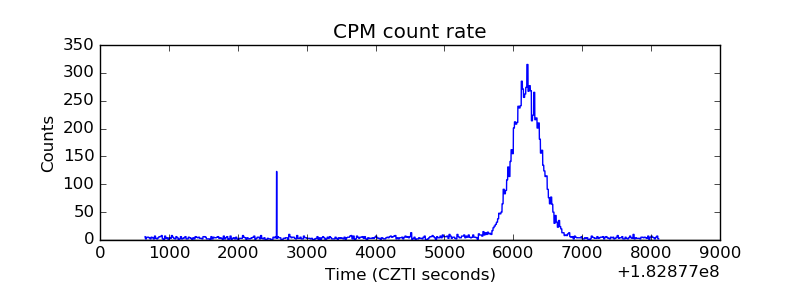 |
| CZT Counter | 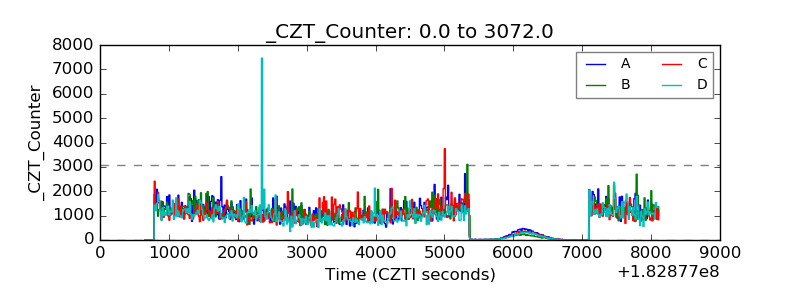 |
| +2.5 Volts monitor |  |
| +5 Volts monitor | 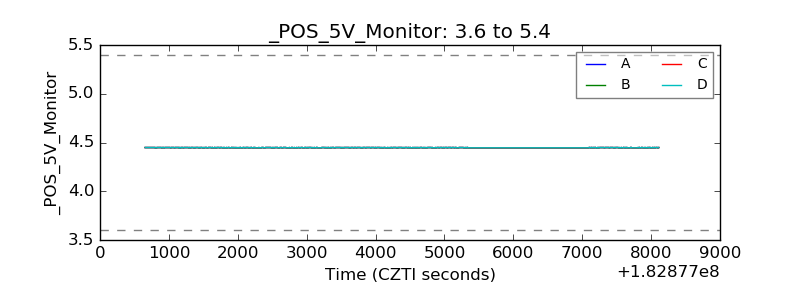 |
| _ROLL_ROT | 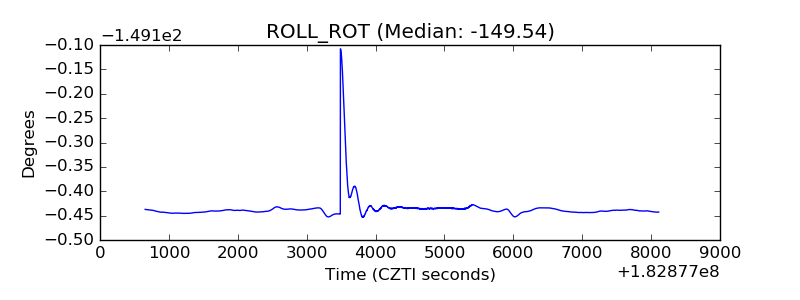 |
| _Roll_DEC | 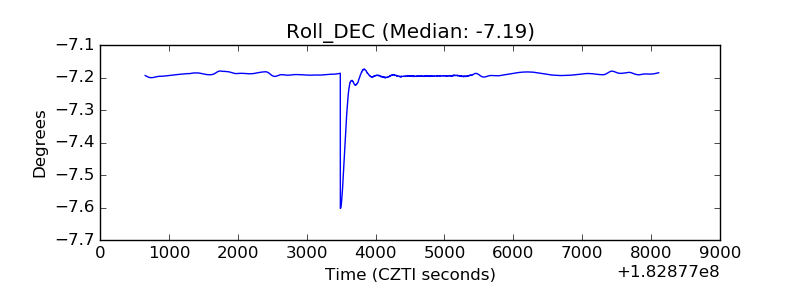 |
| _Roll_RA | 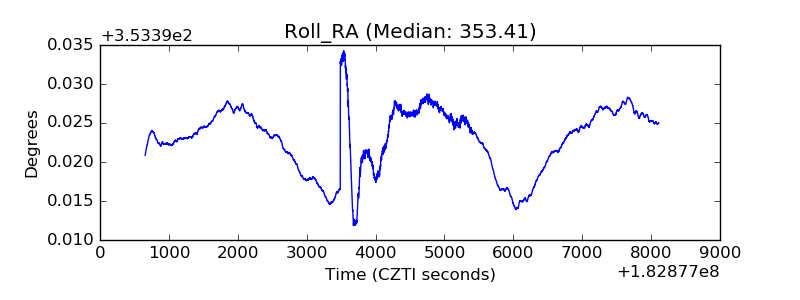 |
| Veto Counter | 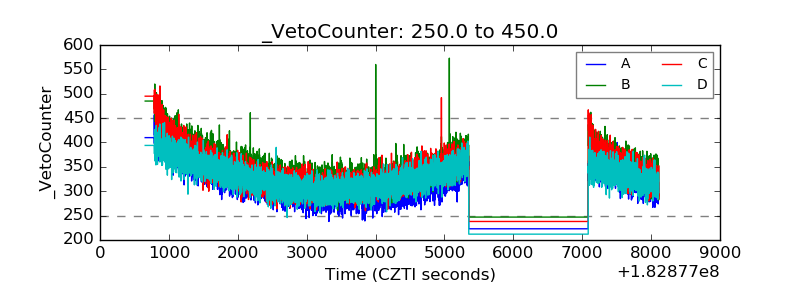 |