| Param | Original file | Final file |
|---|---|---|
| Filename | modeM0/AS1P01_126T04_9000000036_00306cztM0_level2.evt | modeM0/AS1P01_126T04_9000000036_00306cztM0_level2_quad_clean.evt |
| Size (bytes) | 875,583,360 | 66,568,320 |
| Size | 835.0 MB | 63.5 MB |
| Events in quadrant A | 6,906,834 | 406,209 |
| Events in quadrant B | 6,702,157 | 408,547 |
| Events in quadrant C | 6,201,779 | 399,136 |
| Events in quadrant D | 6,314,698 | 390,479 |
| Mode M9 | |||
|---|---|---|---|
| Quadrant | BADHDUFLAG | Total packets | Discarded packets |
| A | 0 | 18 | 0 |
| B | 0 | 18 | 0 |
| C | 0 | 18 | 0 |
| D | 0 | 19 | 0 |
| Mode SS | |||
|---|---|---|---|
| Quadrant | BADHDUFLAG | Total packets | Discarded packets |
| A | 0 | 118 | 0 |
| B | 0 | 118 | 0 |
| C | 0 | 118 | 0 |
| D | 0 | 118 | 0 |
| Mode M0 | |||
|---|---|---|---|
| Quadrant | BADHDUFLAG | Total packets | Discarded packets |
| A | 0 | 24685 | 3 |
| B | 0 | 24091 | 2 |
| C | 0 | 22606 | 2 |
| D | 0 | 22982 | 2 |
| Quadrant | Total seconds | Saturated seconds | Saturation percentage |
|---|---|---|---|
| A | 5889 | 33 | 0.560367% |
| B | 5889 | 6 | 0.101885% |
| C | 5889 | 11 | 0.186789% |
| D | 5889 | 13 | 0.220751% |
Noise dominated data is calculated using 1-second bins in cleaned event files. If a bin has >2000 counts, and if more than 50% of those come from <1% of pixels, then it is considered to be noise-dominated and hence unusable.
| Quadrant | # 1 sec bins | Bins with >0 counts | Bins with >2000 counts | High rate bins dominated by noise | Noise dominated (total time) | Noise dominated (detector-on time) | Marked lightcurve |
|---|---|---|---|---|---|---|---|
| A | 7623 | 5890 | 170 | 170 | 2.23% | 2.89% | 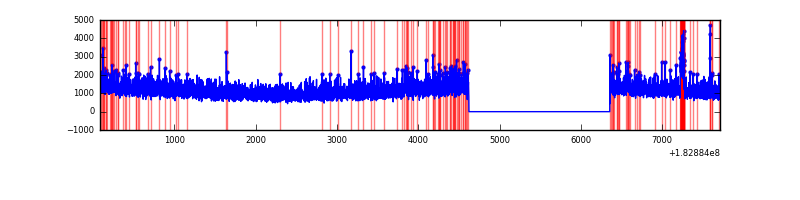 |
| B | 7623 | 5890 | 60 | 60 | 0.79% | 1.02% | 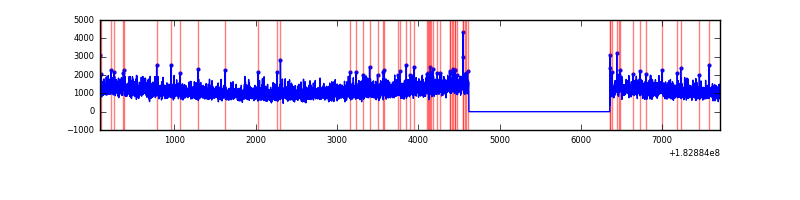 |
| C | 7623 | 5890 | 51 | 51 | 0.67% | 0.87% | 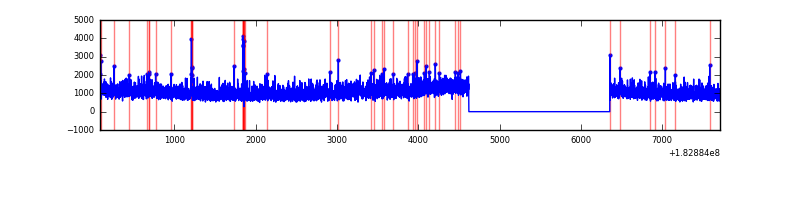 |
| D | 7623 | 5890 | 130 | 130 | 1.71% | 2.21% | 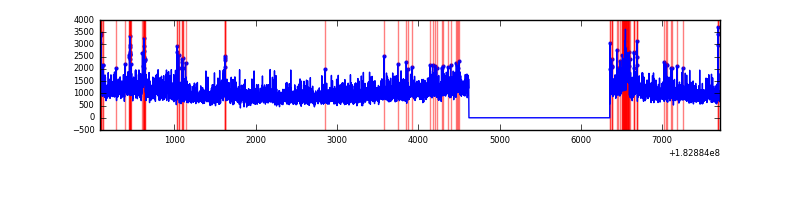 |
Top three noisy pixels from each quadrant. If the there are fewer than three noisy pixels in the level2.evt file, extra rows are filled as -1
| Pixel properties | Quadrant properties | ||||||
|---|---|---|---|---|---|---|---|
| Quadrant | DetID | PixID | Counts | Sigma | Mean | Median | Sigma |
| A | 0 | 6 | 109460 | 279.82 | 1736 | 1723 | 385.0 |
| A | 0 | 69 | 42486 | 105.87 | 1736 | 1723 | 385.0 |
| A | 15 | 127 | 33606 | 82.81 | 1736 | 1723 | 385.0 |
| B | 0 | 183 | 26041 | 59.72 | 1733 | 1746 | 406.8 |
| B | 5 | 46 | 18937 | 42.26 | 1733 | 1746 | 406.8 |
| B | 15 | 80 | 10636 | 21.85 | 1733 | 1746 | 406.8 |
| C | 1 | 1 | 66060 | 148.12 | 1546 | 1599 | 435.2 |
| C | 2 | 192 | 42187 | 93.27 | 1546 | 1599 | 435.2 |
| C | 10 | 19 | 8092 | 14.92 | 1546 | 1599 | 435.2 |
| D | 1 | 5 | 260035 | 550.17 | 1497 | 1559 | 469.8 |
| D | 13 | 7 | 98704 | 206.77 | 1497 | 1559 | 469.8 |
| D | 7 | 85 | 49827 | 102.74 | 1497 | 1559 | 469.8 |
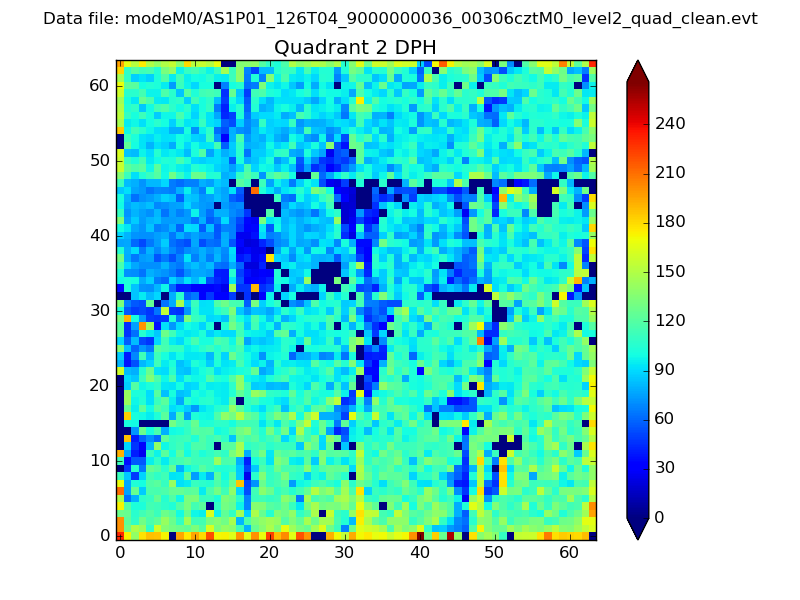
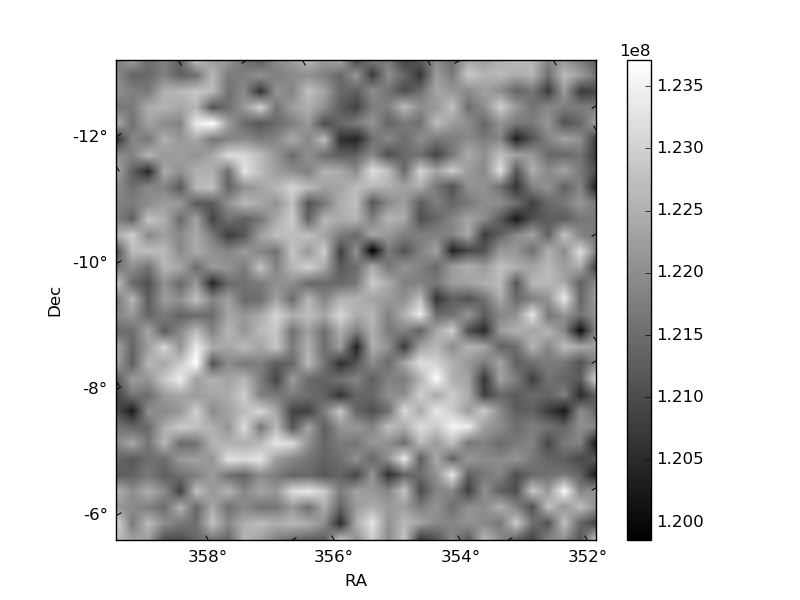
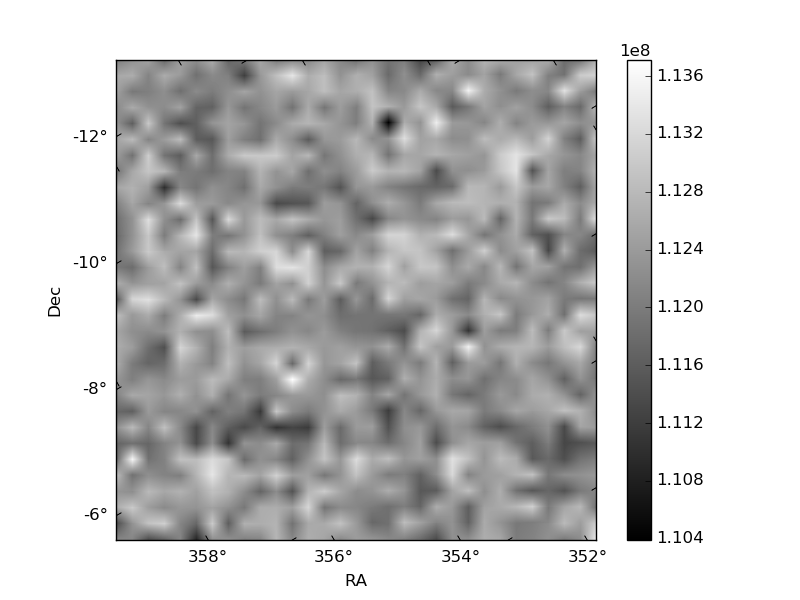
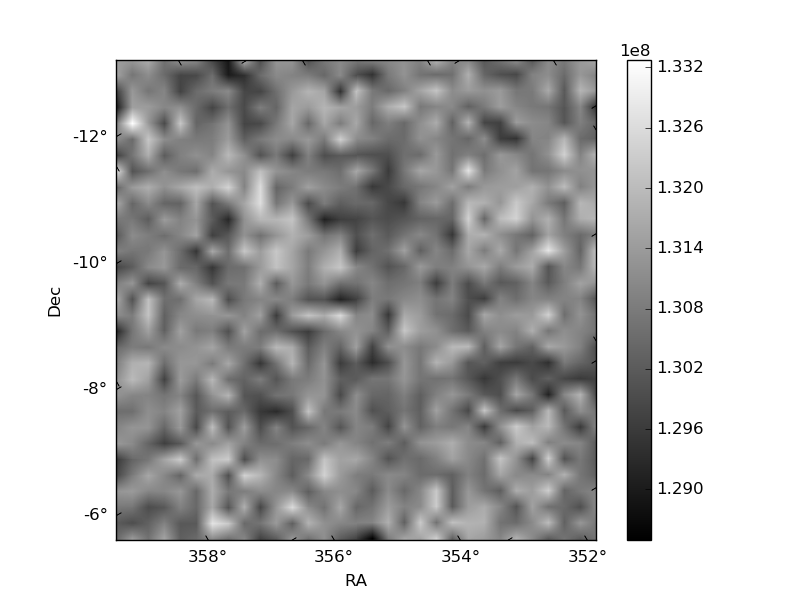
Histogram calculated using DETX and DETY for each event in the final _common_clean file
| Quadrant A |  |
 |
Quadrant B |
|---|---|---|---|
| Quadrant D | 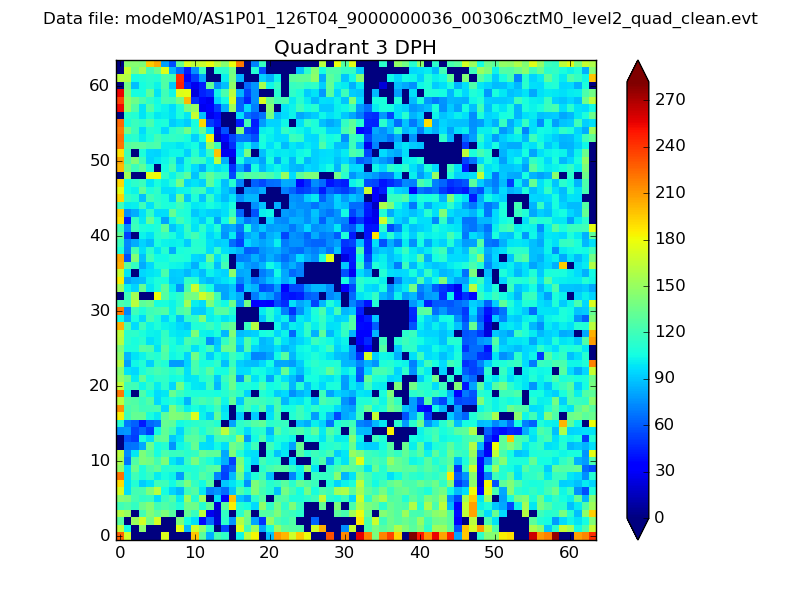 |
 |
Quadrant C |
| Plot type | Count rate plots | Images |
|---|---|---|
| Comparison with Poisson distribution Blue bars denote a histogram of data divided into 1 sec bins. Red curve is a Poisson curve with rate = median count rate of data. |
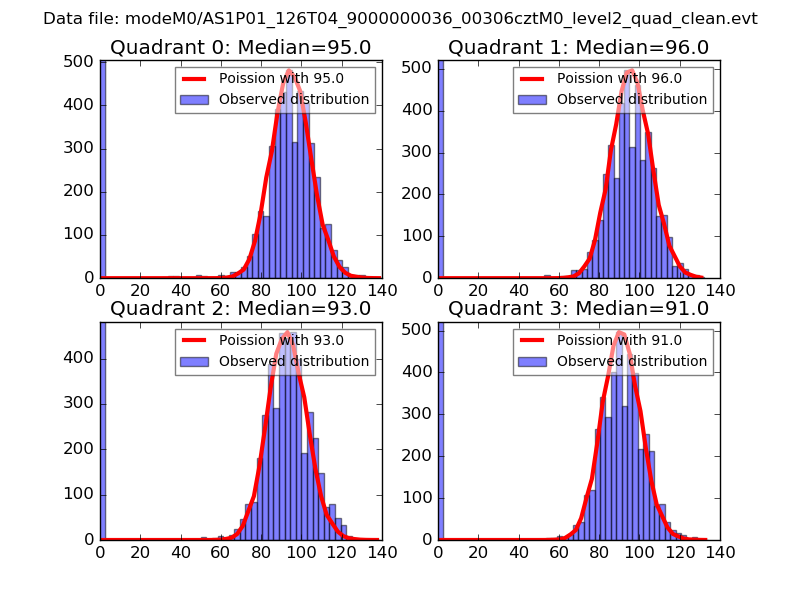 |
 |
| Quadrant-wise count rates Data is divided into 100 sec bins |
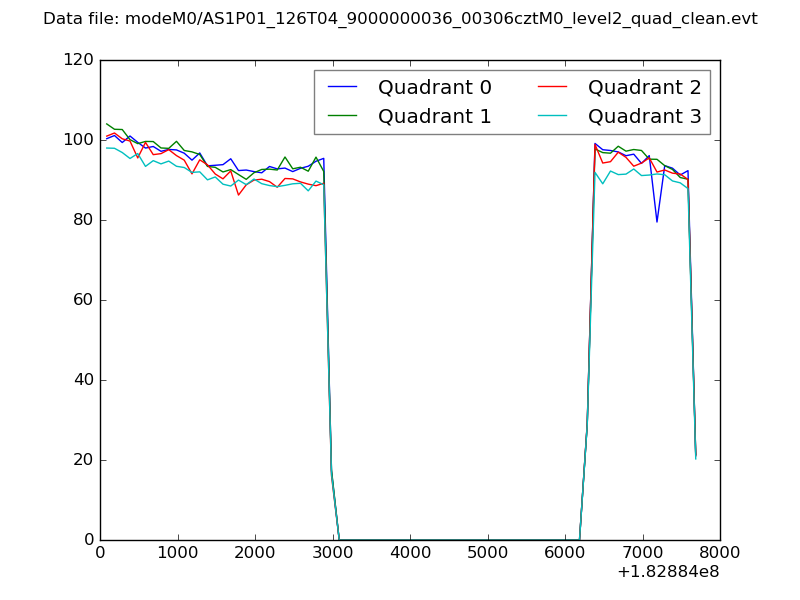 |
|
| Module-wise count rates for Quadrant A Data is divided into 100 sec bins |
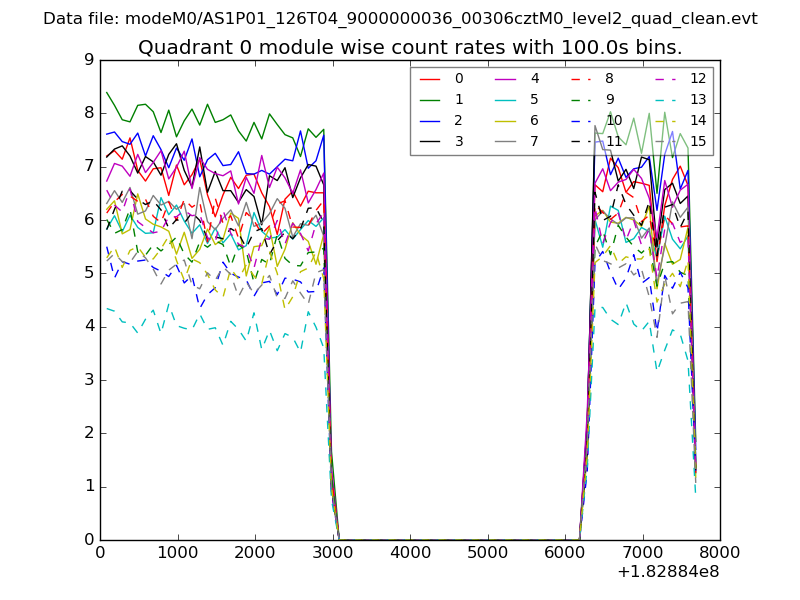 |
 |
| Module-wise count rates for Quadrant B Data is divided into 100 sec bins |
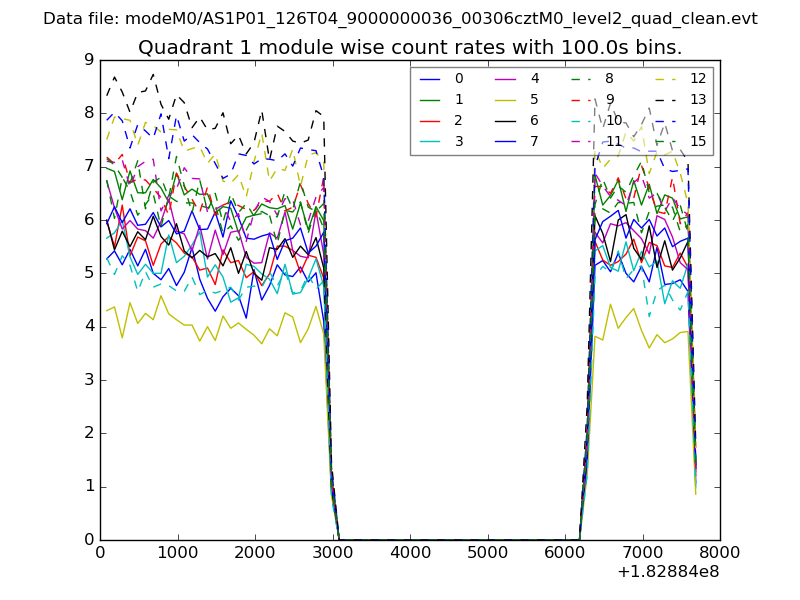 |
 |
| Module-wise count rates for Quadrant C Data is divided into 100 sec bins |
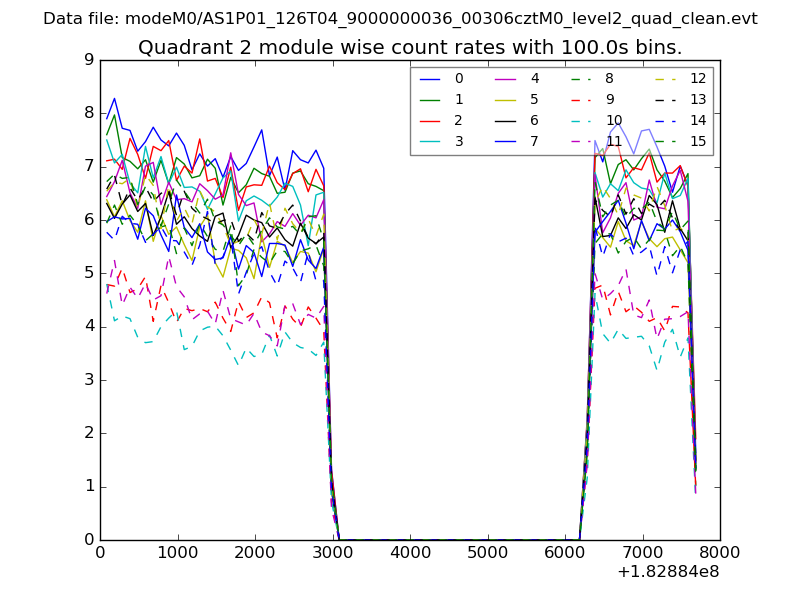 |
 |
| Module-wise count rates for Quadrant D Data is divided into 100 sec bins |
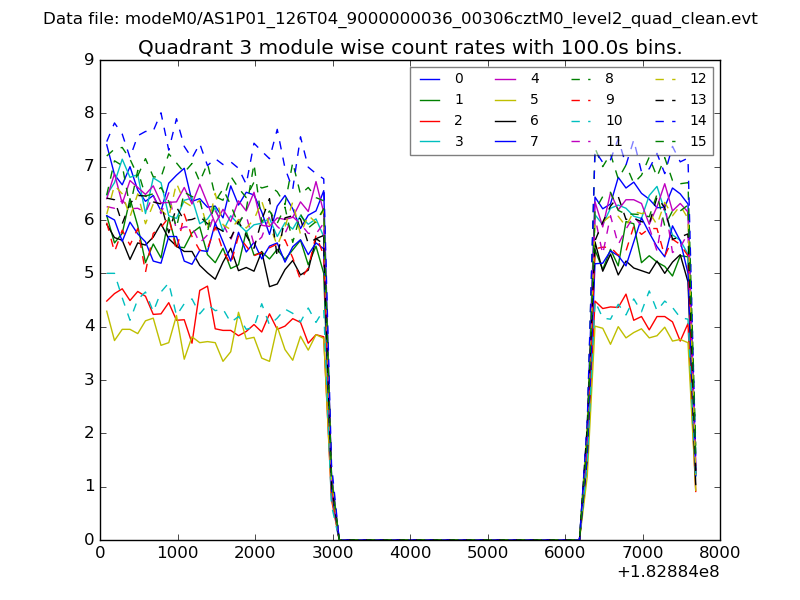 |
 |
| Parameter | Plot |
|---|---|
| CZT HV Monitor | 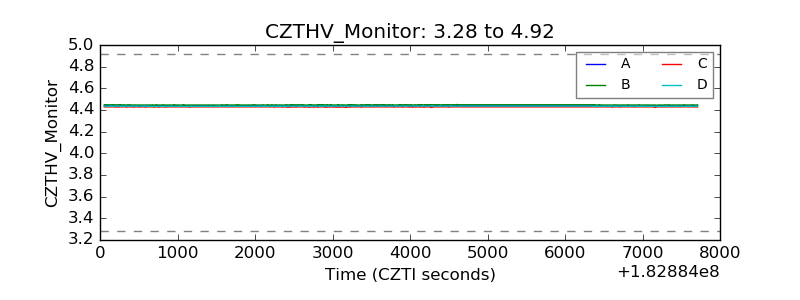 |
| D_VDD | 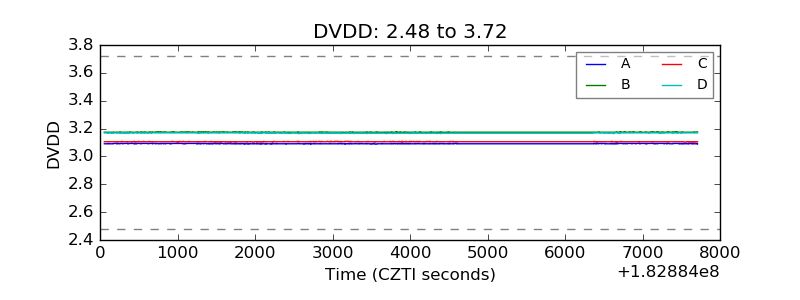 |
| Temperature 1 | 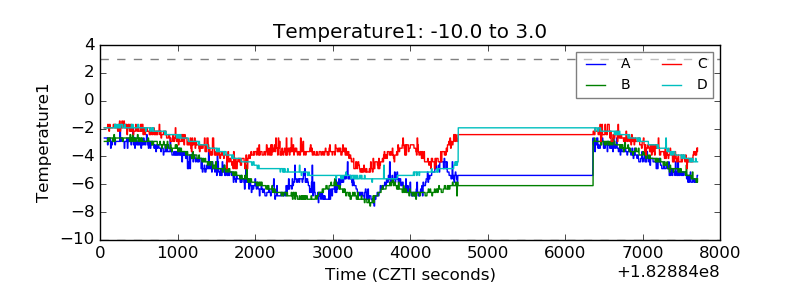 |
| Veto HV Monitor | 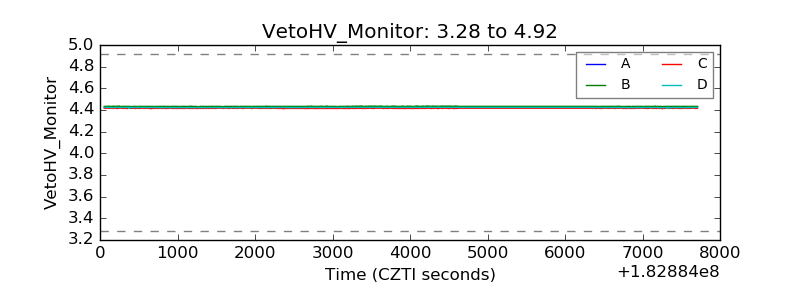 |
| Veto LLD |  |
| Alpha Counter | 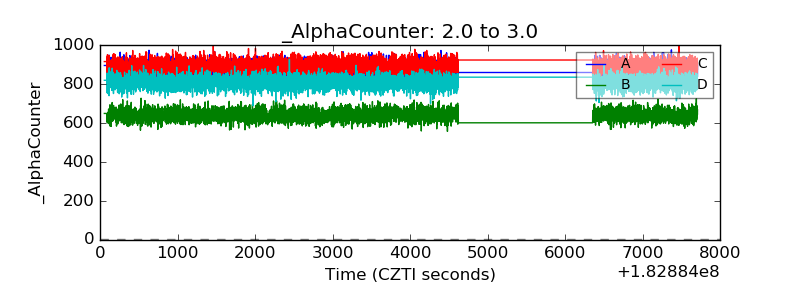 |
| _CPM_Rate | 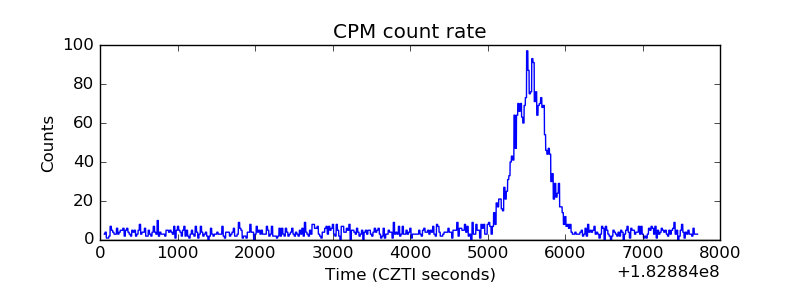 |
| CZT Counter | 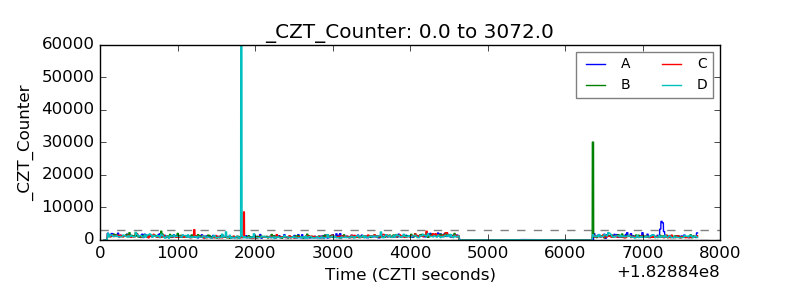 |
| +2.5 Volts monitor |  |
| +5 Volts monitor | 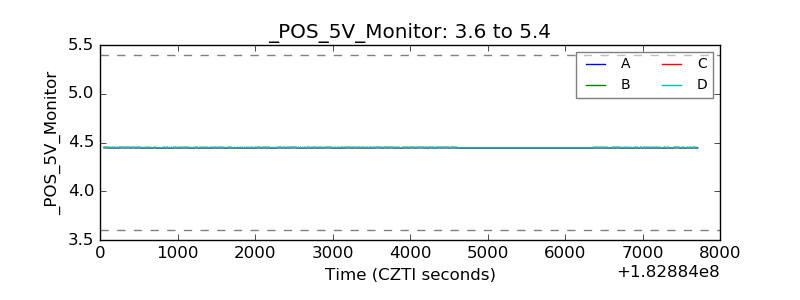 |
| _ROLL_ROT | 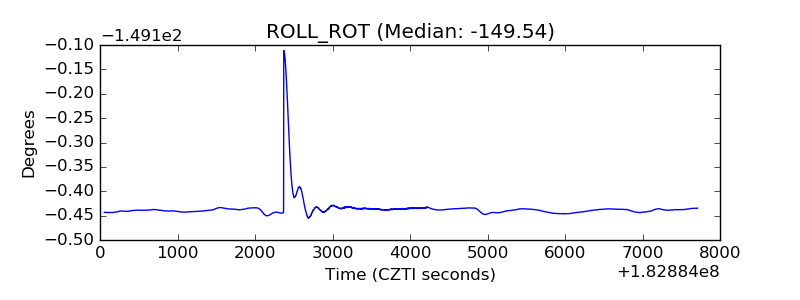 |
| _Roll_DEC | 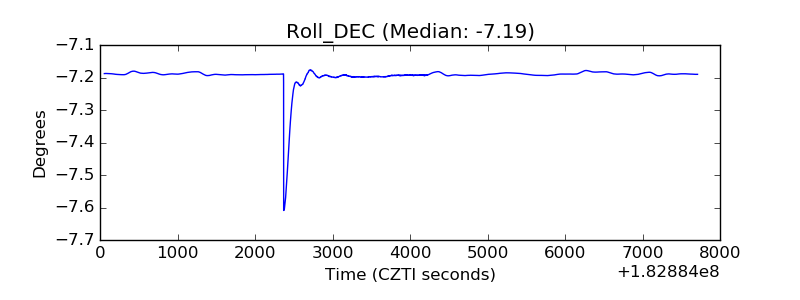 |
| _Roll_RA | 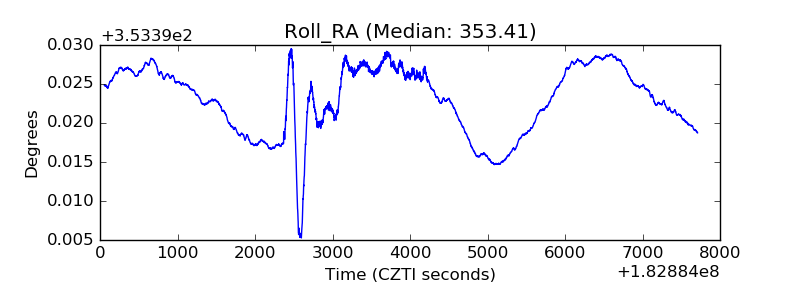 |
| Veto Counter | 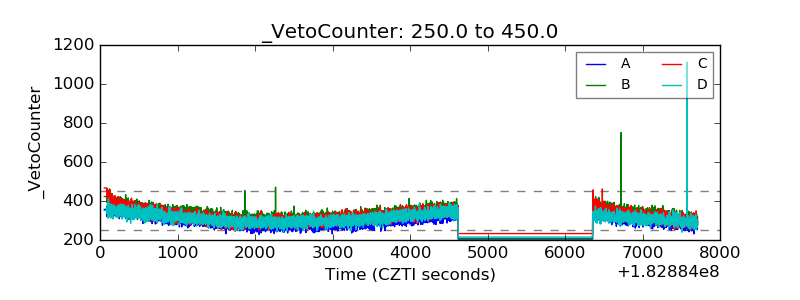 |