| Param | Original file | Final file |
|---|---|---|
| Filename | modeM0/AS1P01_126T04_9000000036_00307cztM0_level2.evt | modeM0/AS1P01_126T04_9000000036_00307cztM0_level2_quad_clean.evt |
| Size (bytes) | 49,743,360 | 5,604,480 |
| Size | 47.4 MB | 5.3 MB |
| Events in quadrant A | 384,018 | 34,099 |
| Events in quadrant B | 399,938 | 33,994 |
| Events in quadrant C | 345,139 | 33,873 |
| Events in quadrant D | 349,067 | 33,202 |
| Mode SS | |||
|---|---|---|---|
| Quadrant | BADHDUFLAG | Total packets | Discarded packets |
| A | 0 | 8 | 0 |
| B | 0 | 8 | 0 |
| C | 0 | 8 | 0 |
| D | 0 | 8 | 0 |
| Mode M0 | |||
|---|---|---|---|
| Quadrant | BADHDUFLAG | Total packets | Discarded packets |
| A | 0 | 1410 | 5 |
| B | 0 | 1455 | 0 |
| C | 0 | 1291 | 2 |
| D | 0 | 1309 | 4 |
| Quadrant | Total seconds | Saturated seconds | Saturation percentage |
|---|---|---|---|
| A | 367 | 0 | 0.000000% |
| B | 367 | 0 | 0.000000% |
| C | 367 | 0 | 0.000000% |
| D | 367 | 0 | 0.000000% |
Noise dominated data is calculated using 1-second bins in cleaned event files. If a bin has >2000 counts, and if more than 50% of those come from <1% of pixels, then it is considered to be noise-dominated and hence unusable.
| Quadrant | # 1 sec bins | Bins with >0 counts | Bins with >2000 counts | High rate bins dominated by noise | Noise dominated (total time) | Noise dominated (detector-on time) | Marked lightcurve |
|---|---|---|---|---|---|---|---|
| A | 367 | 367 | 2 | 2 | 0.54% | 0.54% | 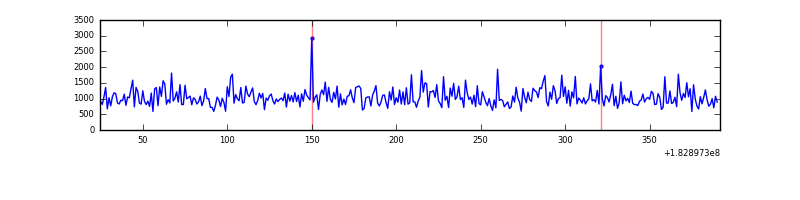 |
| B | 367 | 367 | 3 | 3 | 0.82% | 0.82% | 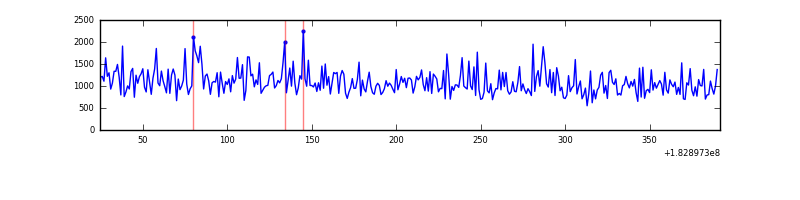 |
| C | 367 | 367 | 0 | 0 | 0.00% | 0.00% | 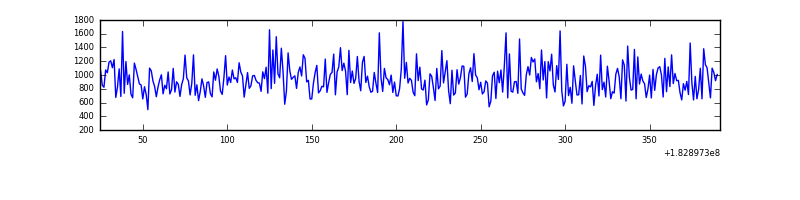 |
| D | 367 | 367 | 1 | 1 | 0.27% | 0.27% |  |
Top three noisy pixels from each quadrant. If the there are fewer than three noisy pixels in the level2.evt file, extra rows are filled as -1
| Pixel properties | Quadrant properties | ||||||
|---|---|---|---|---|---|---|---|
| Quadrant | DetID | PixID | Counts | Sigma | Mean | Median | Sigma |
| A | 8 | 65 | 1453 | 57.93 | 98 | 97 | 23.4 |
| A | 15 | 4 | 703 | 25.89 | 98 | 97 | 23.4 |
| A | 0 | 69 | 694 | 25.5 | 98 | 97 | 23.4 |
| B | 15 | 80 | 8745 | 344.48 | 100 | 101 | 25.1 |
| B | 8 | 54 | 4414 | 171.88 | 100 | 101 | 25.1 |
| B | 5 | 46 | 1910 | 72.09 | 100 | 101 | 25.1 |
| D | 1 | 5 | 10695 | 393.28 | 83 | 84 | 27.0 |
| D | 13 | 7 | 10117 | 371.85 | 83 | 84 | 27.0 |
| D | 13 | 117 | 3595 | 130.13 | 83 | 84 | 27.0 |
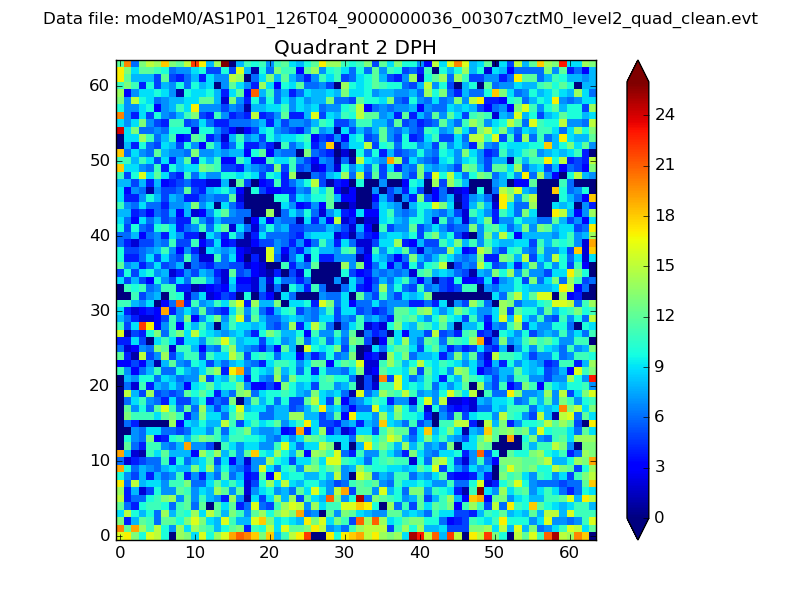
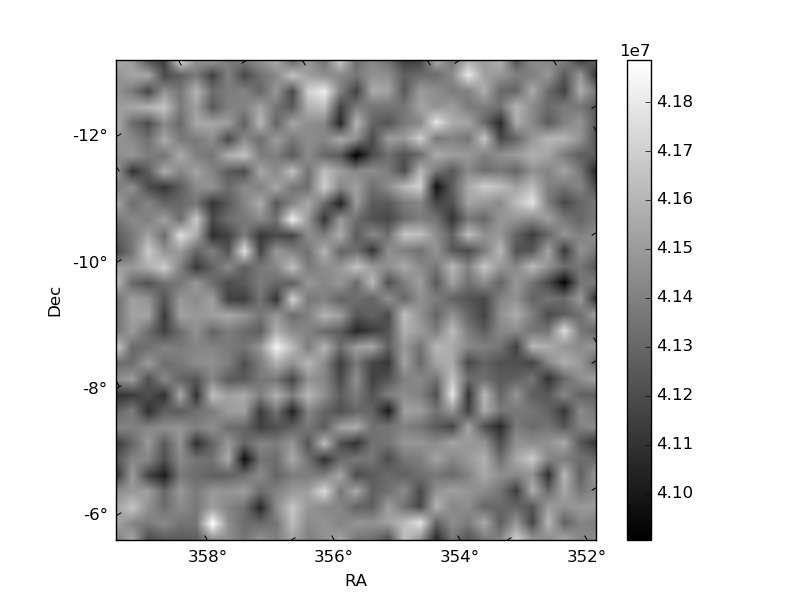
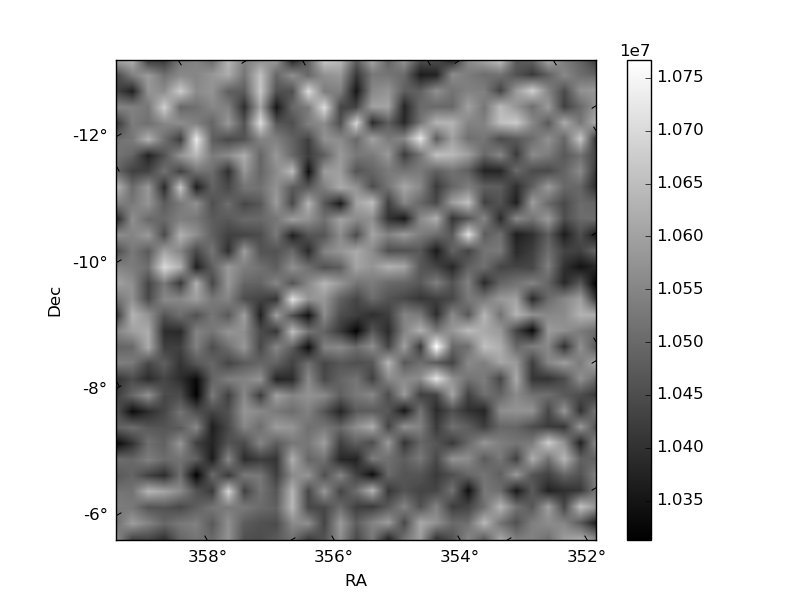
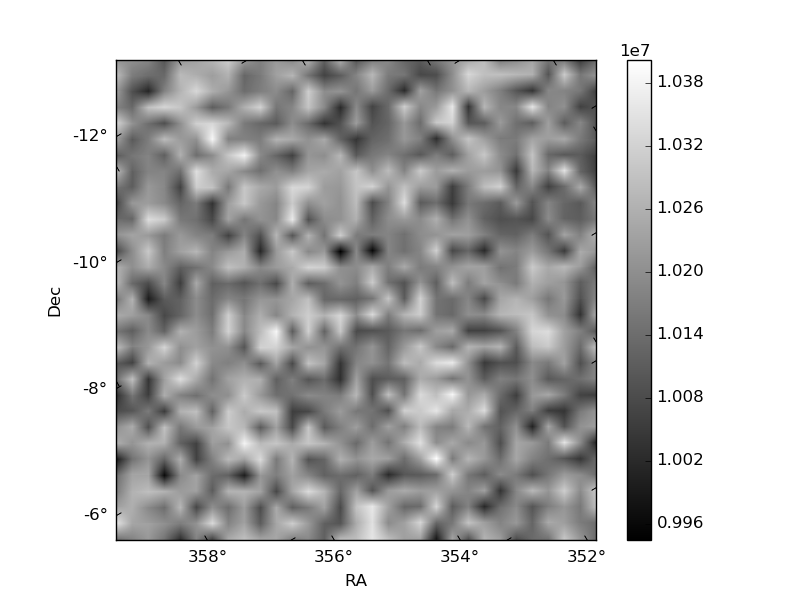
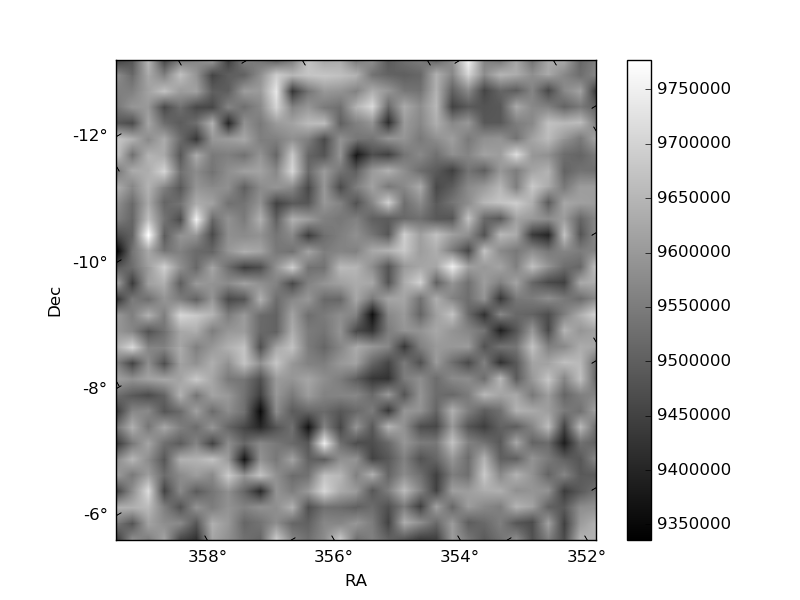
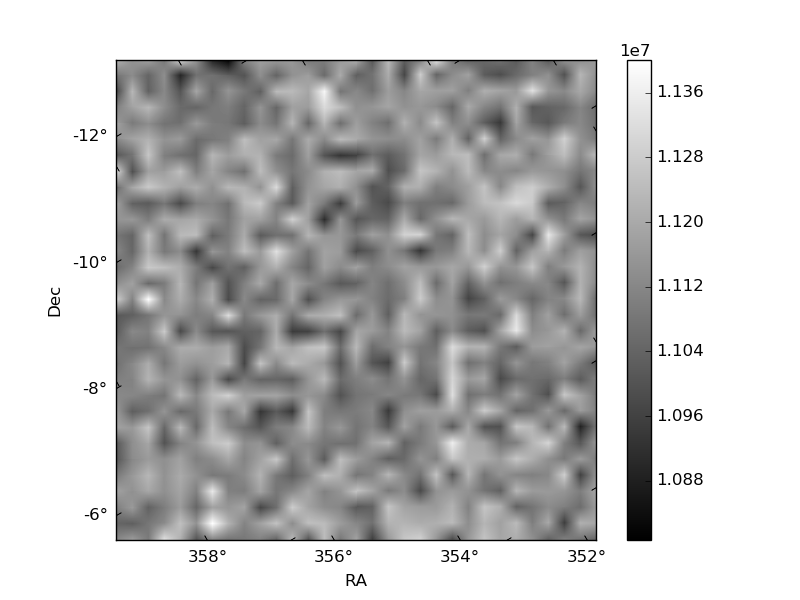
Histogram calculated using DETX and DETY for each event in the final _common_clean file
| Quadrant A | 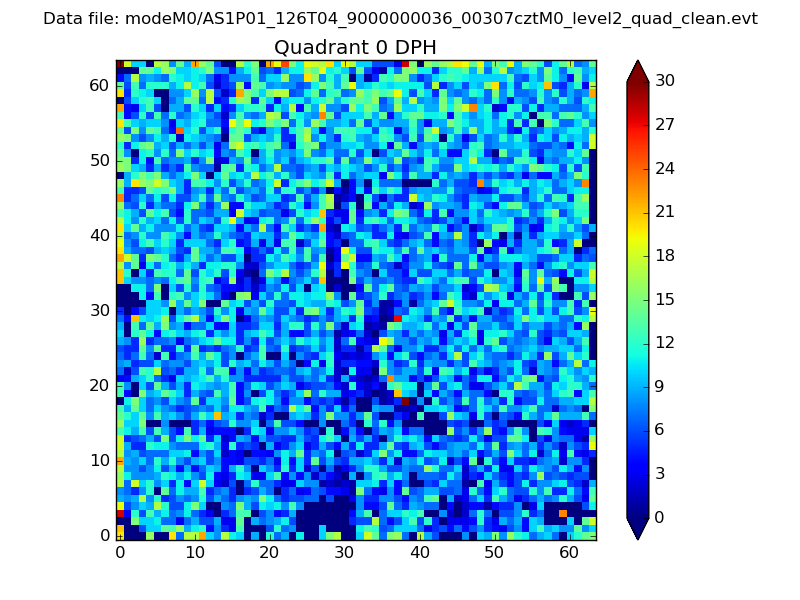 |
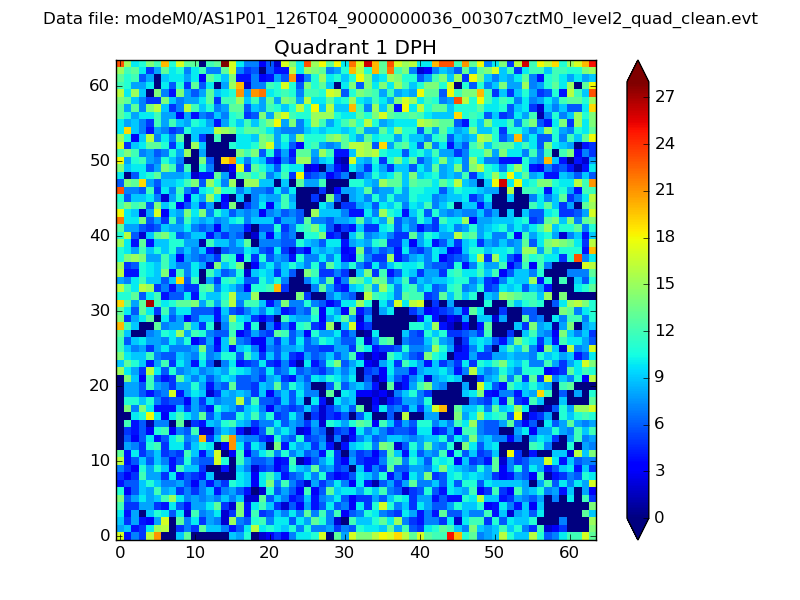 |
Quadrant B |
|---|---|---|---|
| Quadrant D | 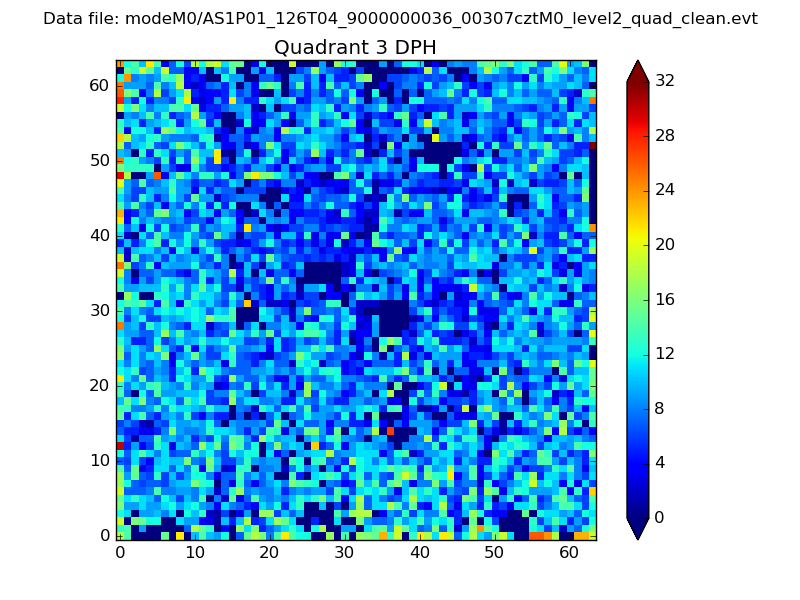 |
 |
Quadrant C |
| Plot type | Count rate plots | Images |
|---|---|---|
| Comparison with Poisson distribution Blue bars denote a histogram of data divided into 1 sec bins. Red curve is a Poisson curve with rate = median count rate of data. |
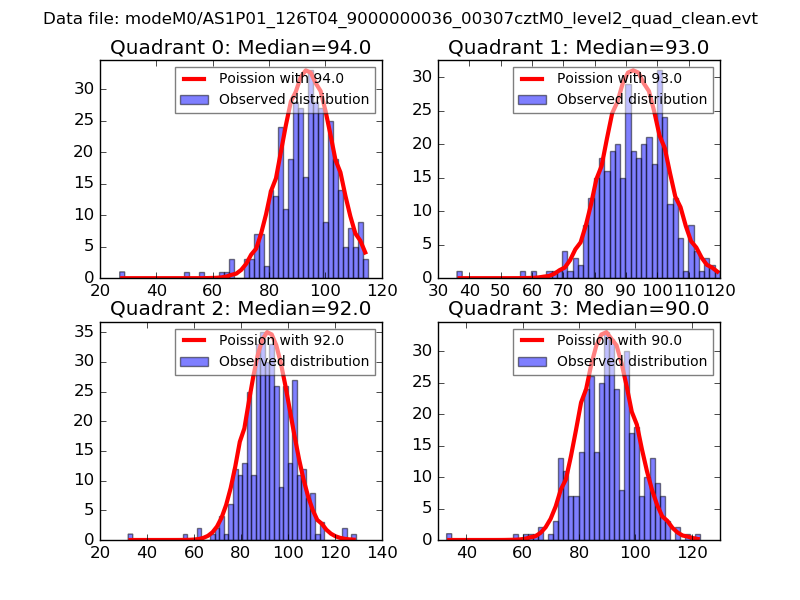 |
 |
| Quadrant-wise count rates Data is divided into 100 sec bins |
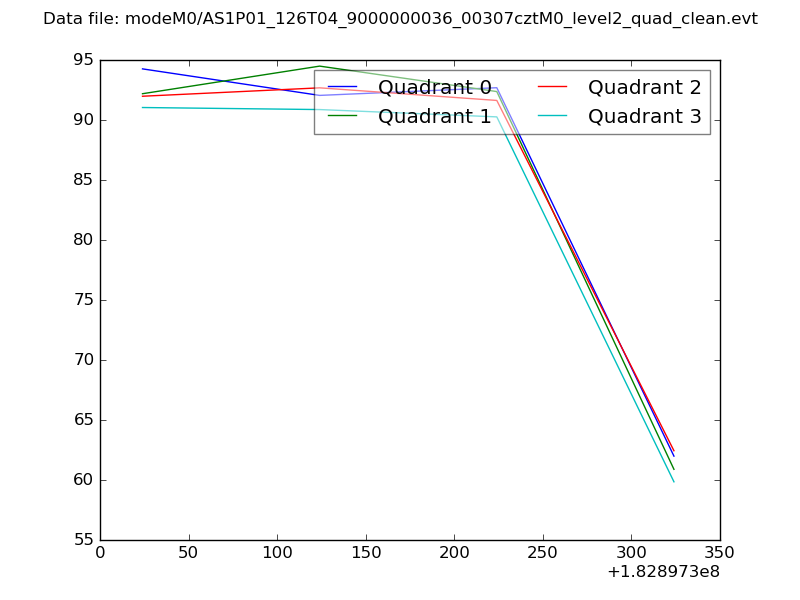 |
|
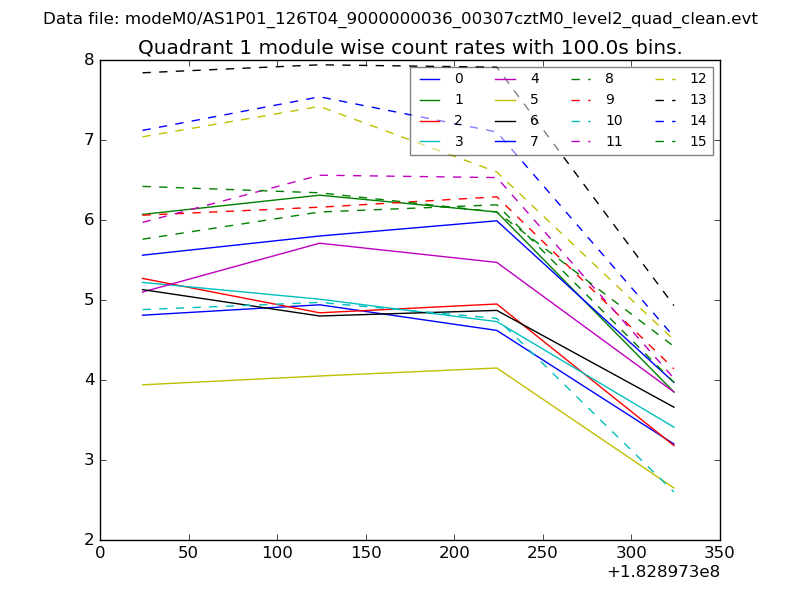
| Module-wise count rates for Quadrant A Data is divided into 100 sec bins |
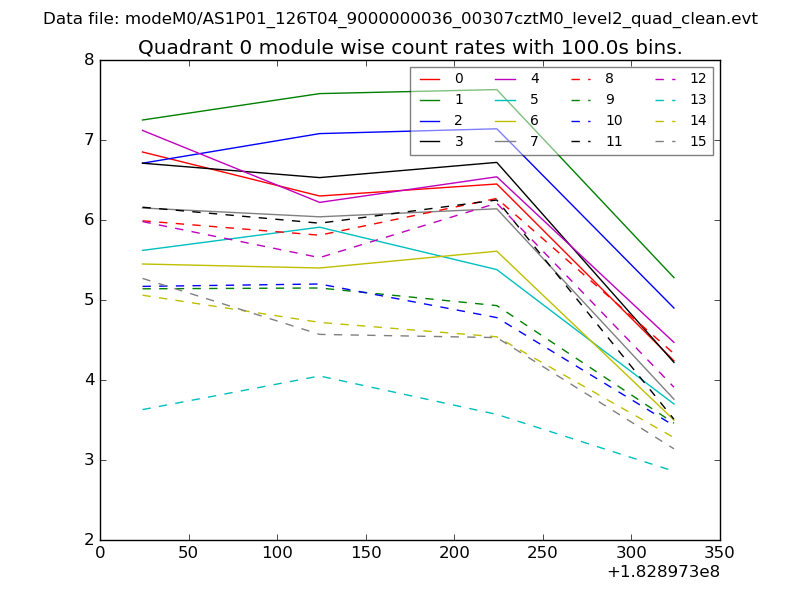 |
 |
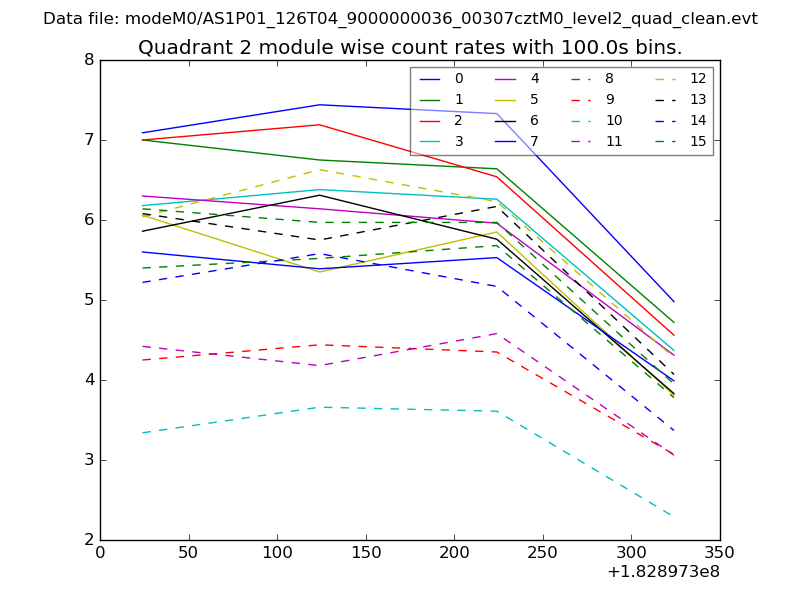
| Module-wise count rates for Quadrant B Data is divided into 100 sec bins |
 |
 |
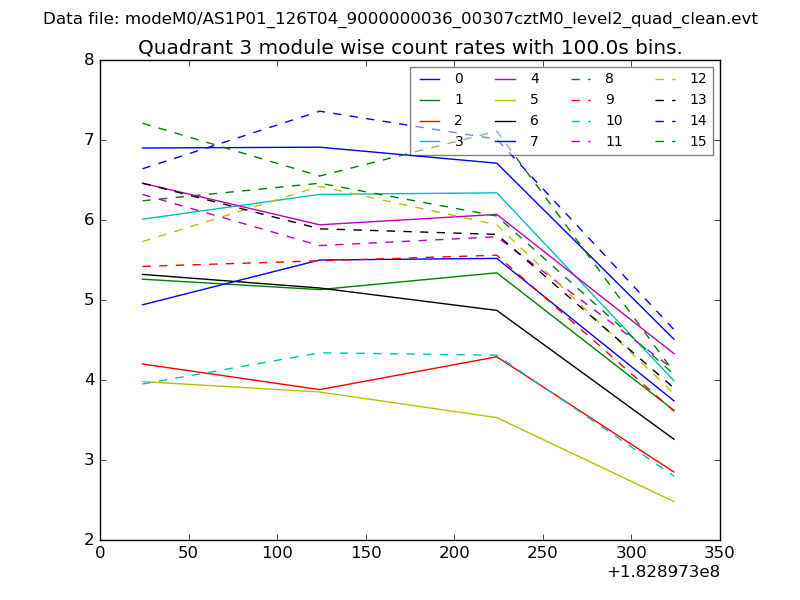
| Module-wise count rates for Quadrant C Data is divided into 100 sec bins |
 |
 |
| Module-wise count rates for Quadrant D Data is divided into 100 sec bins |
 |
 |
| Parameter | Plot |
|---|---|
| CZT HV Monitor | 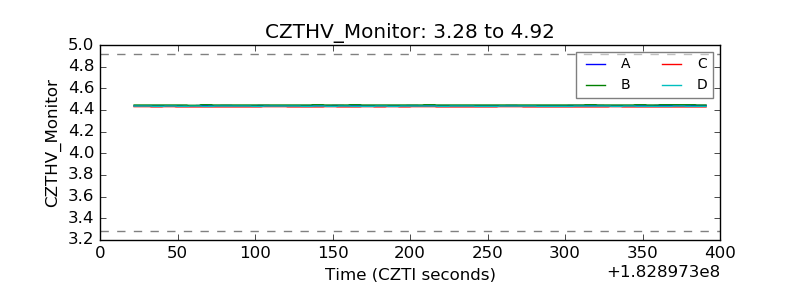 |
| D_VDD |  |
| Temperature 1 |  |
| Veto HV Monitor | 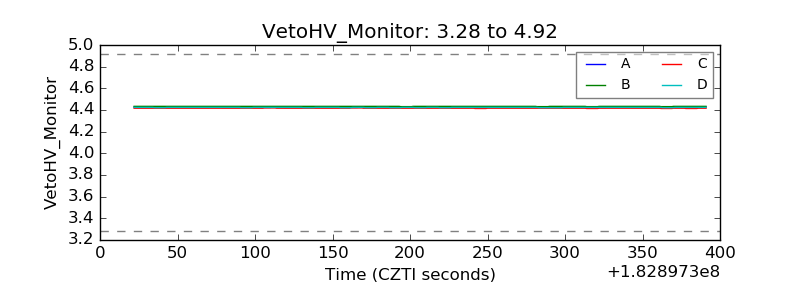 |
| Veto LLD | 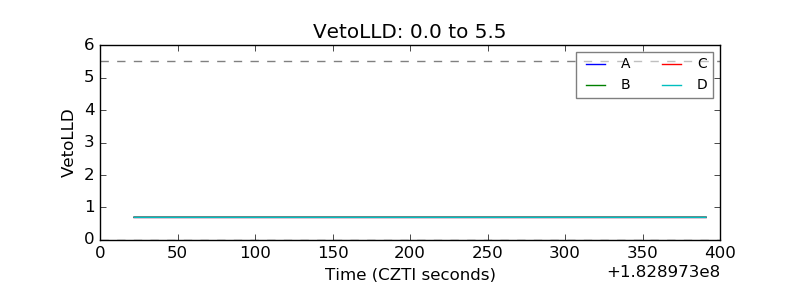 |
| Alpha Counter | 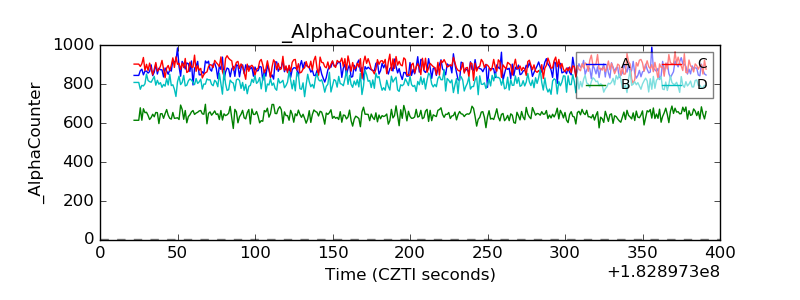 |
| _CPM_Rate | 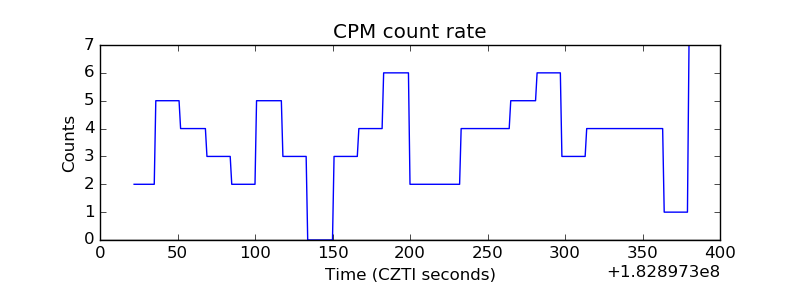 |
| CZT Counter | 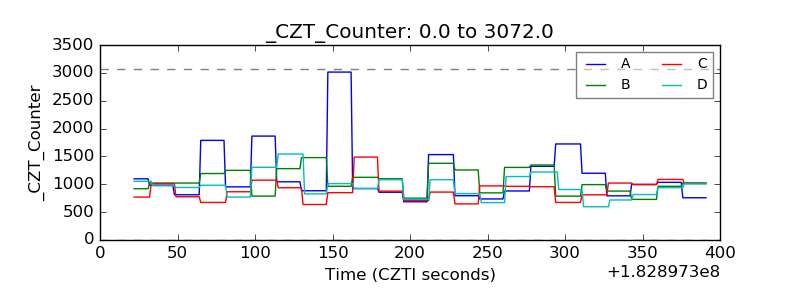 |
| +2.5 Volts monitor |  |
| +5 Volts monitor | 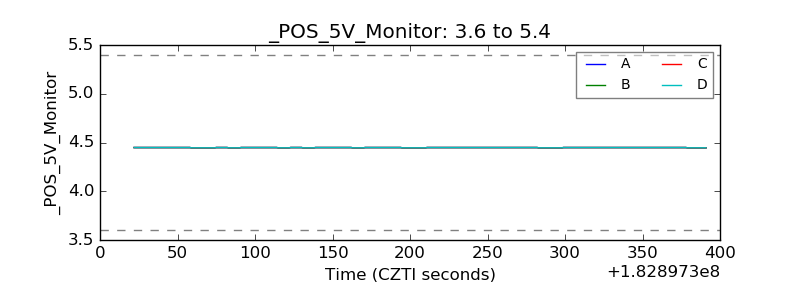 |
| _ROLL_ROT | 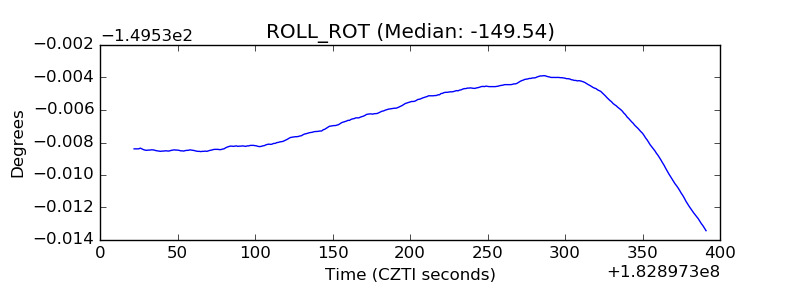 |
| _Roll_DEC | 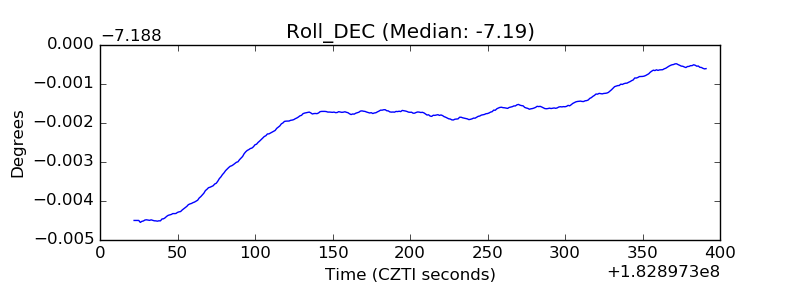 |
| _Roll_RA | 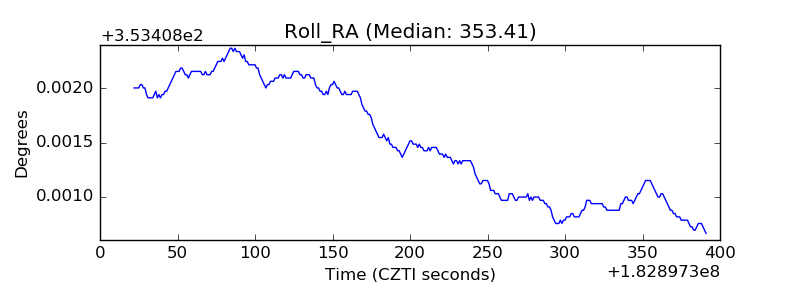 |
| Veto Counter | 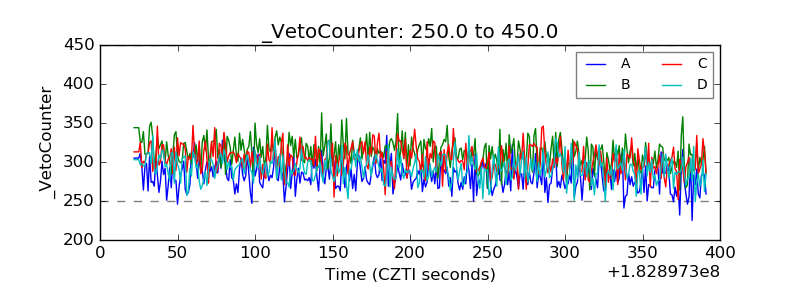 |