| Param | Original file | Final file |
|---|---|---|
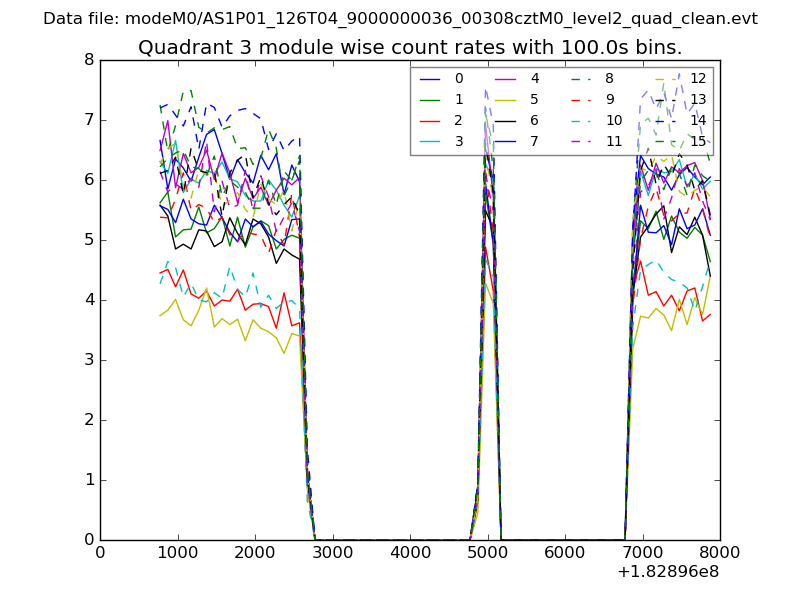
| Filename | modeM0/AS1P01_126T04_9000000036_00308cztM0_level2.evt | modeM0/AS1P01_126T04_9000000036_00308cztM0_level2_quad_clean.evt |
| Size (bytes) | 798,710,400 | 51,272,640 |
| Size | 761.7 MB | 48.9 MB |
| Events in quadrant A | 6,195,078 | 295,356 |
| Events in quadrant B | 6,205,869 | 296,996 |
| Events in quadrant C | 5,777,282 | 291,505 |
| Events in quadrant D | 5,646,198 | 285,524 |
| Mode M9 | |||
|---|---|---|---|
| Quadrant | BADHDUFLAG | Total packets | Discarded packets |
| A | 0 | 17 | 0 |
| B | 0 | 17 | 0 |
| C | 0 | 17 | 0 |
| D | 0 | 17 | 0 |
| Mode SS | |||
|---|---|---|---|
| Quadrant | BADHDUFLAG | Total packets | Discarded packets |
| A | 0 | 112 | 0 |
| B | 0 | 112 | 0 |
| C | 0 | 112 | 0 |
| D | 0 | 112 | 0 |
| Mode M0 | |||
|---|---|---|---|
| Quadrant | BADHDUFLAG | Total packets | Discarded packets |
| A | 0 | 22282 | 2 |
| B | 0 | 22341 | 1 |
| C | 0 | 21067 | 1 |
| D | 0 | 20710 | 1 |
| Quadrant | Total seconds | Saturated seconds | Saturation percentage |
|---|---|---|---|
| A | 5464 | 4 | 0.073206% |
| B | 5464 | 2 | 0.036603% |
| C | 5464 | 1 | 0.018302% |
| D | 5464 | 9 | 0.164714% |
Noise dominated data is calculated using 1-second bins in cleaned event files. If a bin has >2000 counts, and if more than 50% of those come from <1% of pixels, then it is considered to be noise-dominated and hence unusable.
| Quadrant | # 1 sec bins | Bins with >0 counts | Bins with >2000 counts | High rate bins dominated by noise | Noise dominated (total time) | Noise dominated (detector-on time) | Marked lightcurve |
|---|---|---|---|---|---|---|---|
| A | 7199 | 5465 | 110 | 110 | 1.53% | 2.01% | 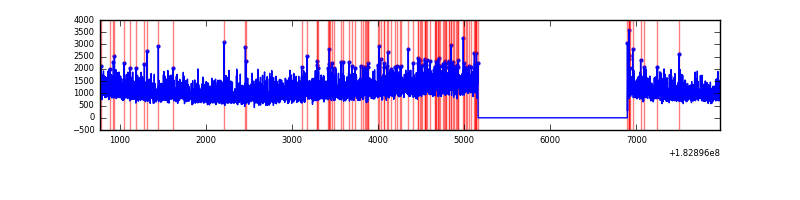 |
| B | 7199 | 5465 | 66 | 66 | 0.92% | 1.21% | 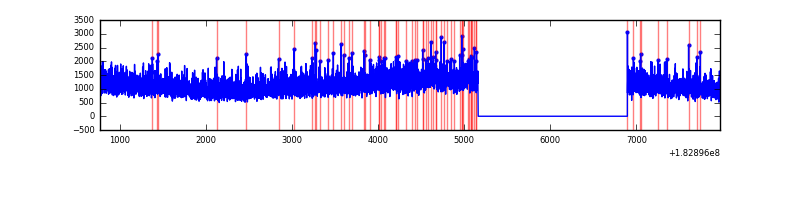 |
| C | 7199 | 5465 | 40 | 40 | 0.56% | 0.73% | 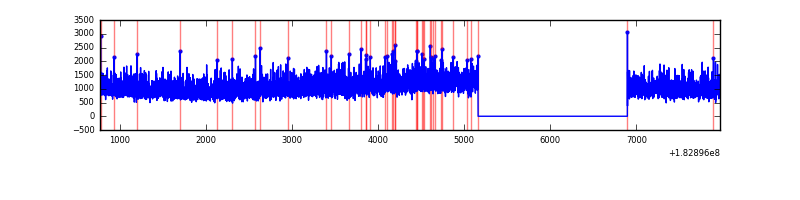 |
| D | 7199 | 5465 | 47 | 47 | 0.65% | 0.86% | 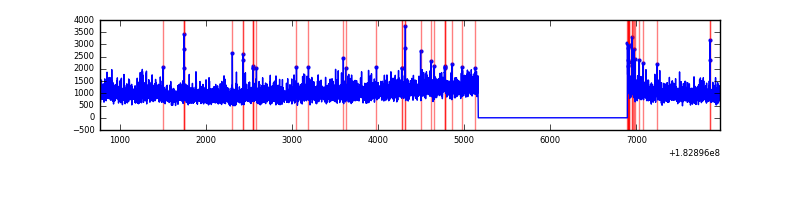 |
Top three noisy pixels from each quadrant. If the there are fewer than three noisy pixels in the level2.evt file, extra rows are filled as -1
| Pixel properties | Quadrant properties | ||||||
|---|---|---|---|---|---|---|---|
| Quadrant | DetID | PixID | Counts | Sigma | Mean | Median | Sigma |
| A | 0 | 69 | 46531 | 128.17 | 1588 | 1574 | 350.7 |
| A | 13 | 239 | 5915 | 12.38 | 1588 | 1574 | 350.7 |
| A | 15 | 4 | 4910 | 9.51 | 1588 | 1574 | 350.7 |
| B | 15 | 80 | 21507 | 52.94 | 1606 | 1615 | 375.7 |
| B | 8 | 54 | 15866 | 37.93 | 1606 | 1615 | 375.7 |
| B | 5 | 46 | 15038 | 35.73 | 1606 | 1615 | 375.7 |
| C | 10 | 19 | 13902 | 30.12 | 1460 | 1513 | 411.4 |
| C | 2 | 192 | 8729 | 17.54 | 1460 | 1513 | 411.4 |
| C | 1 | 1 | 7901 | 15.53 | 1460 | 1513 | 411.4 |
| D | 13 | 7 | 86388 | 194.34 | 1386 | 1441 | 437.1 |
| D | 13 | 216 | 59894 | 133.73 | 1386 | 1441 | 437.1 |
| D | 1 | 5 | 50219 | 111.59 | 1386 | 1441 | 437.1 |
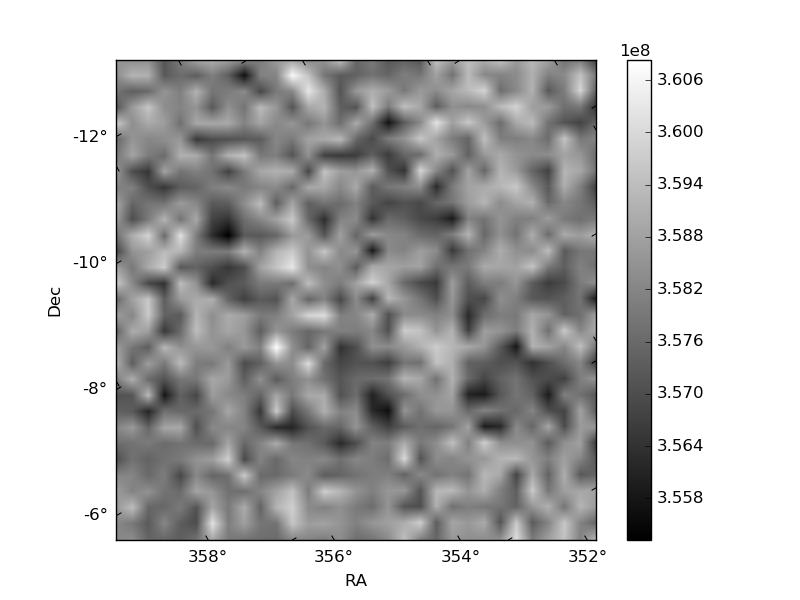
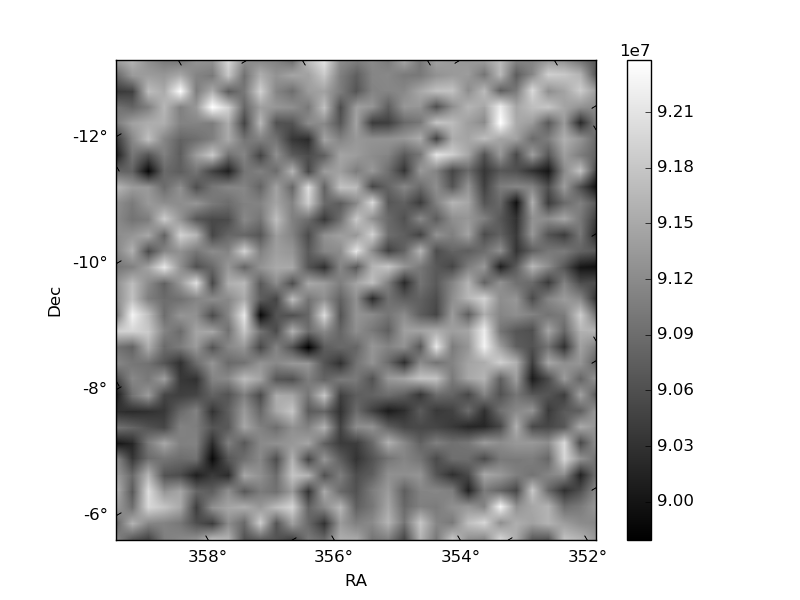
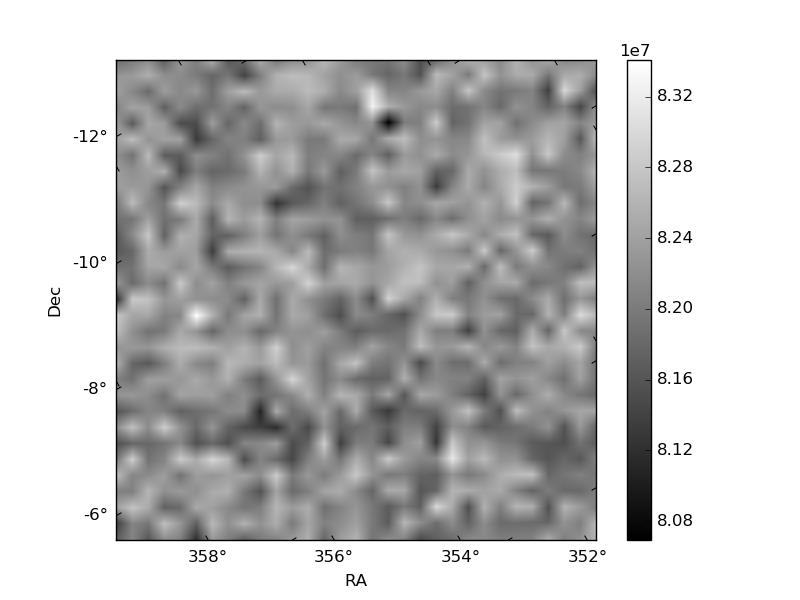
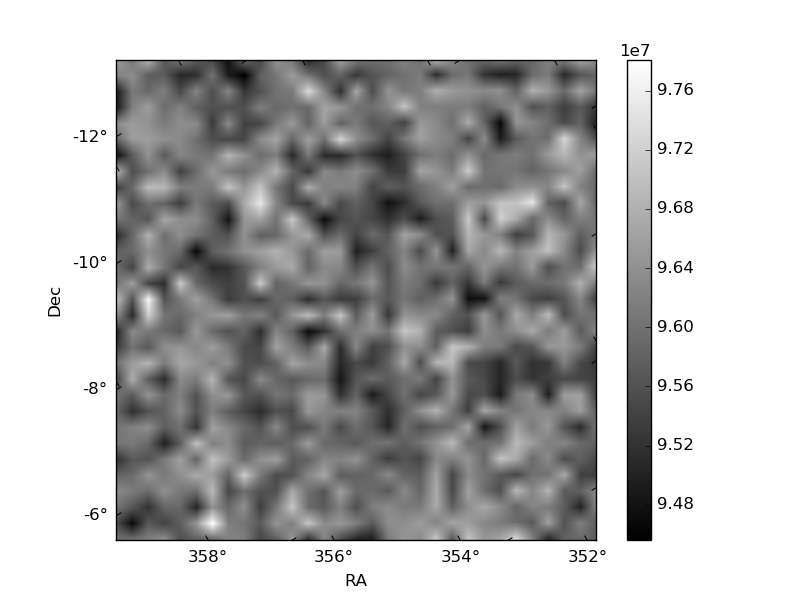
Histogram calculated using DETX and DETY for each event in the final _common_clean file
| Quadrant A | 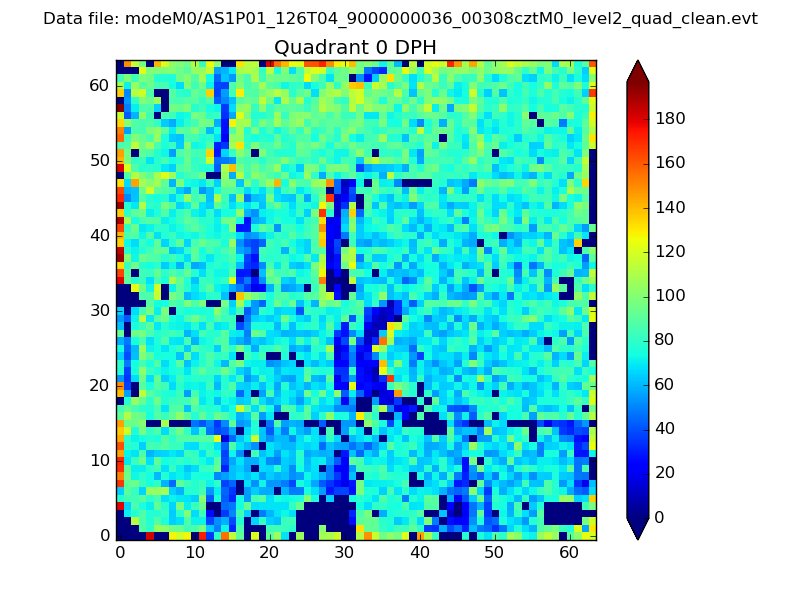 |
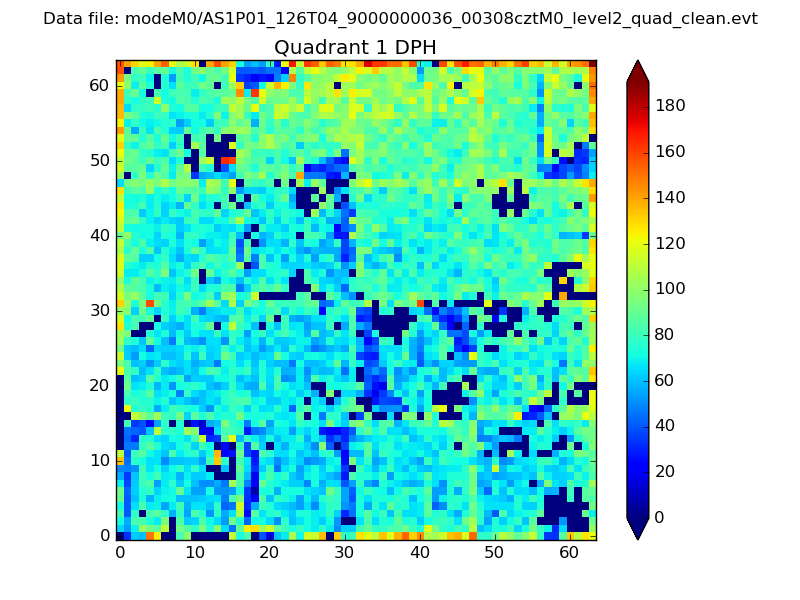 |
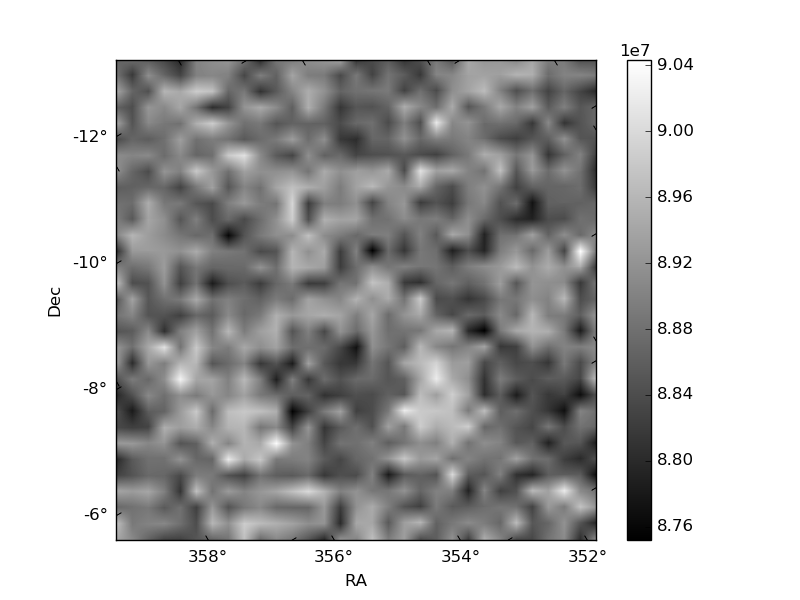
Quadrant B |
|---|---|---|---|
| Quadrant D | 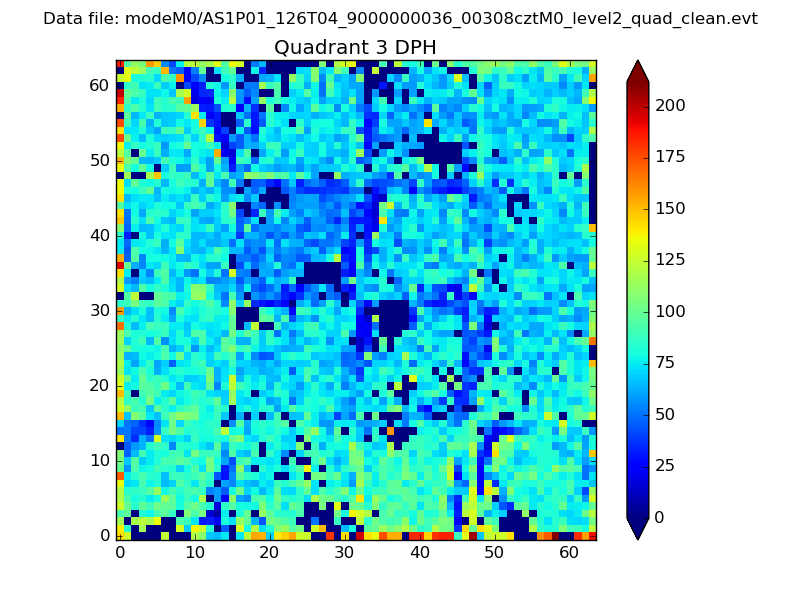 |
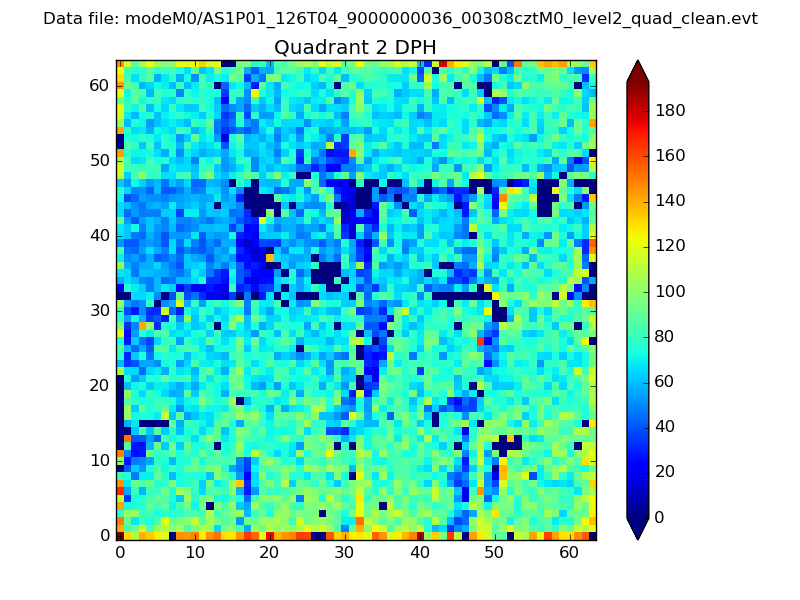 |
Quadrant C |
| Plot type | Count rate plots | Images |
|---|---|---|
| Comparison with Poisson distribution Blue bars denote a histogram of data divided into 1 sec bins. Red curve is a Poisson curve with rate = median count rate of data. |
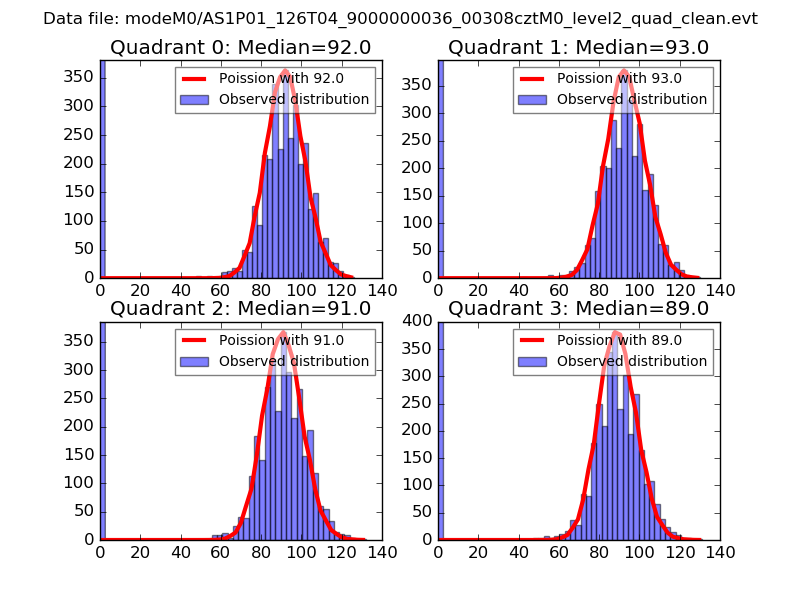 |
 |
| Quadrant-wise count rates Data is divided into 100 sec bins |
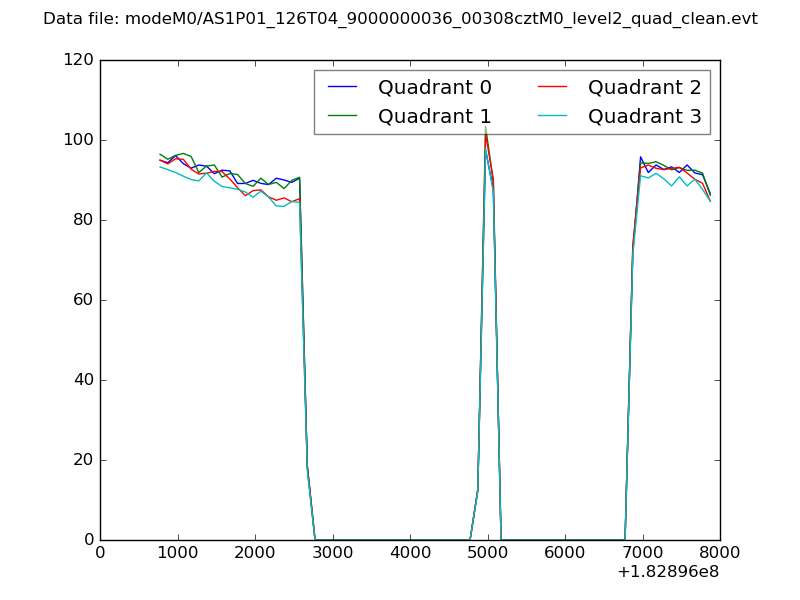 |
|
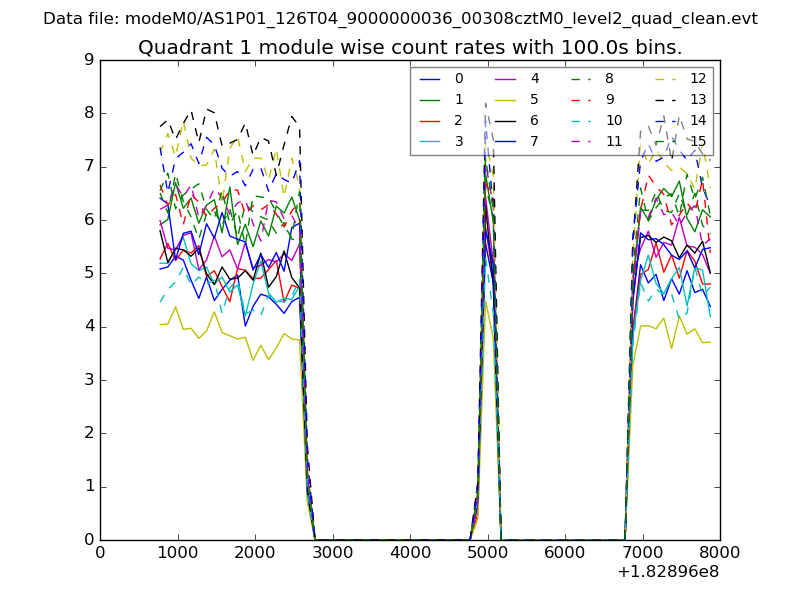
| Module-wise count rates for Quadrant A Data is divided into 100 sec bins |
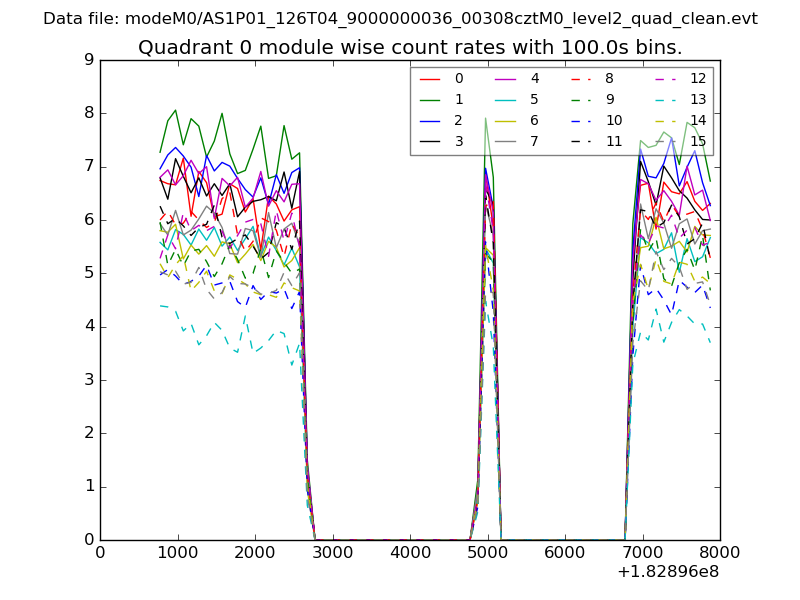 |
 |
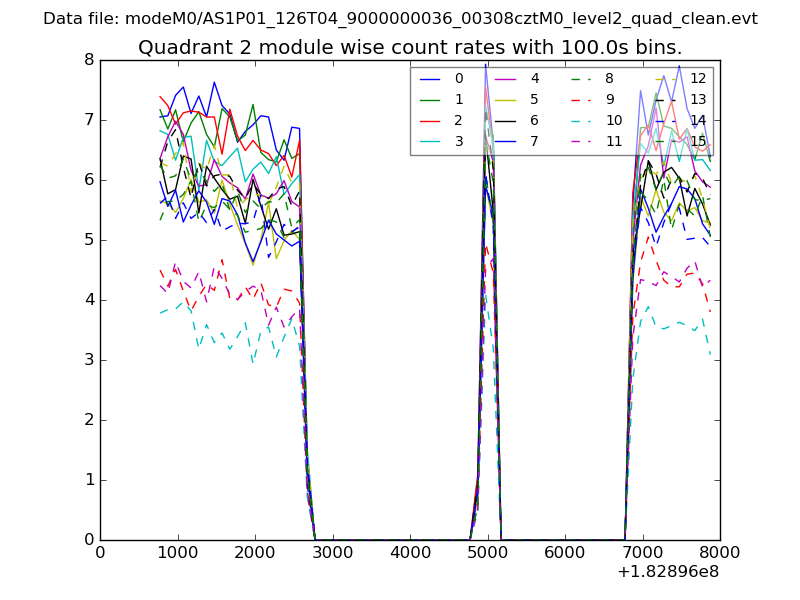
| Module-wise count rates for Quadrant B Data is divided into 100 sec bins |
 |
 |
| Module-wise count rates for Quadrant C Data is divided into 100 sec bins |
 |
 |
| Module-wise count rates for Quadrant D Data is divided into 100 sec bins |
 |
 |
| Parameter | Plot |
|---|---|
| CZT HV Monitor | 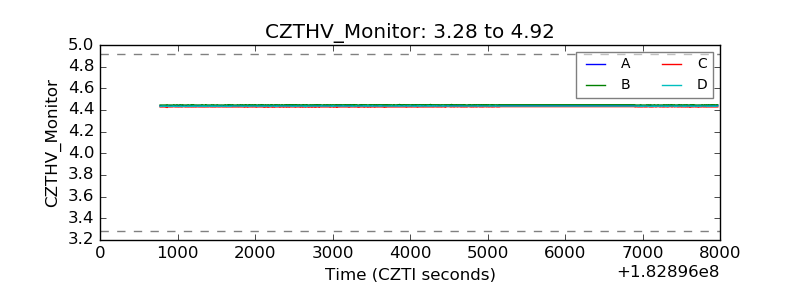 |
| D_VDD | 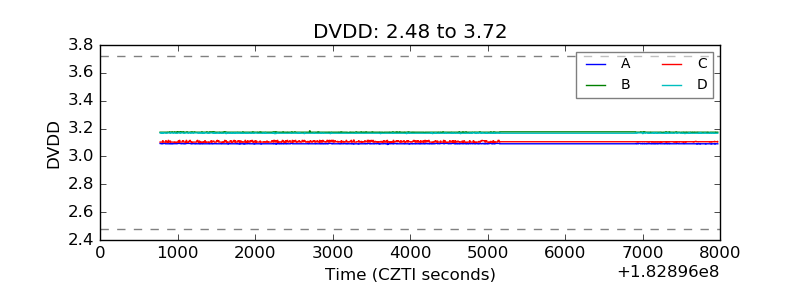 |
| Temperature 1 | 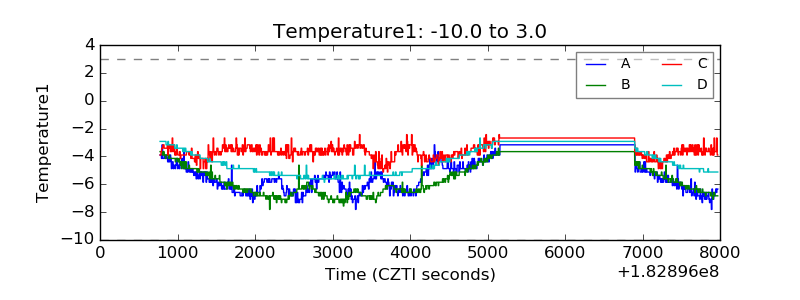 |
| Veto HV Monitor | 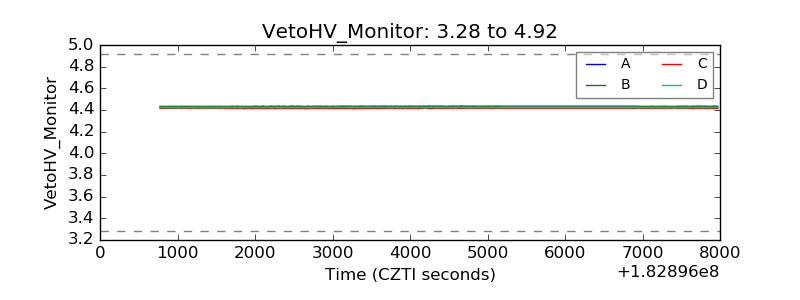 |
| Veto LLD | 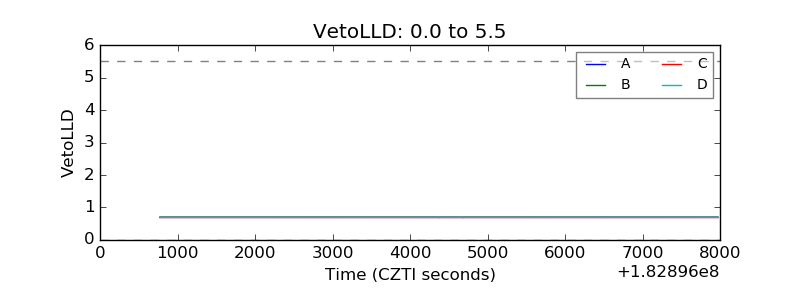 |
| Alpha Counter | 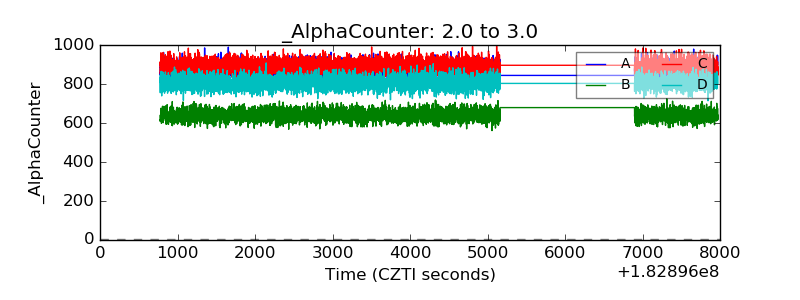 |
| _CPM_Rate | 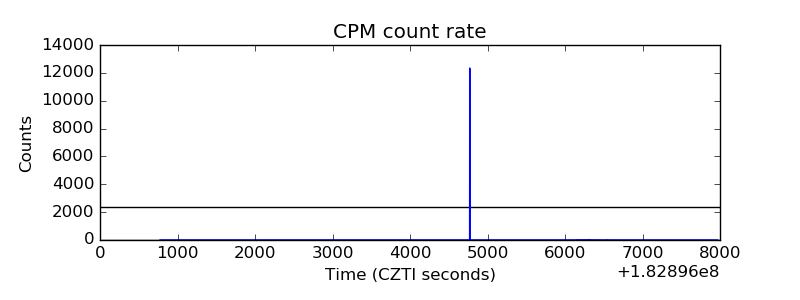 |
| CZT Counter | 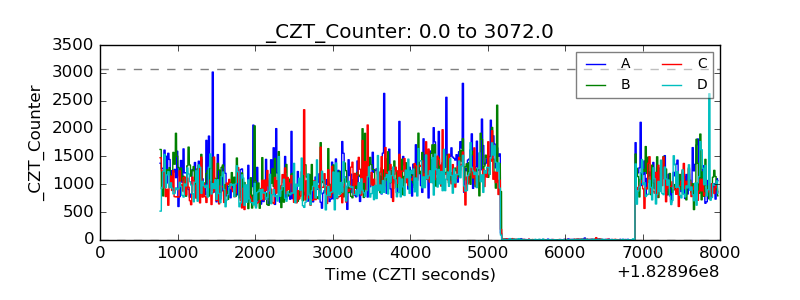 |
| +2.5 Volts monitor |  |
| +5 Volts monitor | 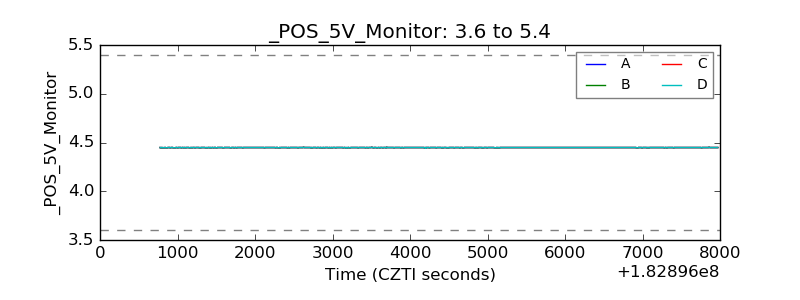 |
| _ROLL_ROT | 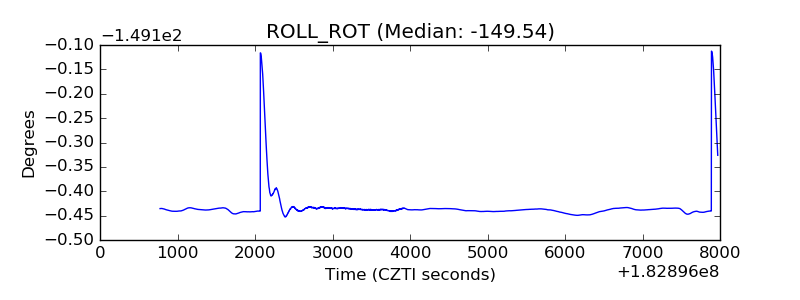 |
| _Roll_DEC | 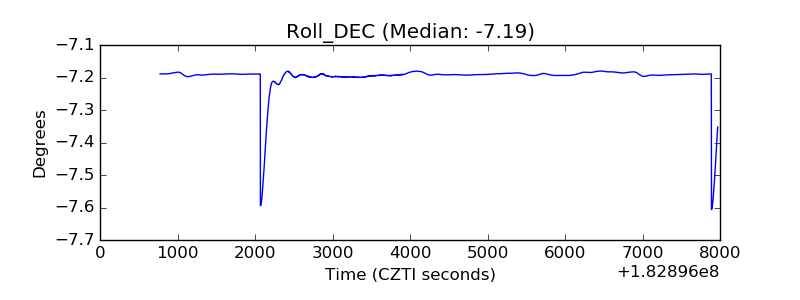 |
| _Roll_RA | 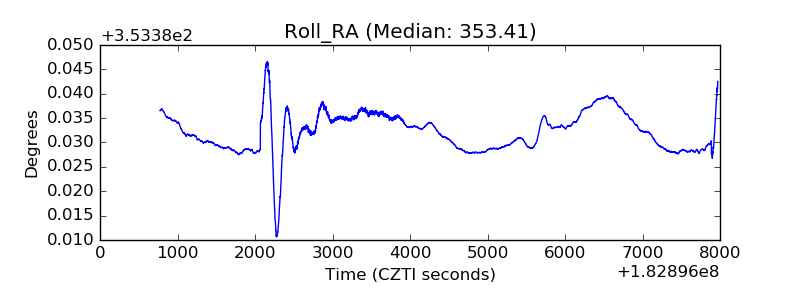 |
| Veto Counter | 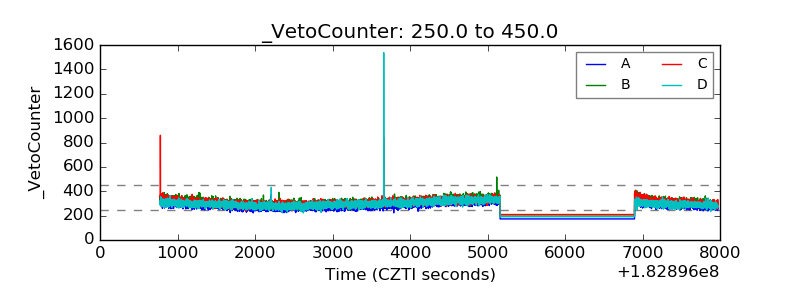 |