| Param | Original file | Final file |
|---|---|---|
| Filename | modeM0/AS1P01_126T04_9000000036_00309cztM0_level2.evt | modeM0/AS1P01_126T04_9000000036_00309cztM0_level2_quad_clean.evt |
| Size (bytes) | 752,348,160 | 44,703,360 |
| Size | 717.5 MB | 42.6 MB |
| Events in quadrant A | 5,829,261 | 252,464 |
| Events in quadrant B | 5,769,240 | 255,139 |
| Events in quadrant C | 5,711,836 | 249,277 |
| Events in quadrant D | 5,140,015 | 244,324 |
| Mode M9 | |||
|---|---|---|---|
| Quadrant | BADHDUFLAG | Total packets | Discarded packets |
| A | 0 | 23 | 0 |
| B | 0 | 23 | 0 |
| C | 0 | 23 | 0 |
| D | 0 | 23 | 0 |
| Mode SS | |||
|---|---|---|---|
| Quadrant | BADHDUFLAG | Total packets | Discarded packets |
| A | 0 | 102 | 0 |
| B | 0 | 102 | 0 |
| C | 0 | 102 | 0 |
| D | 0 | 102 | 0 |
| Mode M0 | |||
|---|---|---|---|
| Quadrant | BADHDUFLAG | Total packets | Discarded packets |
| A | 0 | 20867 | 2 |
| B | 0 | 20696 | 1 |
| C | 0 | 20578 | 1 |
| D | 0 | 18882 | 1 |
| Quadrant | Total seconds | Saturated seconds | Saturation percentage |
|---|---|---|---|
| A | 5019 | 11 | 0.219167% |
| B | 5019 | 2 | 0.039849% |
| C | 5019 | 4 | 0.079697% |
| D | 5019 | 8 | 0.159394% |
Noise dominated data is calculated using 1-second bins in cleaned event files. If a bin has >2000 counts, and if more than 50% of those come from <1% of pixels, then it is considered to be noise-dominated and hence unusable.
| Quadrant | # 1 sec bins | Bins with >0 counts | Bins with >2000 counts | High rate bins dominated by noise | Noise dominated (total time) | Noise dominated (detector-on time) | Marked lightcurve |
|---|---|---|---|---|---|---|---|
| A | 7265 | 5020 | 139 | 139 | 1.91% | 2.77% | 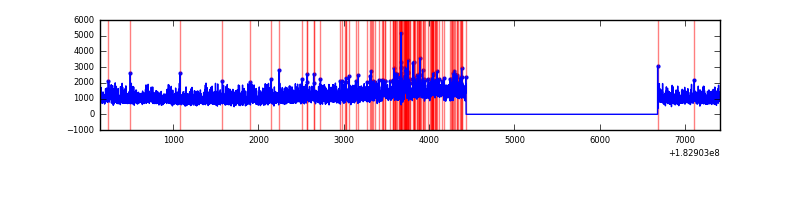 |
| B | 7265 | 5020 | 75 | 75 | 1.03% | 1.49% | 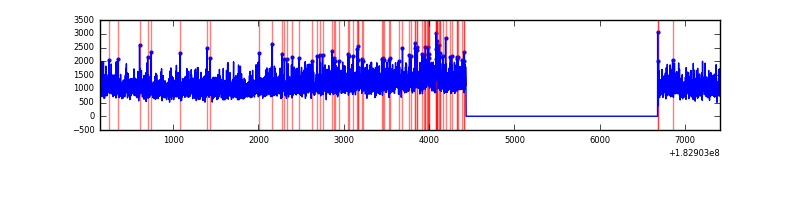 |
| C | 7265 | 5020 | 78 | 78 | 1.07% | 1.55% | 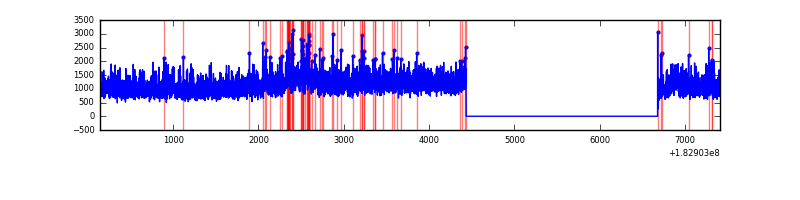 |
| D | 7265 | 5020 | 36 | 36 | 0.50% | 0.72% | 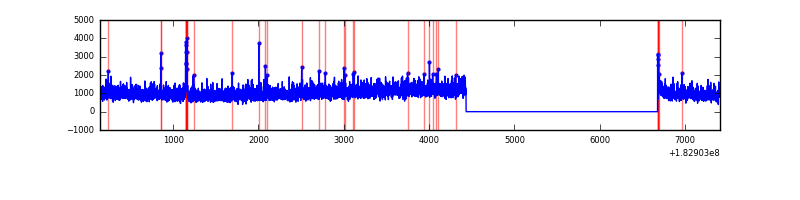 |
Top three noisy pixels from each quadrant. If the there are fewer than three noisy pixels in the level2.evt file, extra rows are filled as -1
| Pixel properties | Quadrant properties | ||||||
|---|---|---|---|---|---|---|---|
| Quadrant | DetID | PixID | Counts | Sigma | Mean | Median | Sigma |
| A | 0 | 69 | 162662 | 494.47 | 1463 | 1450 | 326.0 |
| A | 14 | 47 | 6680 | 16.04 | 1463 | 1450 | 326.0 |
| A | 13 | 239 | 5022 | 10.96 | 1463 | 1450 | 326.0 |
| B | 0 | 190 | 21226 | 56.03 | 1494 | 1506 | 351.9 |
| B | 0 | 183 | 13730 | 34.73 | 1494 | 1506 | 351.9 |
| B | 5 | 46 | 11981 | 29.76 | 1494 | 1506 | 351.9 |
| C | 1 | 1 | 221374 | 569.98 | 1369 | 1421 | 385.9 |
| C | 2 | 192 | 57904 | 146.37 | 1369 | 1421 | 385.9 |
| C | 3 | 159 | 39962 | 99.87 | 1369 | 1421 | 385.9 |
| D | 9 | 52 | 34975 | 81.95 | 1295 | 1345 | 410.4 |
| D | 13 | 7 | 29864 | 69.5 | 1295 | 1345 | 410.4 |
| D | 13 | 117 | 25143 | 57.99 | 1295 | 1345 | 410.4 |
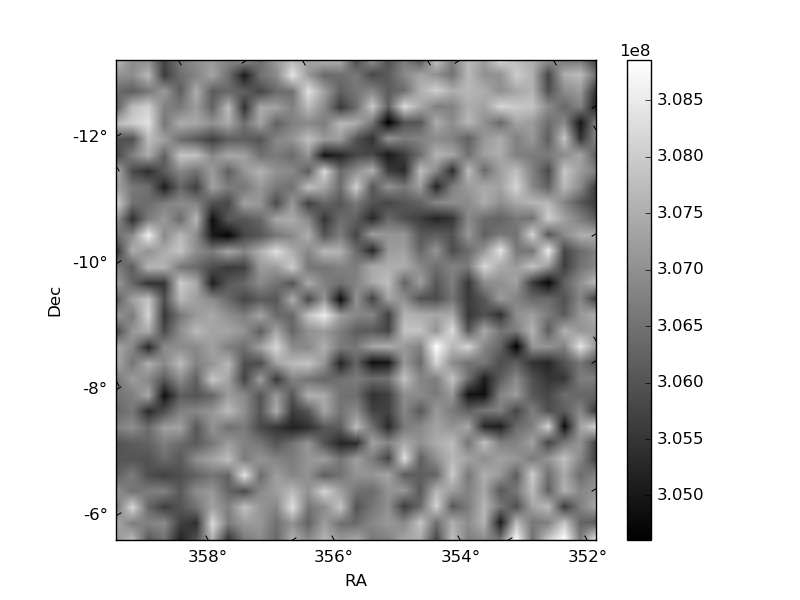
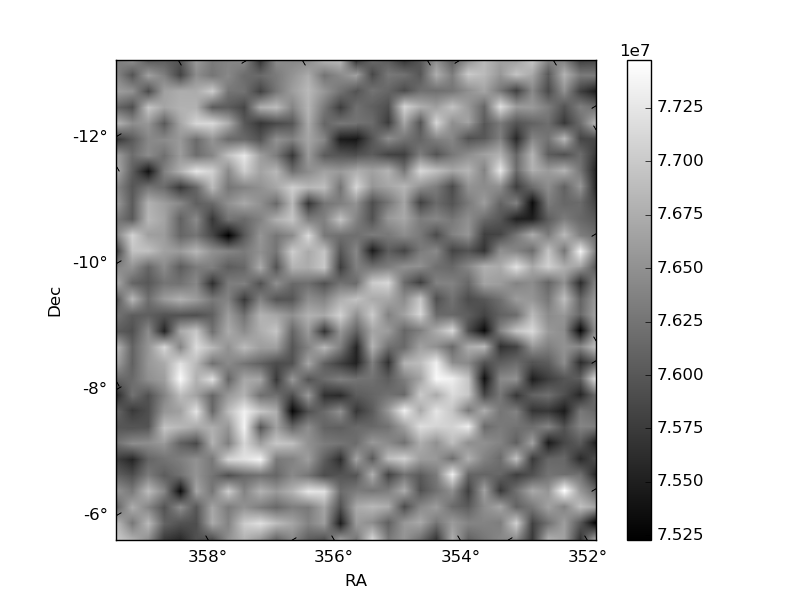
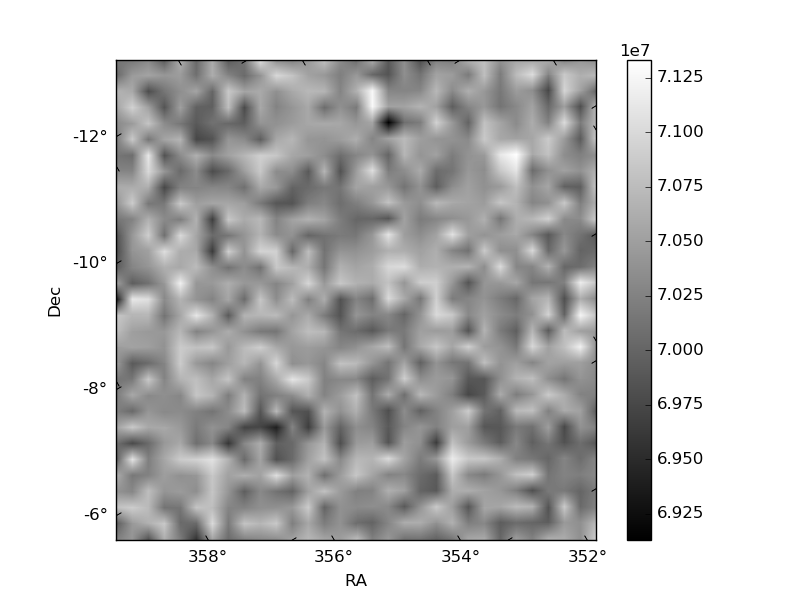
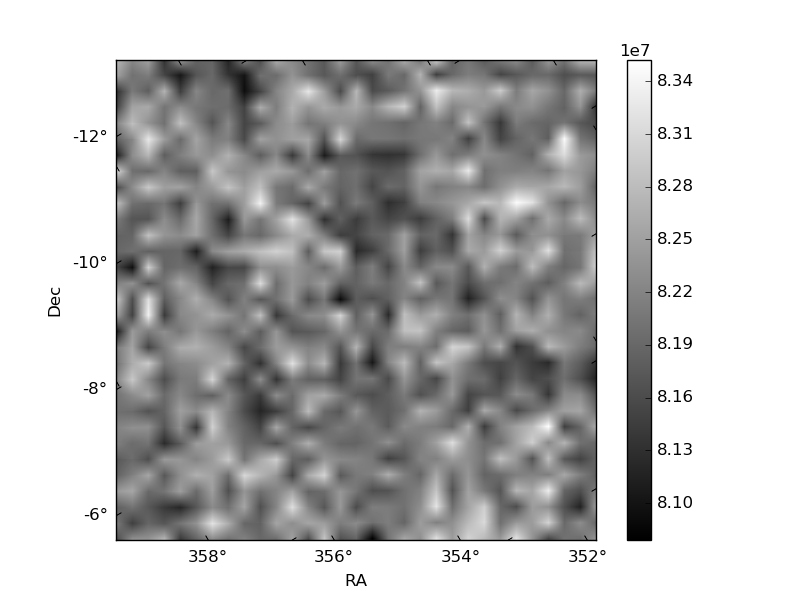
Histogram calculated using DETX and DETY for each event in the final _common_clean file
| Quadrant A | 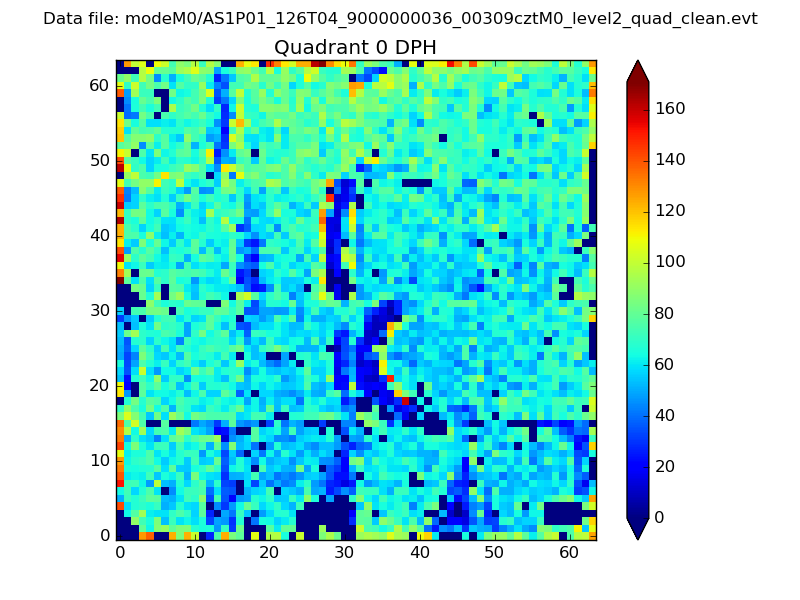 |
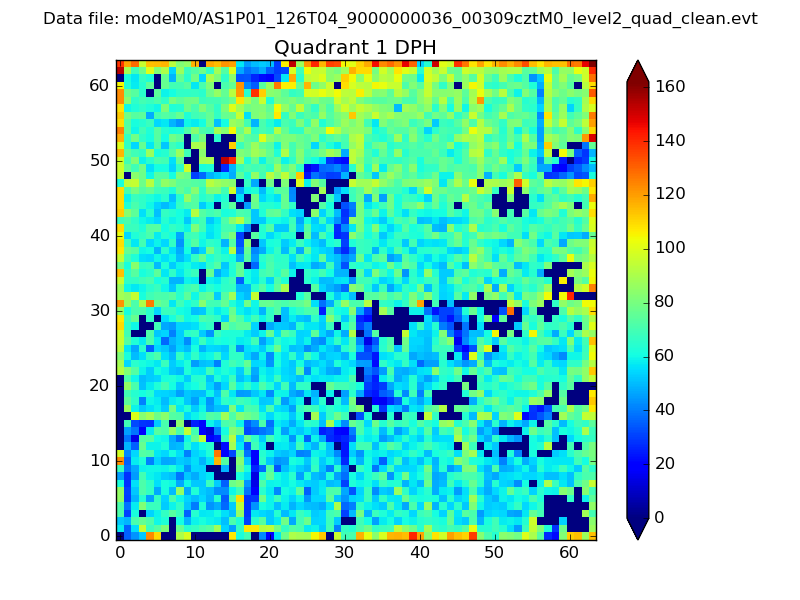 |
Quadrant B |
|---|---|---|---|
| Quadrant D | 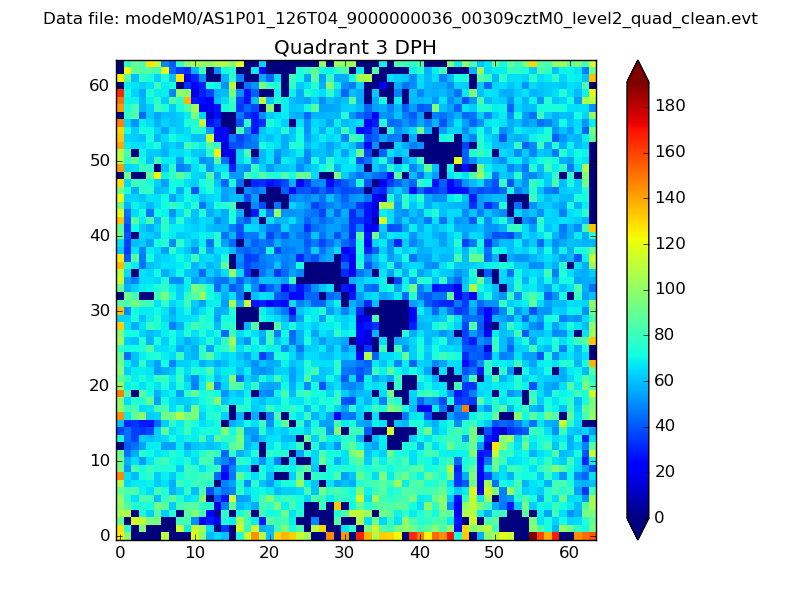 |
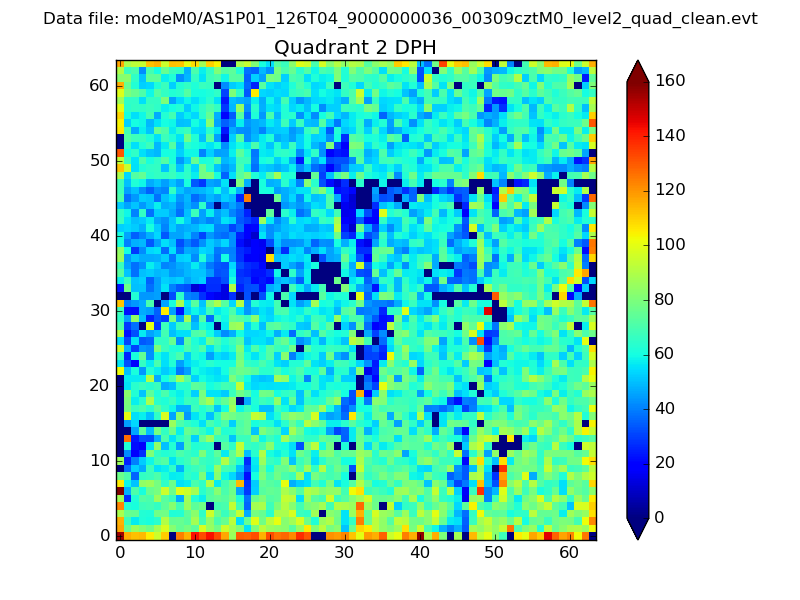 |
Quadrant C |
| Plot type | Count rate plots | Images |
|---|---|---|
| Comparison with Poisson distribution Blue bars denote a histogram of data divided into 1 sec bins. Red curve is a Poisson curve with rate = median count rate of data. |
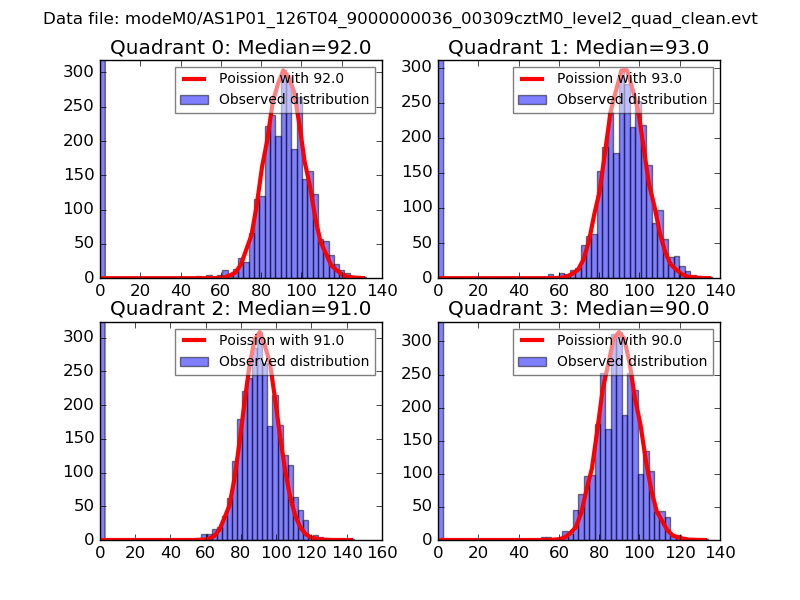 |
 |
| Quadrant-wise count rates Data is divided into 100 sec bins |
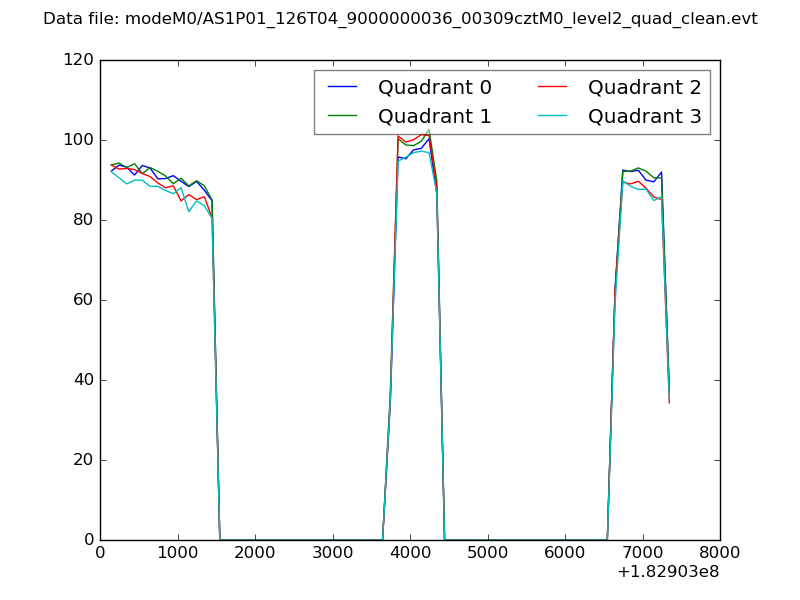 |
|
| Module-wise count rates for Quadrant A Data is divided into 100 sec bins |
 |
 |
| Module-wise count rates for Quadrant B Data is divided into 100 sec bins |
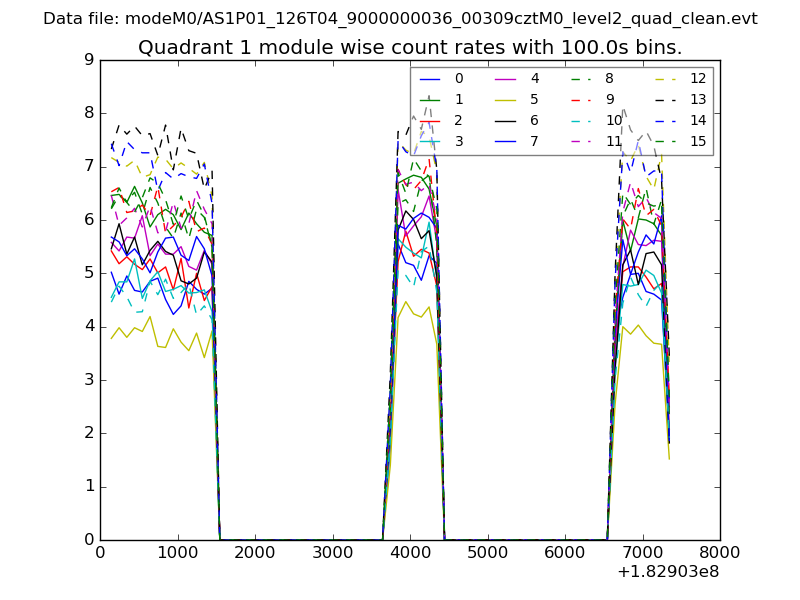 |
 |
| Module-wise count rates for Quadrant C Data is divided into 100 sec bins |
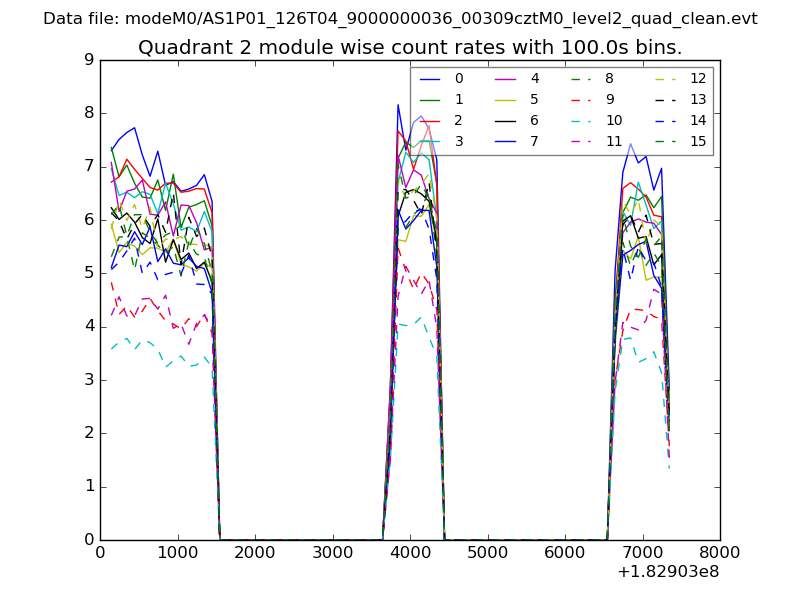 |
 |
| Module-wise count rates for Quadrant D Data is divided into 100 sec bins |
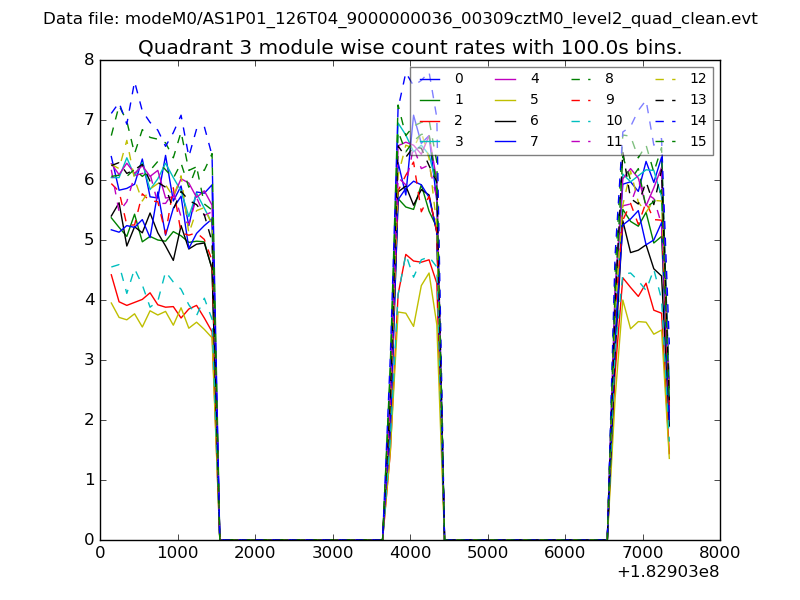 |
 |
| Parameter | Plot |
|---|---|
| CZT HV Monitor | 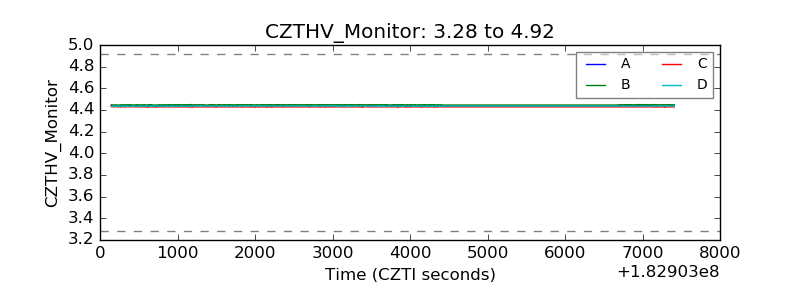 |
| D_VDD | 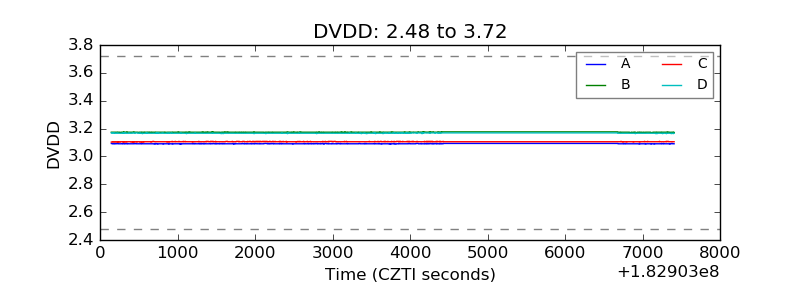 |
| Temperature 1 | 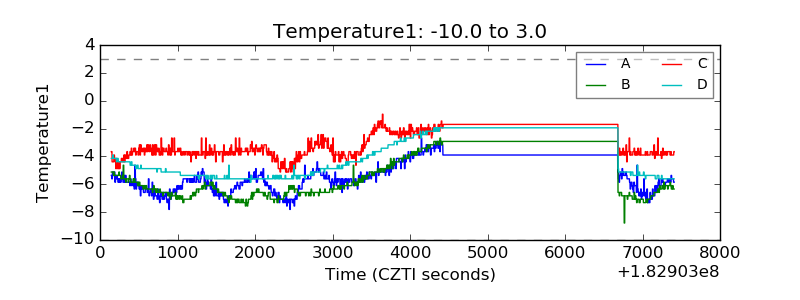 |
| Veto HV Monitor | 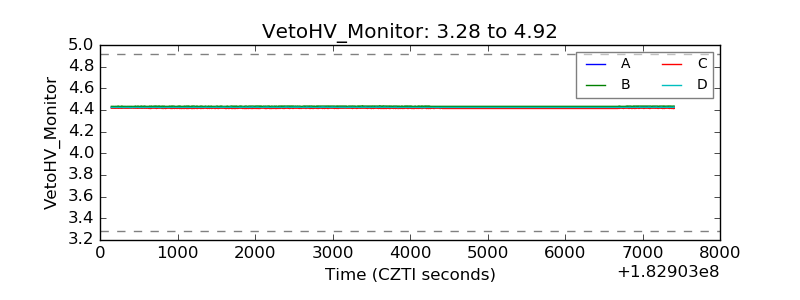 |
| Veto LLD | 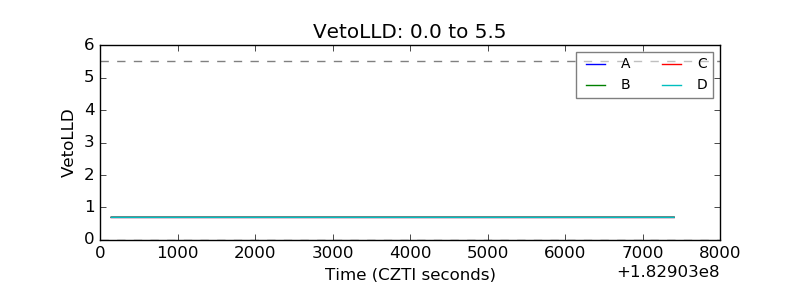 |
| Alpha Counter | 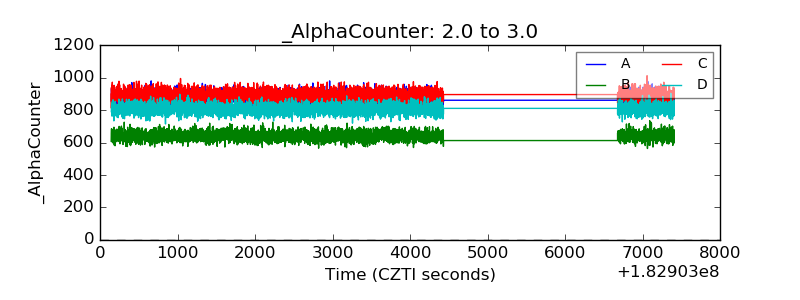 |
| _CPM_Rate | 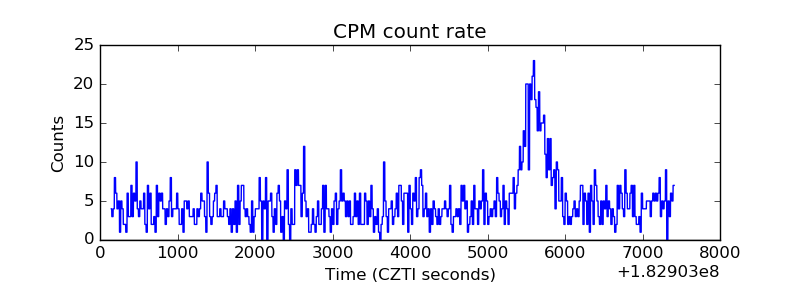 |
| CZT Counter | 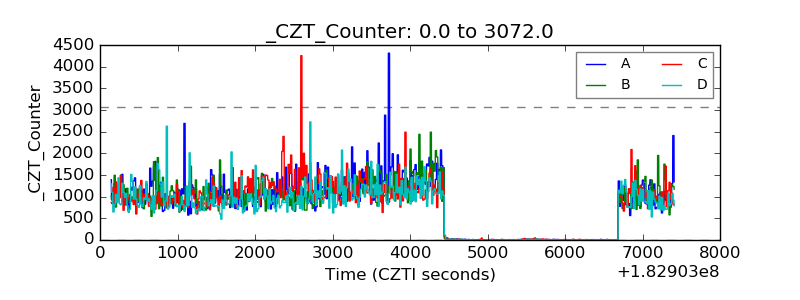 |
| +2.5 Volts monitor |  |
| +5 Volts monitor |  |
| _ROLL_ROT | 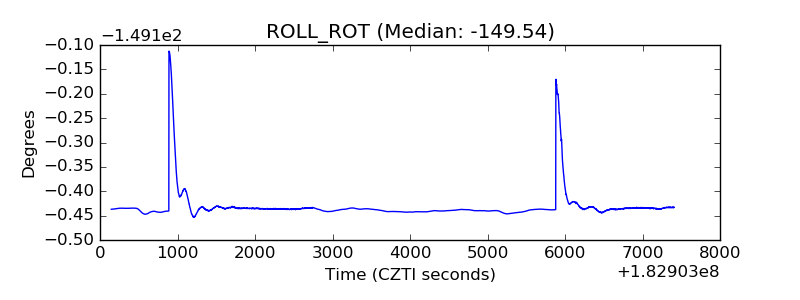 |
| _Roll_DEC | 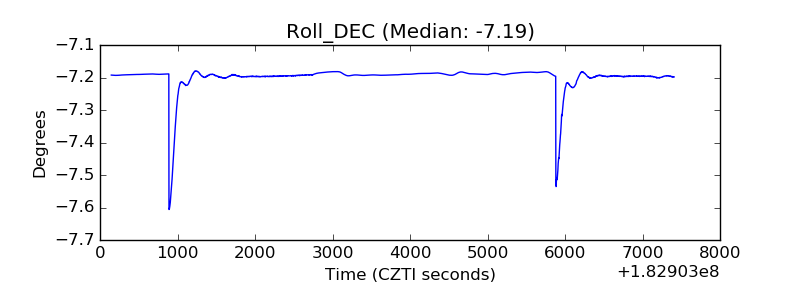 |
| _Roll_RA | 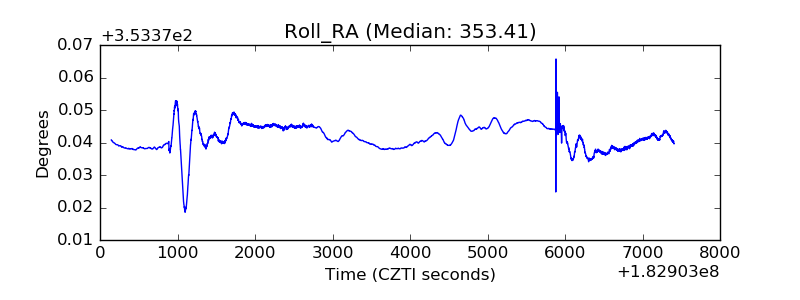 |
| Veto Counter | 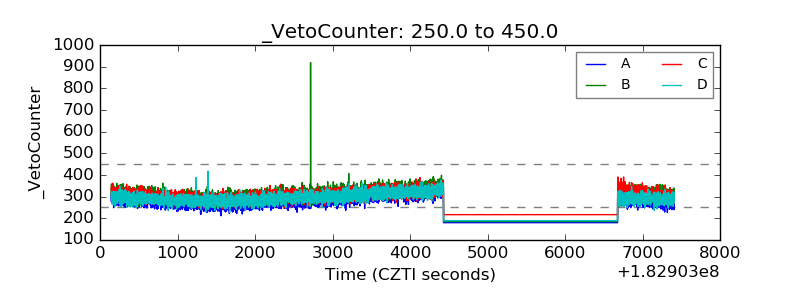 |