| Param | Original file | Final file |
|---|---|---|
| Filename | modeM0/AS1P01_161T01_9000000040cztM0_level2.fits | modeM0/AS1P01_161T01_9000000040cztM0_level2_quad_clean.evt |
| Size (bytes) | 62,671,680 | 63,783,360 |
| Size | 59.8 MB | 60.8 MB |
| Events in quadrant A | 356,206 | 368,100 |
| Events in quadrant B | 360,918 | 369,944 |
| Events in quadrant C | 360,762 | 355,786 |
| Events in quadrant D | 304,362 | 321,019 |
| Mode M0 | |||
|---|---|---|---|
| Quadrant | BADHDUFLAG | Total packets | Discarded packets |
| A | 0 | 32788 | 0 |
| B | 0 | 32219 | 0 |
| C | 0 | 31434 | 0 |
| D | 0 | 30837 | 0 |
| Mode SS | |||
|---|---|---|---|
| Quadrant | BADHDUFLAG | Total packets | Discarded packets |
| A | 0 | 152 | 0 |
| B | 0 | 152 | 0 |
| C | 0 | 152 | 0 |
| D | 0 | 152 | 0 |
| Mode M9 | |||
|---|---|---|---|
| Quadrant | BADHDUFLAG | Total packets | Discarded packets |
| A | 0 | 45 | 0 |
| B | 0 | 45 | 0 |
| C | 0 | 45 | 0 |
| D | 0 | 45 | 0 |
| Quadrant | Total seconds | Saturated seconds | Saturation percentage |
|---|---|---|---|
| A | 7416 | 24 | 0.323625% |
| B | 7416 | 26 | 0.350593% |
| C | 7416 | 11 | 0.148328% |
| D | 7416 | 76 | 1.024811% |
Noise dominated data is calculated using 1-second bins in cleaned event files. If a bin has >2000 counts, and if more than 50% of those come from <1% of pixels, then it is considered to be noise-dominated and hence unusable.
| Quadrant | # 1 sec bins | Bins with >0 counts | Bins with >2000 counts | High rate bins dominated by noise | Noise dominated (total time) | Noise dominated (detector-on time) | Marked lightcurve |
|---|---|---|---|---|---|---|---|
| A | 11907 | 7416 | 0 | 0 | 0.00% | 0.00% |  |
| B | 11907 | 7416 | 0 | 0 | 0.00% | 0.00% | 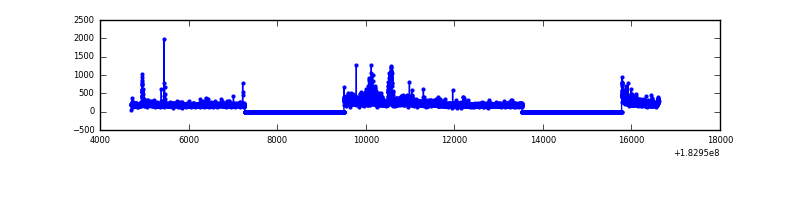 |
| C | 11907 | 7416 | 0 | 0 | 0.00% | 0.00% | 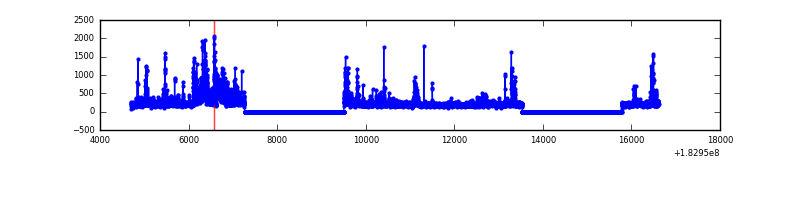 |
| D | 11907 | 7413 | 0 | 0 | 0.00% | 0.00% | 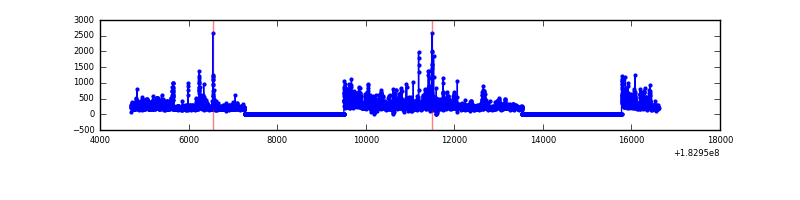 |
Top three noisy pixels from each quadrant. If the there are fewer than three noisy pixels in the level2.evt file, extra rows are filled as -1
| Pixel properties | Quadrant properties | ||||||
|---|---|---|---|---|---|---|---|
| Quadrant | DetID | PixID | Counts | Sigma | Mean | Median | Sigma |
| A | 7 | 110 | 341 | 10.91 | 92 | 87 | 23.3 |
| A | 0 | 29 | 339 | 10.82 | 92 | 87 | 23.3 |
| A | 14 | 30 | 271 | 7.9 | 92 | 87 | 23.3 |
| B | 2 | 9 | 275 | 9.61 | 95 | 91 | 19.1 |
| B | 5 | 128 | 250 | 8.3 | 95 | 91 | 19.1 |
| B | 2 | 18 | 238 | 7.67 | 95 | 91 | 19.1 |
| C | 1 | 81 | 274 | 7.31 | 95 | 89 | 25.3 |
| C | 12 | 241 | 237 | 5.85 | 95 | 89 | 25.3 |
| C | 15 | 177 | 234 | 5.73 | 95 | 89 | 25.3 |
| D | 6 | 44 | 256 | 7.81 | 87 | 80 | 22.5 |
| D | 11 | 82 | 250 | 7.54 | 87 | 80 | 22.5 |
| D | 6 | 231 | 240 | 7.1 | 87 | 80 | 22.5 |
Histogram calculated using DETX and DETY for each event in the final _common_clean file
| Quadrant A |  |
 |
Quadrant B |
|---|---|---|---|
| Quadrant D | 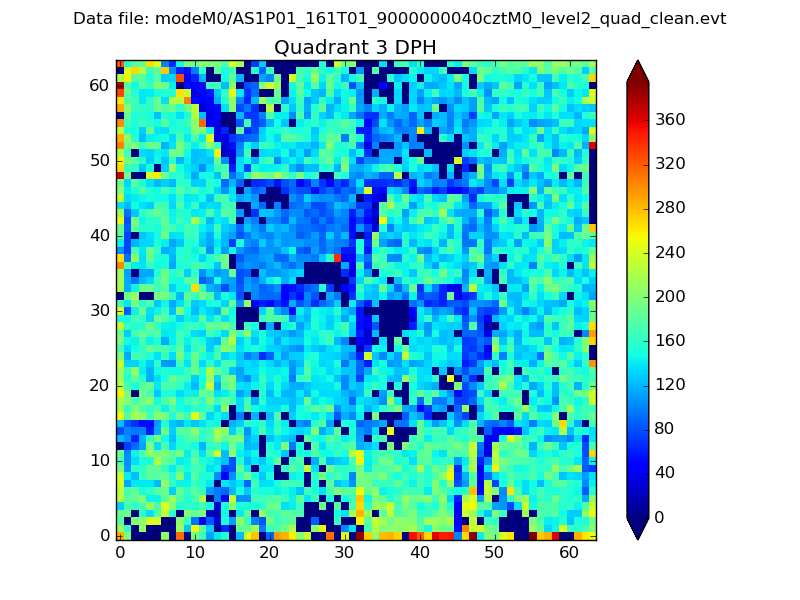 |
 |
Quadrant C |
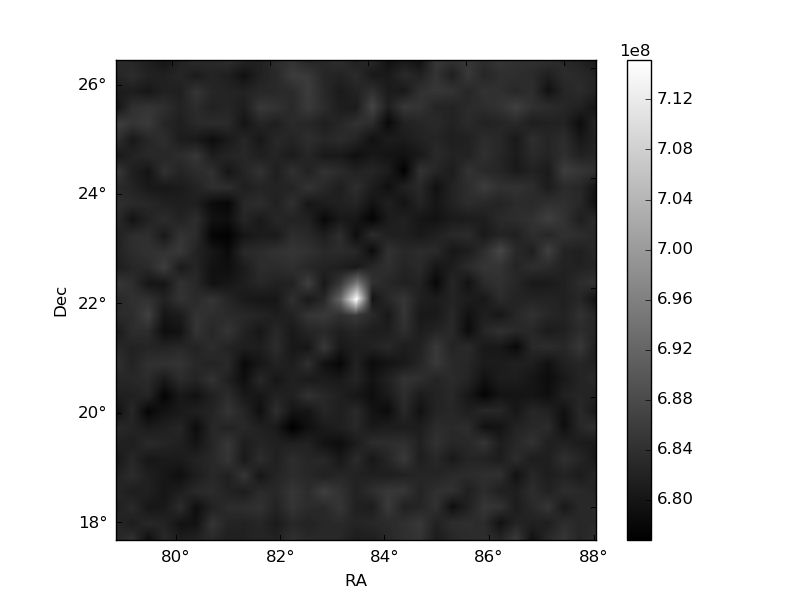
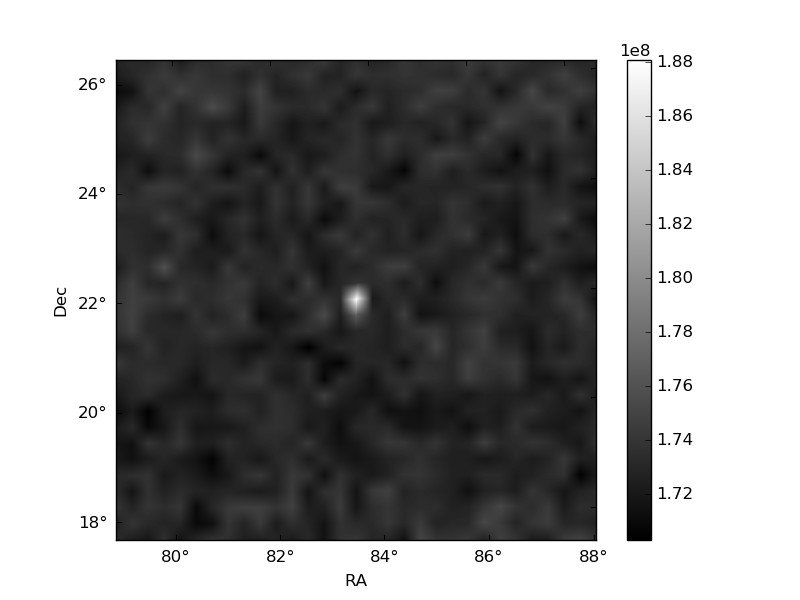
| Plot type | Count rate plots | Images |
|---|---|---|
| Comparison with Poisson distribution Blue bars denote a histogram of data divided into 1 sec bins. Red curve is a Poisson curve with rate = median count rate of data. |
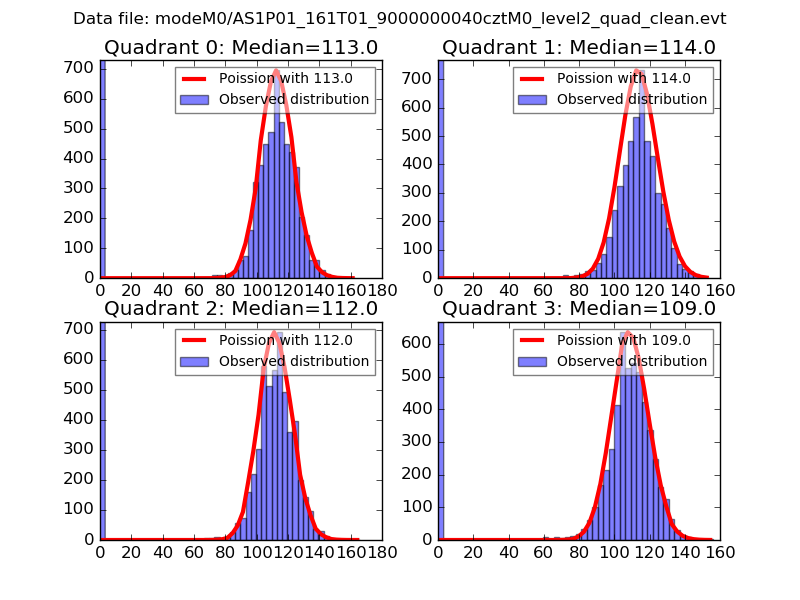 |
 |
| Quadrant-wise count rates Data is divided into 100 sec bins |
 |
|
| Module-wise count rates for Quadrant A Data is divided into 100 sec bins |
 |
 |
| Module-wise count rates for Quadrant B Data is divided into 100 sec bins |
 |
 |
| Module-wise count rates for Quadrant C Data is divided into 100 sec bins |
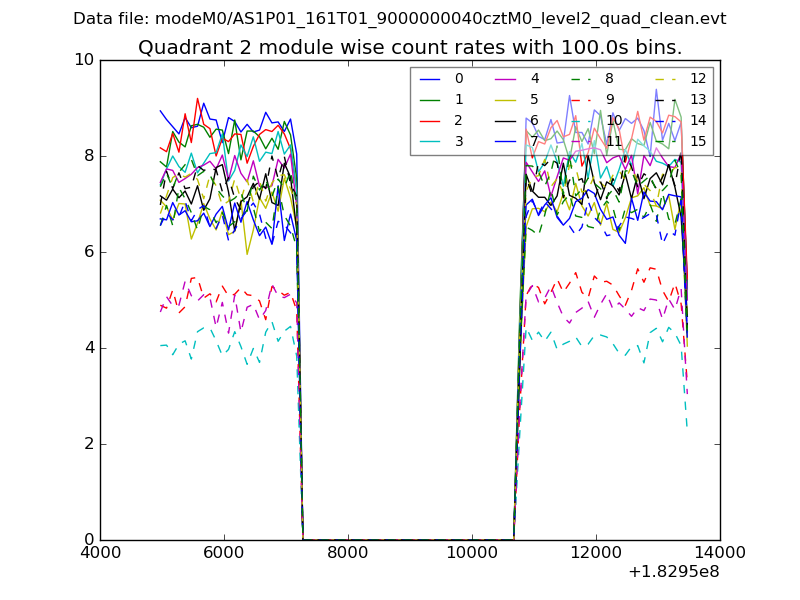 |
 |
| Module-wise count rates for Quadrant D Data is divided into 100 sec bins |
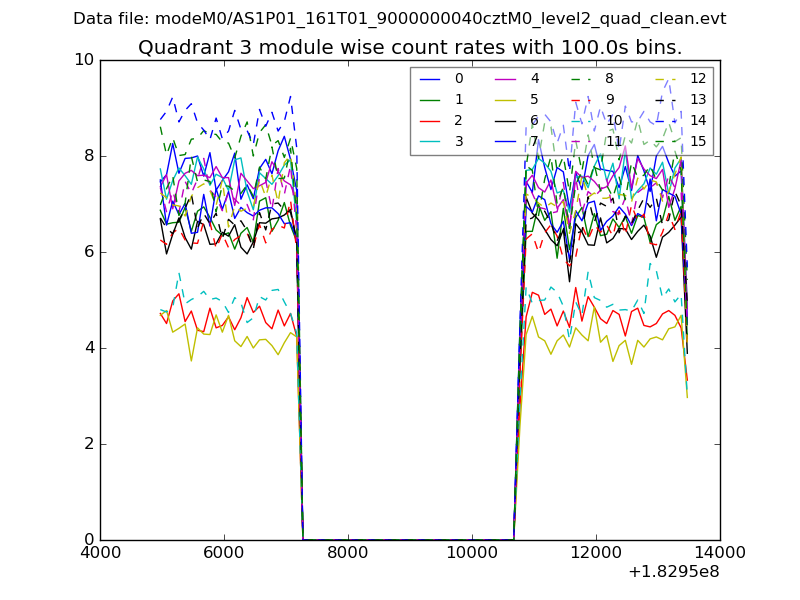 |
 |
| Parameter | Plot |
|---|---|
| CZT HV Monitor |  |
| D_VDD |  |
| Temperature 1 |  |
| Veto HV Monitor | 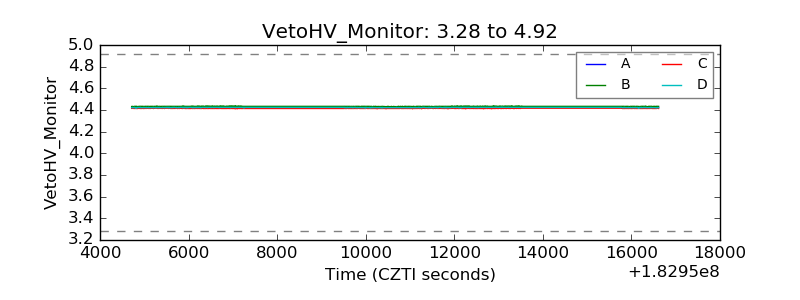 |
| Veto LLD | 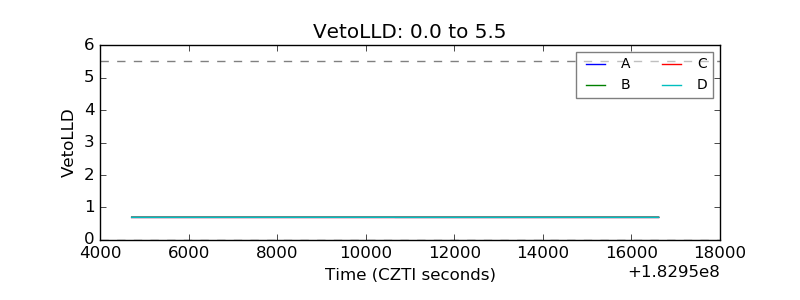 |
| Alpha Counter |  |
| _CPM_Rate |  |
| CZT Counter |  |
| +2.5 Volts monitor |  |
| +5 Volts monitor |  |
| _ROLL_ROT | 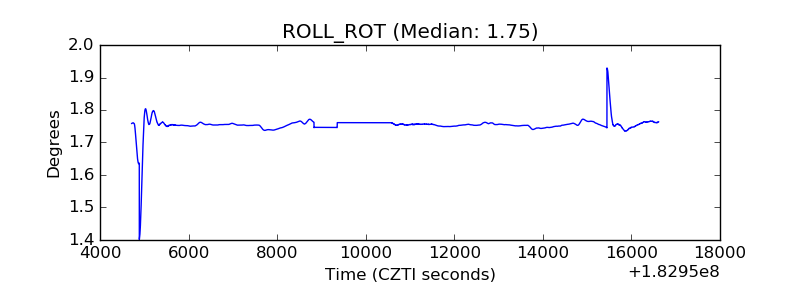 |
| _Roll_DEC |  |
| _Roll_RA |  |
| Veto Counter |  |