| Param | Original file | Final file |
|---|---|---|
| Filename | modeM0/AS1P01_162T09_9000000038cztM0_level2.fits | modeM0/AS1P01_162T09_9000000038cztM0_level2_quad_clean.evt |
| Size (bytes) | 149,621,760 | 191,465,280 |
| Size | 142.7 MB | 182.6 MB |
| Events in quadrant A | 847,108 | 1,180,434 |
| Events in quadrant B | 838,472 | 1,178,091 |
| Events in quadrant C | 837,876 | 1,116,398 |
| Events in quadrant D | 702,984 | 1,018,587 |
| Mode SS | |||
|---|---|---|---|
| Quadrant | BADHDUFLAG | Total packets | Discarded packets |
| A | 0 | 390 | 0 |
| B | 0 | 390 | 0 |
| C | 0 | 390 | 0 |
| D | 0 | 390 | 0 |
| Mode M9 | |||
|---|---|---|---|
| Quadrant | BADHDUFLAG | Total packets | Discarded packets |
| A | 0 | 115 | 0 |
| B | 0 | 115 | 0 |
| C | 0 | 115 | 0 |
| D | 0 | 115 | 0 |
| Mode M0 | |||
|---|---|---|---|
| Quadrant | BADHDUFLAG | Total packets | Discarded packets |
| A | 0 | 80114 | 0 |
| B | 0 | 80102 | 0 |
| C | 0 | 75210 | 0 |
| D | 0 | 77839 | 0 |
| Quadrant | Total seconds | Saturated seconds | Saturation percentage |
|---|---|---|---|
| A | 18938 | 34 | 0.179533% |
| B | 18938 | 125 | 0.660049% |
| C | 18938 | 89 | 0.469955% |
| D | 18938 | 263 | 1.388742% |
Noise dominated data is calculated using 1-second bins in cleaned event files. If a bin has >2000 counts, and if more than 50% of those come from <1% of pixels, then it is considered to be noise-dominated and hence unusable.
| Quadrant | # 1 sec bins | Bins with >0 counts | Bins with >2000 counts | High rate bins dominated by noise | Noise dominated (total time) | Noise dominated (detector-on time) | Marked lightcurve |
|---|---|---|---|---|---|---|---|
| A | 30458 | 18938 | 0 | 0 | 0.00% | 0.00% | 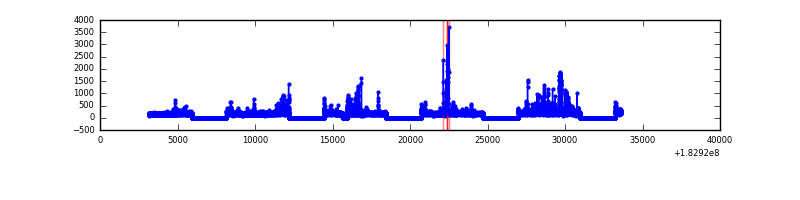 |
| B | 30458 | 18939 | 0 | 0 | 0.00% | 0.00% | 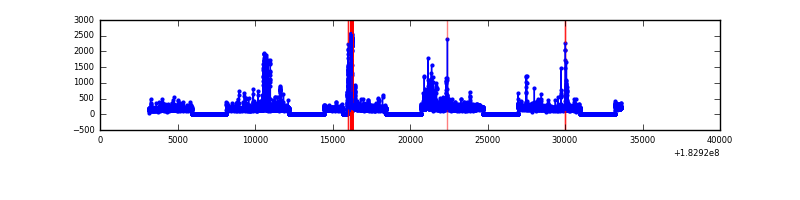 |
| C | 30458 | 18939 | 0 | 0 | 0.00% | 0.00% | 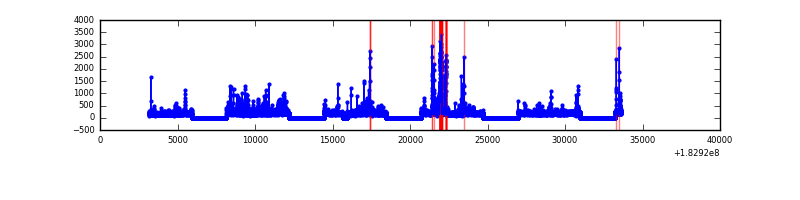 |
| D | 30458 | 18934 | 0 | 0 | 0.00% | 0.00% |  |
Top three noisy pixels from each quadrant. If the there are fewer than three noisy pixels in the level2.evt file, extra rows are filled as -1
| Pixel properties | Quadrant properties | ||||||
|---|---|---|---|---|---|---|---|
| Quadrant | DetID | PixID | Counts | Sigma | Mean | Median | Sigma |
| A | 7 | 110 | 806 | 11.09 | 220 | 206 | 54.1 |
| A | 0 | 29 | 758 | 10.2 | 220 | 206 | 54.1 |
| A | 9 | 191 | 627 | 7.78 | 220 | 206 | 54.1 |
| B | 2 | 9 | 728 | 12.6 | 222 | 212 | 40.9 |
| B | 5 | 128 | 583 | 9.06 | 222 | 212 | 40.9 |
| B | 14 | 254 | 570 | 8.74 | 222 | 212 | 40.9 |
| C | 3 | 203 | 692 | 8.65 | 221 | 204 | 56.4 |
| C | 2 | 191 | 658 | 8.05 | 221 | 204 | 56.4 |
| C | 3 | 202 | 650 | 7.91 | 221 | 204 | 56.4 |
| D | 6 | 231 | 540 | 7.06 | 202 | 186 | 50.2 |
| D | 6 | 44 | 540 | 7.06 | 202 | 186 | 50.2 |
| D | 10 | 189 | 525 | 6.76 | 202 | 186 | 50.2 |
Histogram calculated using DETX and DETY for each event in the final _common_clean file
| Quadrant A |  |
 |
Quadrant B |
|---|---|---|---|
| Quadrant D | 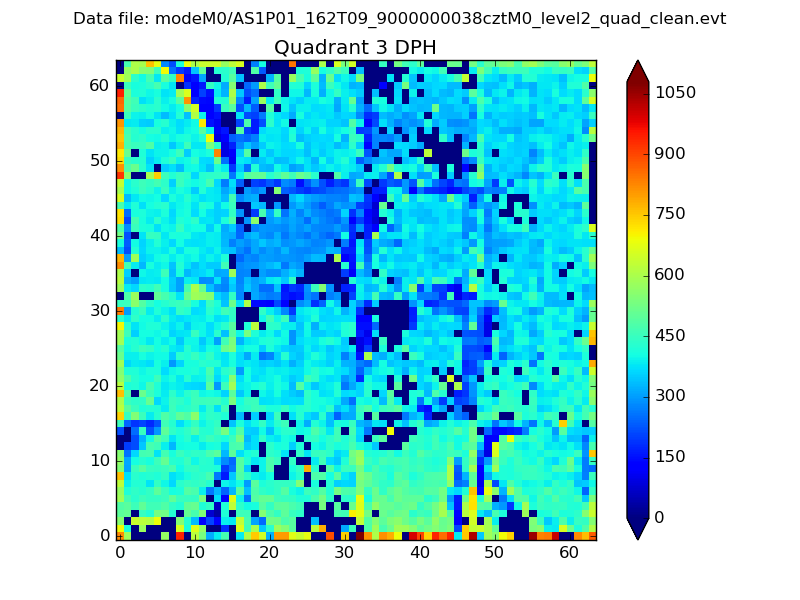 |
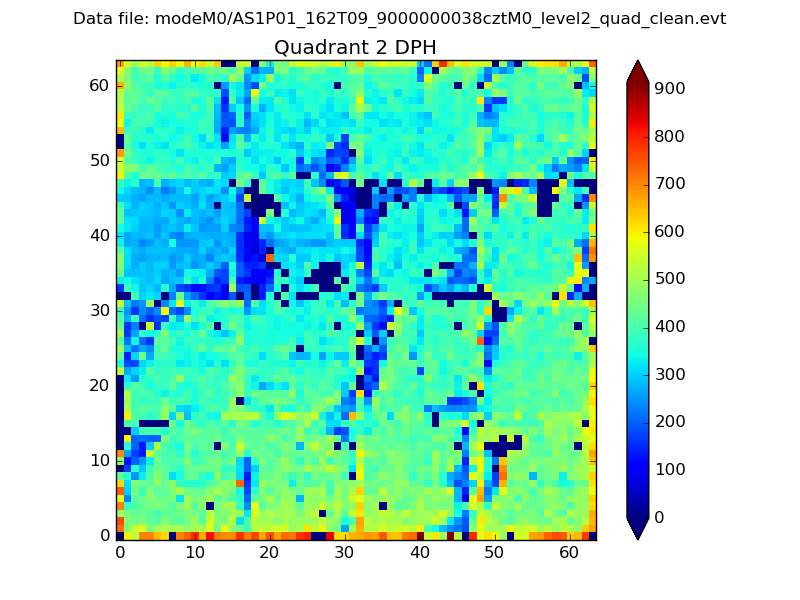 |
Quadrant C |
| Plot type | Count rate plots | Images |
|---|---|---|
| Comparison with Poisson distribution Blue bars denote a histogram of data divided into 1 sec bins. Red curve is a Poisson curve with rate = median count rate of data. |
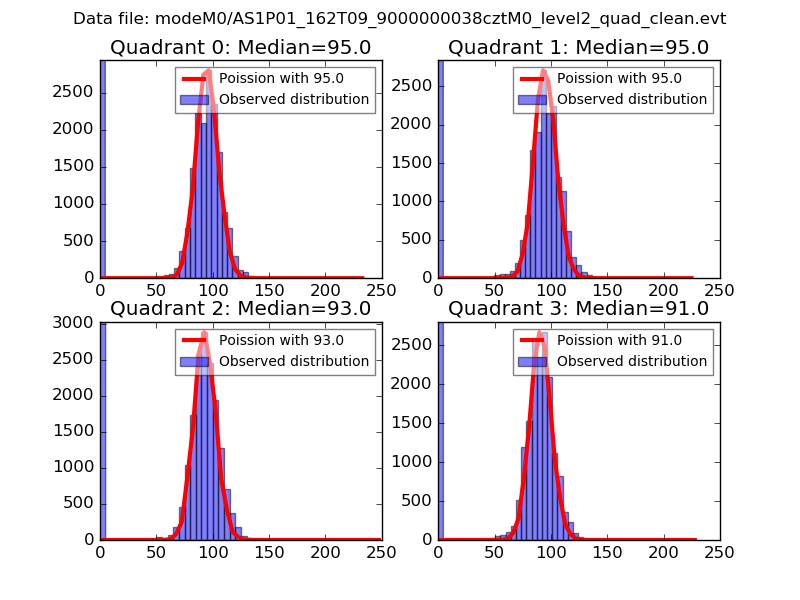 |
 |
| Quadrant-wise count rates Data is divided into 100 sec bins |
 |
|
| Module-wise count rates for Quadrant A Data is divided into 100 sec bins |
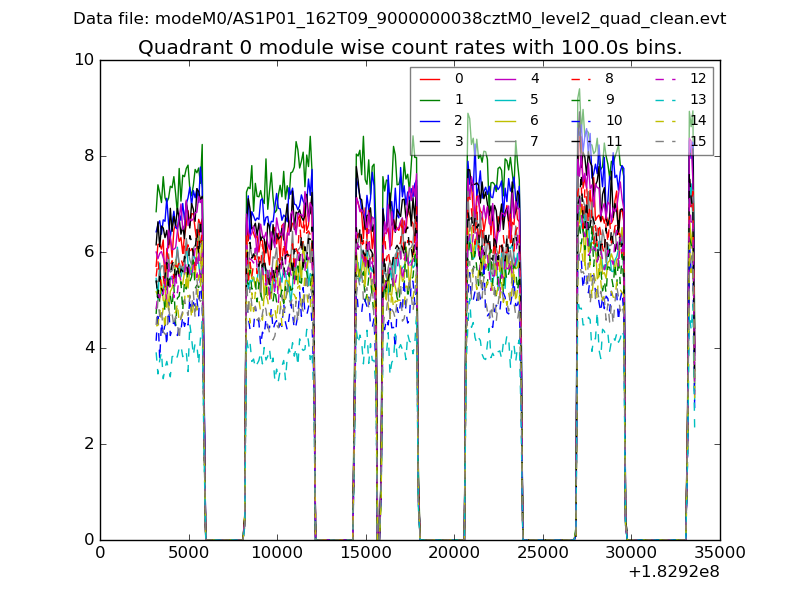 |
 |
| Module-wise count rates for Quadrant B Data is divided into 100 sec bins |
 |
 |
| Module-wise count rates for Quadrant C Data is divided into 100 sec bins |
 |
 |
| Module-wise count rates for Quadrant D Data is divided into 100 sec bins |
 |
 |
| Parameter | Plot |
|---|---|
| CZT HV Monitor |  |
| D_VDD | 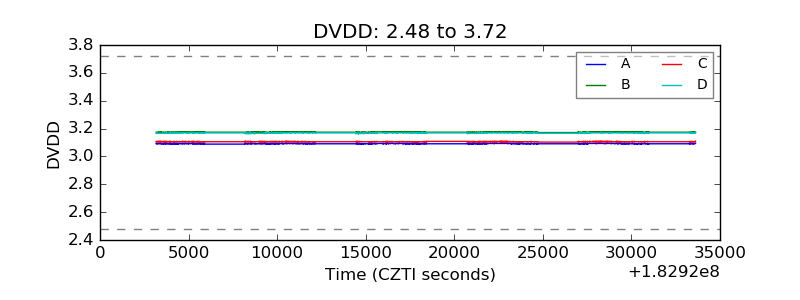 |
| Temperature 1 | 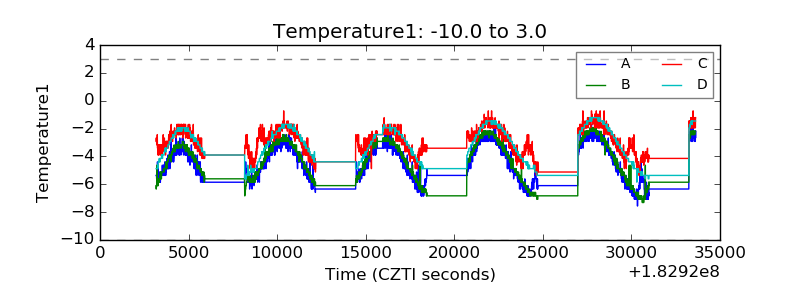 |
| Veto HV Monitor |  |
| Veto LLD | 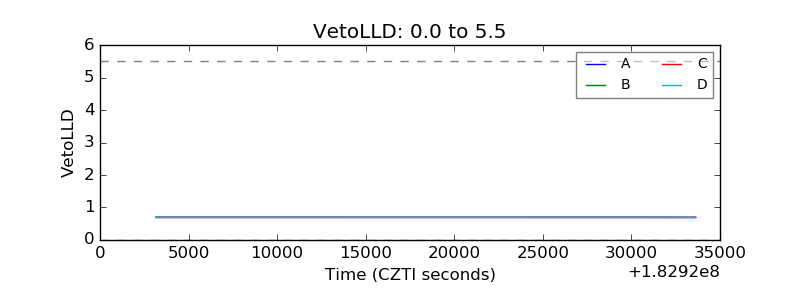 |
| Alpha Counter |  |
| _CPM_Rate | 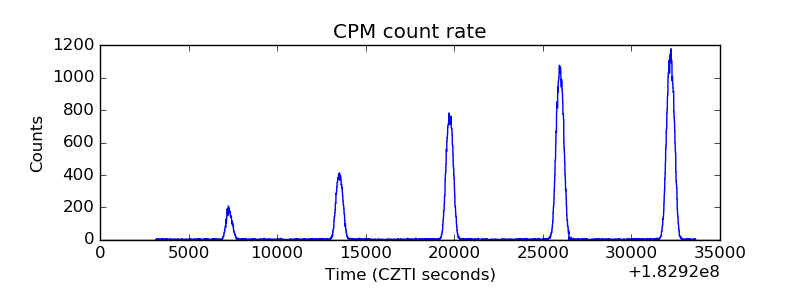 |
| CZT Counter |  |
| +2.5 Volts monitor |  |
| +5 Volts monitor |  |
| _ROLL_ROT |  |
| _Roll_DEC |  |
| _Roll_RA |  |
| Veto Counter |  |