| Param | Original file | Final file |
|---|---|---|
| Filename | modeM0/AS1P01_162T09_9000000038_00314cztM0_level2.evt | modeM0/AS1P01_162T09_9000000038_00314cztM0_level2_quad_clean.evt |
| Size (bytes) | 730,454,400 | 70,087,680 |
| Size | 696.6 MB | 66.8 MB |
| Events in quadrant A | 5,601,560 | 455,637 |
| Events in quadrant B | 6,079,256 | 458,550 |
| Events in quadrant C | 5,018,748 | 449,119 |
| Events in quadrant D | 5,115,524 | 435,353 |
| Mode SS | |||
|---|---|---|---|
| Quadrant | BADHDUFLAG | Total packets | Discarded packets |
| A | 0 | 98 | 0 |
| B | 0 | 98 | 0 |
| C | 0 | 98 | 0 |
| D | 0 | 98 | 0 |
| Mode M9 | |||
|---|---|---|---|
| Quadrant | BADHDUFLAG | Total packets | Discarded packets |
| A | 0 | 29 | 0 |
| B | 0 | 29 | 0 |
| C | 0 | 29 | 0 |
| D | 0 | 30 | 0 |
| Mode M0 | |||
|---|---|---|---|
| Quadrant | BADHDUFLAG | Total packets | Discarded packets |
| A | 0 | 19912 | 4 |
| B | 0 | 21322 | 3 |
| C | 0 | 18189 | 3 |
| D | 0 | 18473 | 3 |
| Quadrant | Total seconds | Saturated seconds | Saturation percentage |
|---|---|---|---|
| A | 4598 | 7 | 0.152240% |
| B | 4598 | 104 | 2.261853% |
| C | 4598 | 16 | 0.347977% |
| D | 4598 | 23 | 0.500217% |
Noise dominated data is calculated using 1-second bins in cleaned event files. If a bin has >2000 counts, and if more than 50% of those come from <1% of pixels, then it is considered to be noise-dominated and hence unusable.
| Quadrant | # 1 sec bins | Bins with >0 counts | Bins with >2000 counts | High rate bins dominated by noise | Noise dominated (total time) | Noise dominated (detector-on time) | Marked lightcurve |
|---|---|---|---|---|---|---|---|
| A | 7138 | 4600 | 135 | 135 | 1.89% | 2.93% | 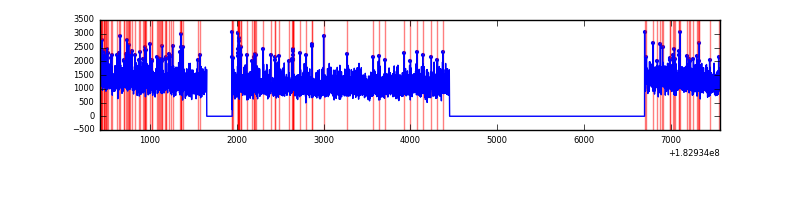 |
| B | 7138 | 4600 | 401 | 401 | 5.62% | 8.72% | 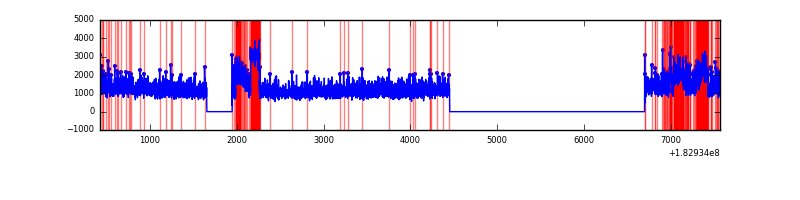 |
| C | 7138 | 4600 | 51 | 51 | 0.71% | 1.11% |  |
| D | 7138 | 4600 | 70 | 70 | 0.98% | 1.52% | 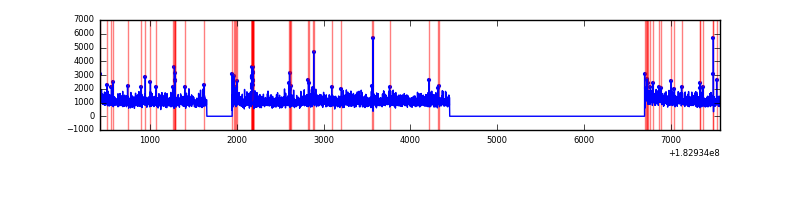 |
Top three noisy pixels from each quadrant. If the there are fewer than three noisy pixels in the level2.evt file, extra rows are filled as -1
| Pixel properties | Quadrant properties | ||||||
|---|---|---|---|---|---|---|---|
| Quadrant | DetID | PixID | Counts | Sigma | Mean | Median | Sigma |
| A | 0 | 69 | 61972 | 194.07 | 1410 | 1398 | 312.1 |
| A | 15 | 53 | 27438 | 83.43 | 1410 | 1398 | 312.1 |
| A | 12 | 149 | 21271 | 63.67 | 1410 | 1398 | 312.1 |
| B | 8 | 6 | 713554 | 2190.14 | 1380 | 1393 | 325.2 |
| B | 10 | 252 | 25303 | 73.53 | 1380 | 1393 | 325.2 |
| B | 5 | 46 | 19188 | 54.73 | 1380 | 1393 | 325.2 |
| C | 2 | 192 | 95334 | 272.37 | 1233 | 1271 | 345.4 |
| C | 4 | 253 | 22691 | 62.02 | 1233 | 1271 | 345.4 |
| C | 9 | 68 | 18404 | 49.61 | 1233 | 1271 | 345.4 |
| D | 1 | 5 | 78703 | 201.53 | 1225 | 1271 | 384.2 |
| D | 13 | 117 | 45426 | 114.92 | 1225 | 1271 | 384.2 |
| D | 2 | 170 | 45411 | 114.88 | 1225 | 1271 | 384.2 |
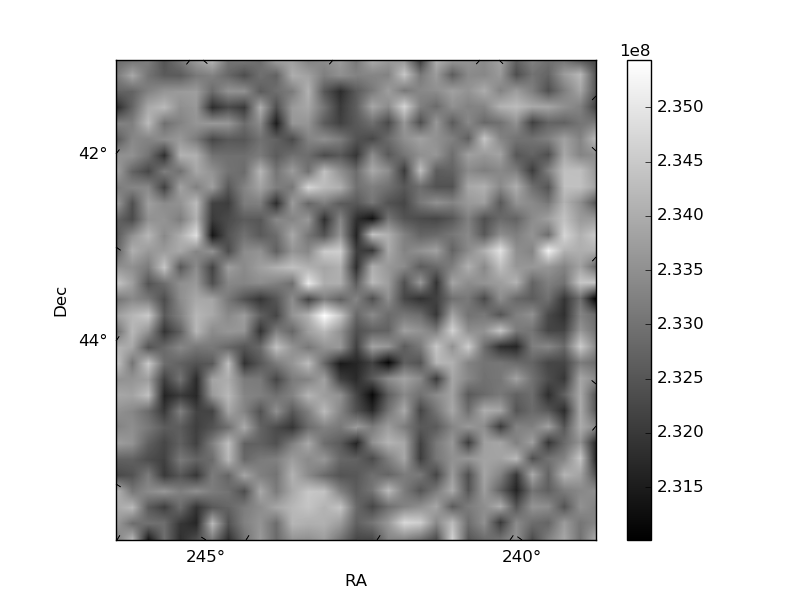
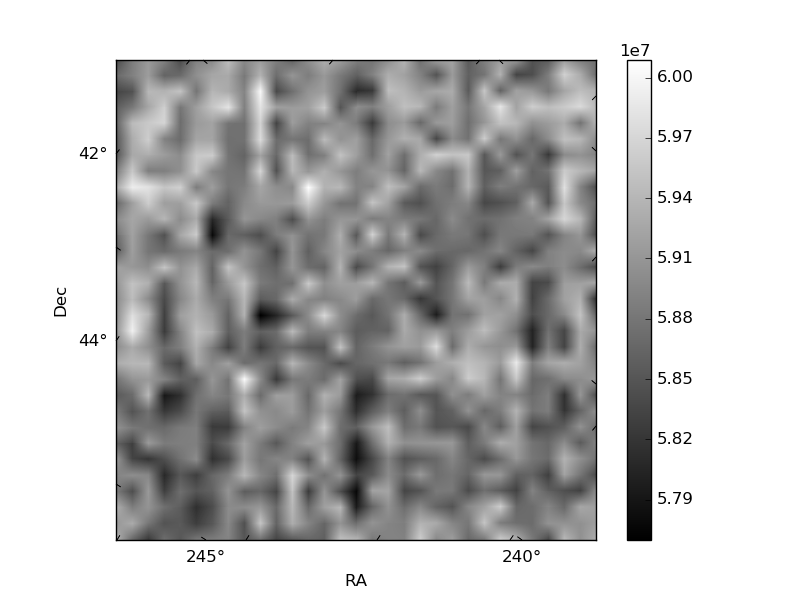
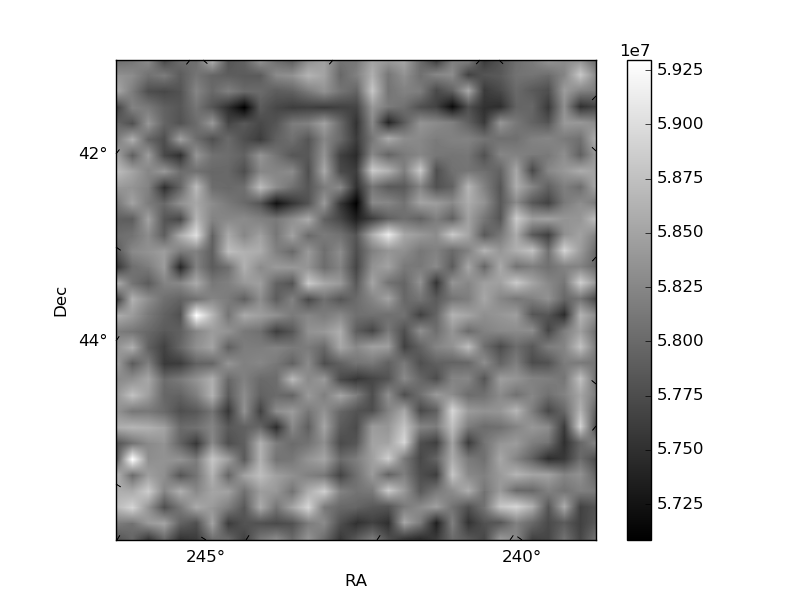
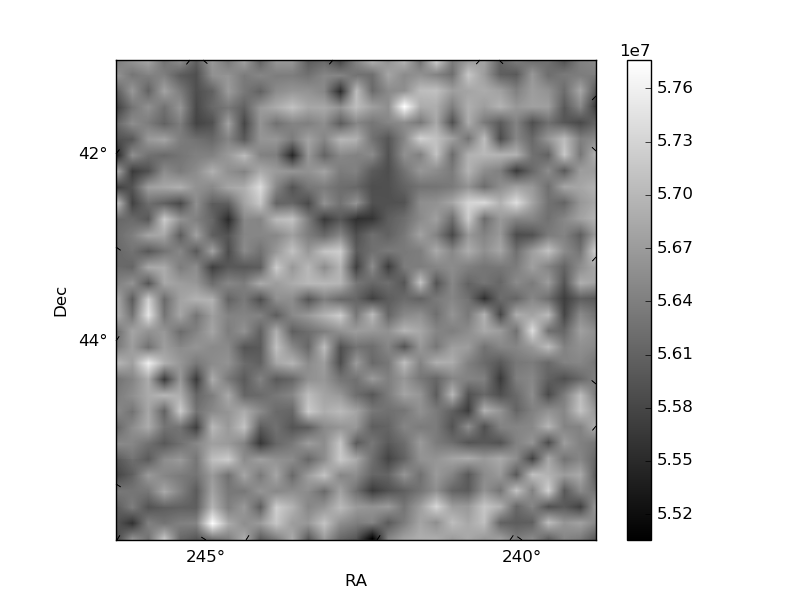
Histogram calculated using DETX and DETY for each event in the final _common_clean file
| Quadrant A | 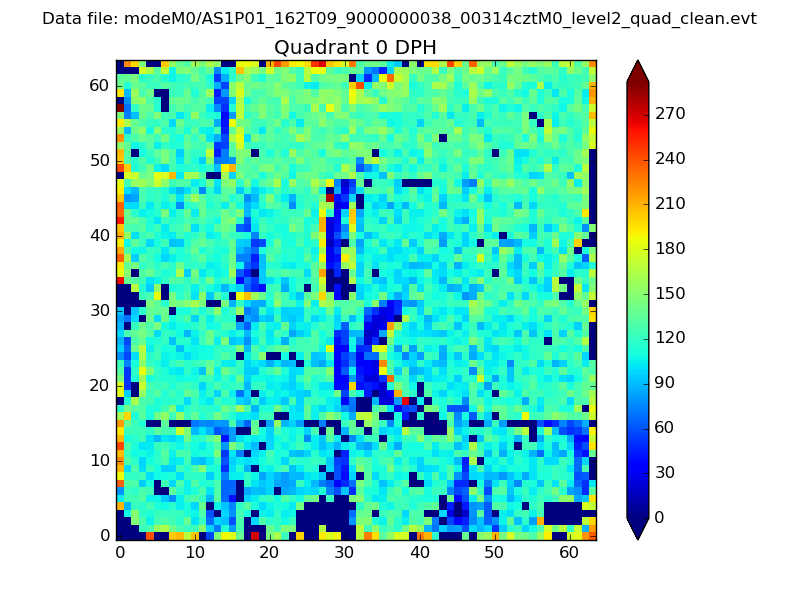 |
 |
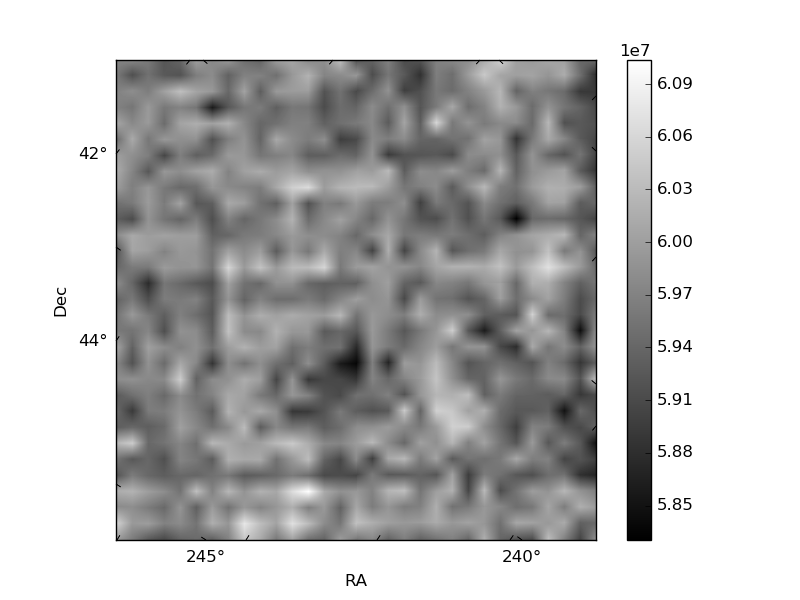
Quadrant B |
|---|---|---|---|
| Quadrant D |  |
 |
Quadrant C |
| Plot type | Count rate plots | Images |
|---|---|---|
| Comparison with Poisson distribution Blue bars denote a histogram of data divided into 1 sec bins. Red curve is a Poisson curve with rate = median count rate of data. |
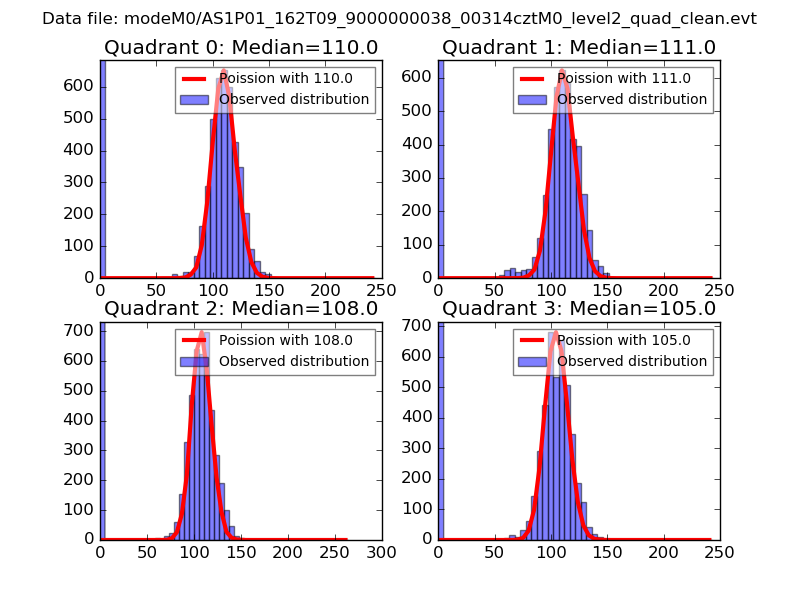 |
 |
| Quadrant-wise count rates Data is divided into 100 sec bins |
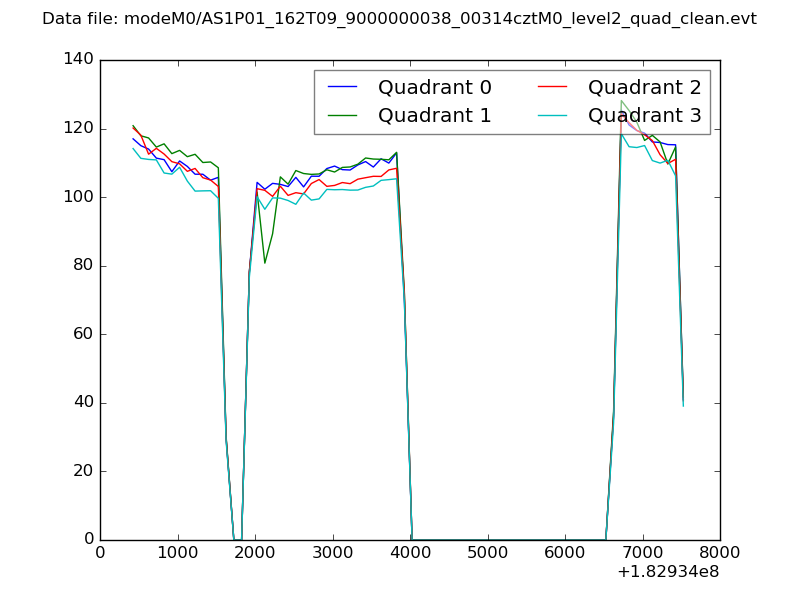 |
|
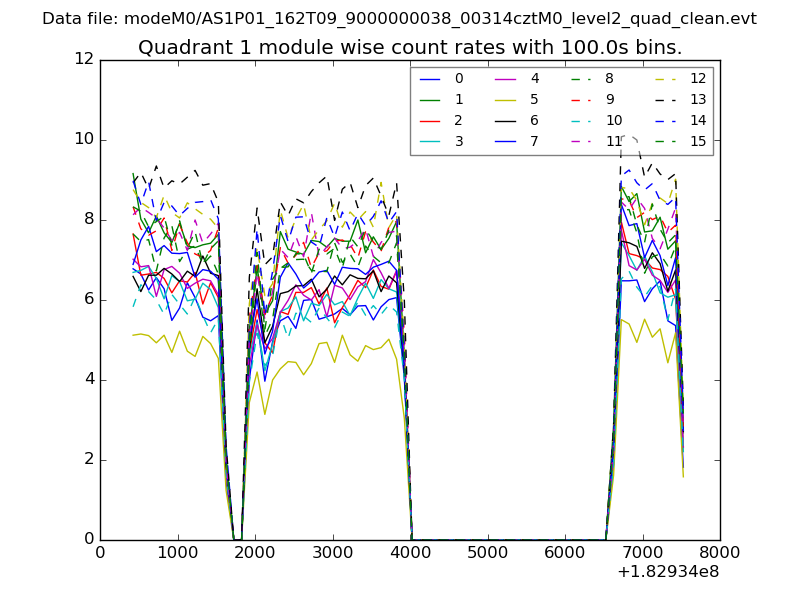
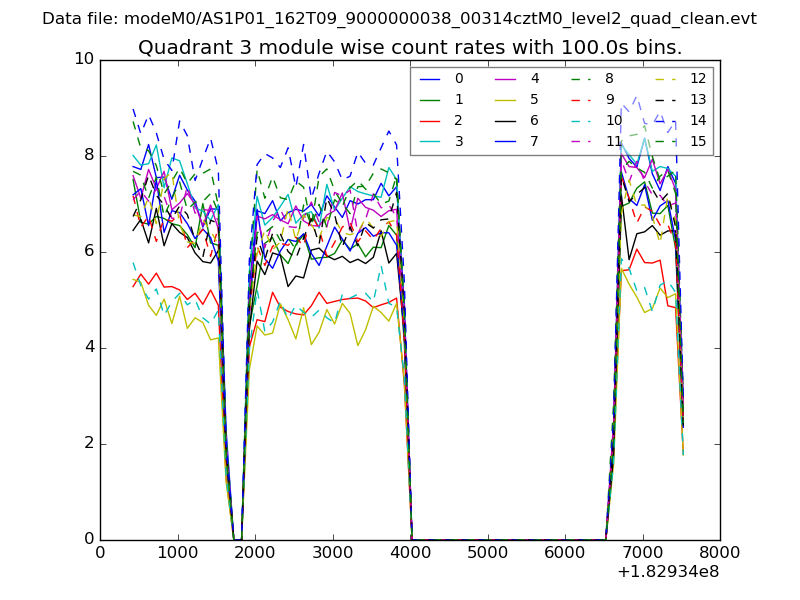
| Module-wise count rates for Quadrant A Data is divided into 100 sec bins |
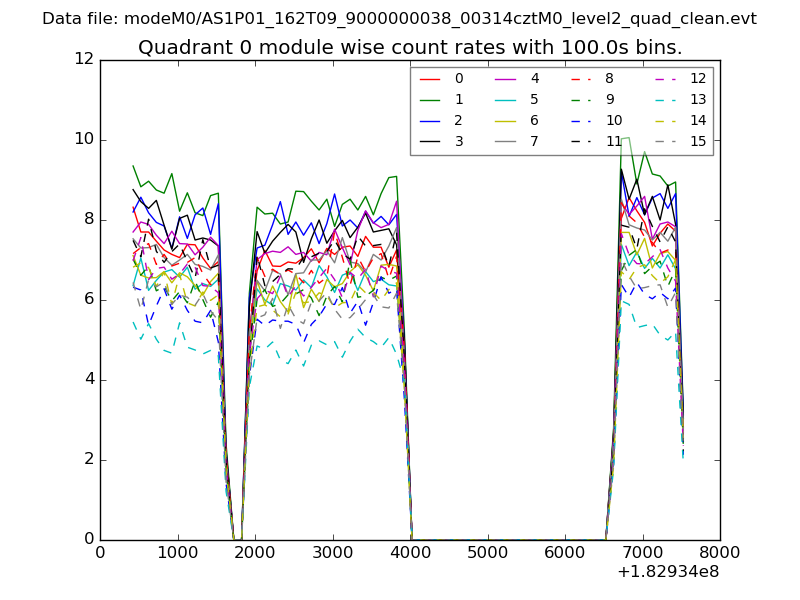 |
 |
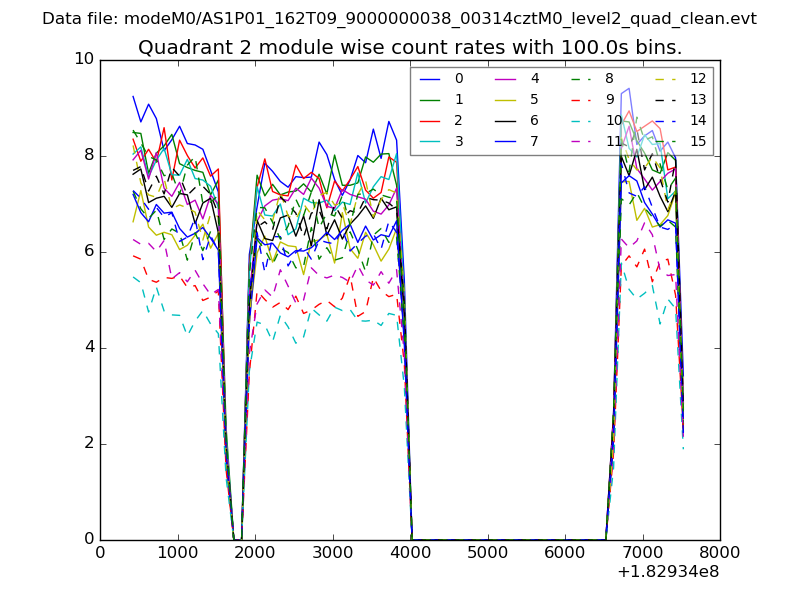
| Module-wise count rates for Quadrant B Data is divided into 100 sec bins |
 |
 |
| Module-wise count rates for Quadrant C Data is divided into 100 sec bins |
 |
 |
| Module-wise count rates for Quadrant D Data is divided into 100 sec bins |
 |
 |
| Parameter | Plot |
|---|---|
| CZT HV Monitor | 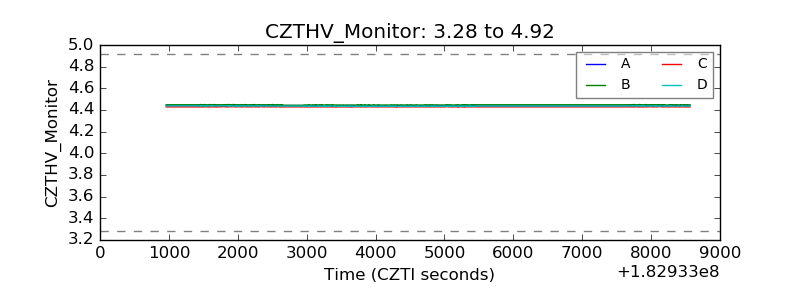 |
| D_VDD | 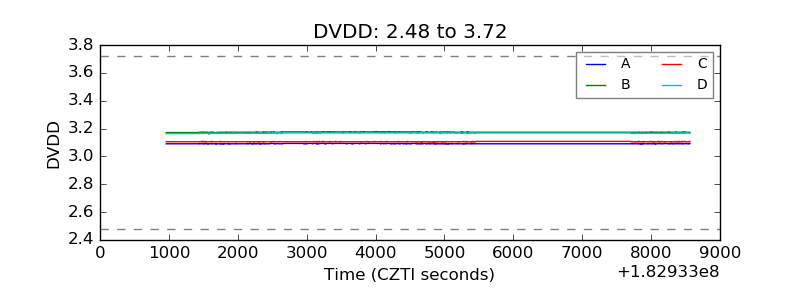 |
| Temperature 1 | 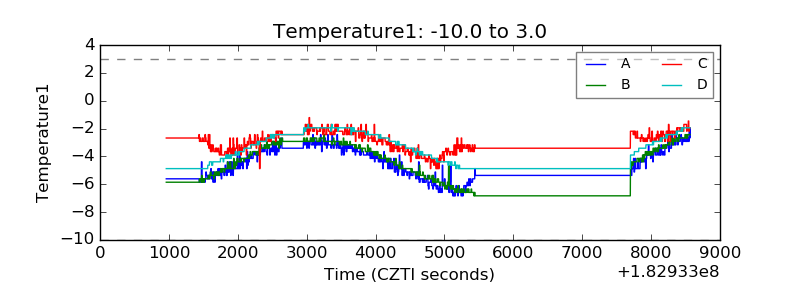 |
| Veto HV Monitor | 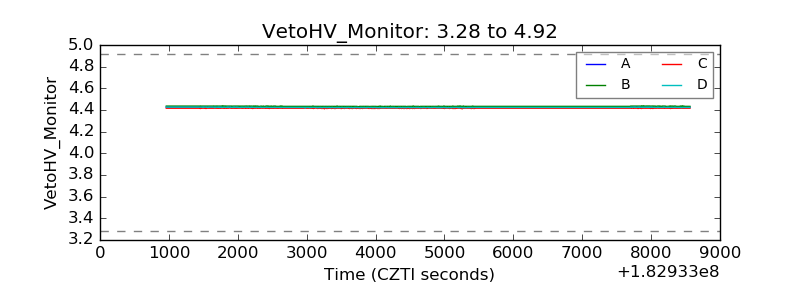 |
| Veto LLD | 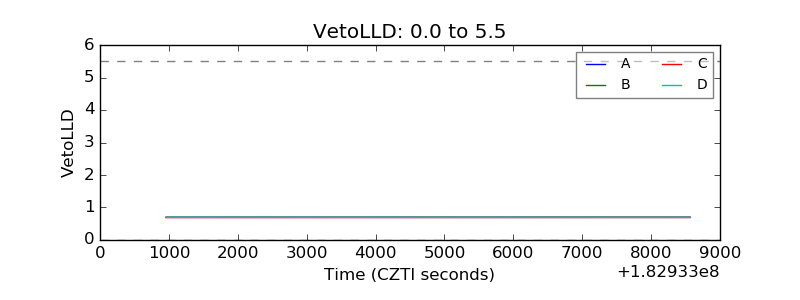 |
| Alpha Counter | 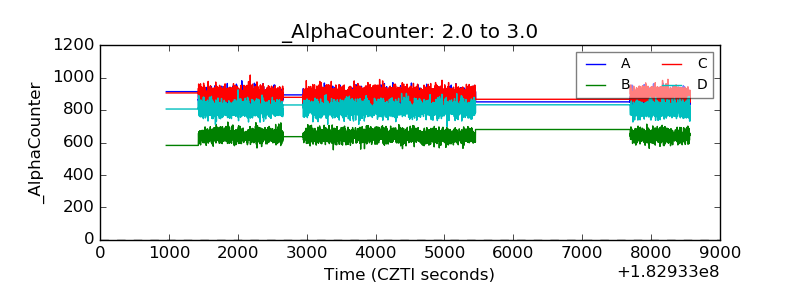 |
| _CPM_Rate | 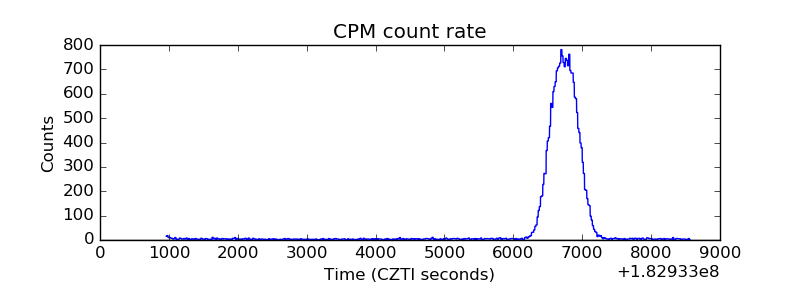 |
| CZT Counter | 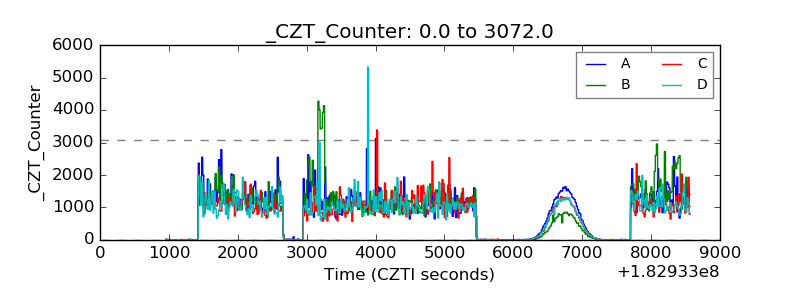 |
| +2.5 Volts monitor |  |
| +5 Volts monitor |  |
| _ROLL_ROT | 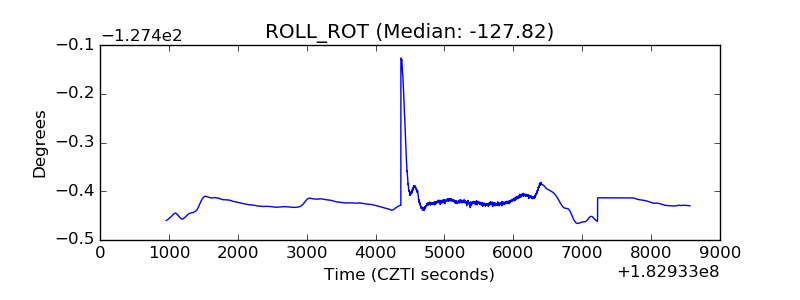 |
| _Roll_DEC | 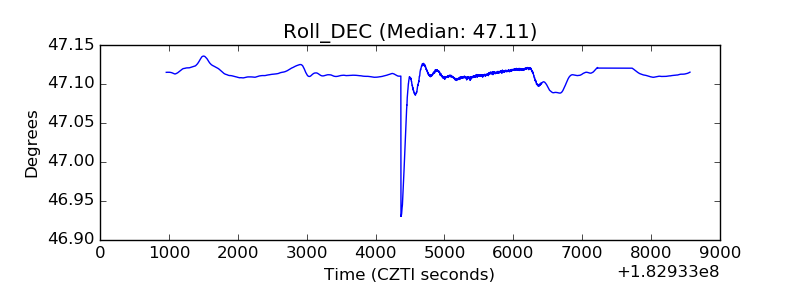 |
| _Roll_RA | 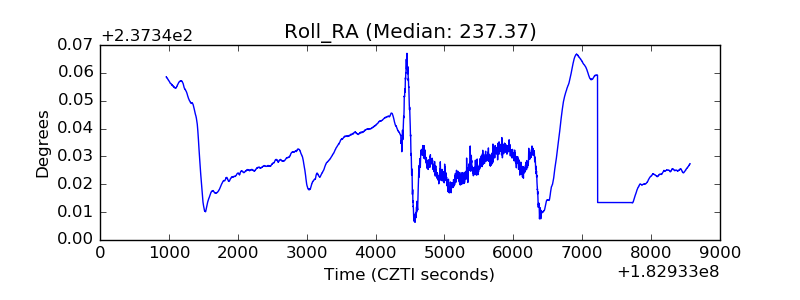 |
| Veto Counter | 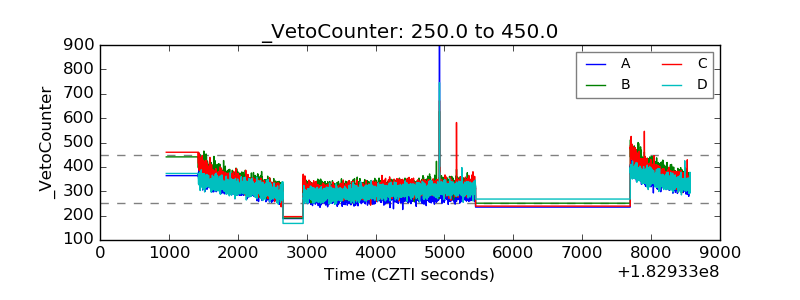 |