| Param | Original file | Final file |
|---|---|---|
| Filename | modeM0/AS1P01_162T05_9000000046_00351cztM0_level2.evt | modeM0/AS1P01_162T05_9000000046_00351cztM0_level2_quad_clean.evt |
| Size (bytes) | 909,610,560 | 64,938,240 |
| Size | 867.5 MB | 61.9 MB |
| Events in quadrant A | 6,804,096 | 414,451 |
| Events in quadrant B | 9,941,595 | 382,509 |
| Events in quadrant C | 5,212,884 | 418,206 |
| Events in quadrant D | 5,263,914 | 406,808 |
| Mode M9 | |||
|---|---|---|---|
| Quadrant | BADHDUFLAG | Total packets | Discarded packets |
| A | 0 | 22 | 0 |
| B | 0 | 22 | 0 |
| C | 0 | 22 | 0 |
| D | 0 | 22 | 0 |
| Mode M0 | |||
|---|---|---|---|
| Quadrant | BADHDUFLAG | Total packets | Discarded packets |
| A | 0 | 23759 | 3 |
| B | 0 | 33241 | 2 |
| C | 0 | 18974 | 2 |
| D | 0 | 19145 | 2 |
| Mode SS | |||
|---|---|---|---|
| Quadrant | BADHDUFLAG | Total packets | Discarded packets |
| A | 0 | 100 | 0 |
| B | 0 | 100 | 0 |
| C | 0 | 100 | 0 |
| D | 0 | 100 | 0 |
| Quadrant | Total seconds | Saturated seconds | Saturation percentage |
|---|---|---|---|
| A | 4898 | 211 | 4.307881% |
| B | 4898 | 1575 | 32.155982% |
| C | 4898 | 14 | 0.285831% |
| D | 4898 | 20 | 0.408330% |
Noise dominated data is calculated using 1-second bins in cleaned event files. If a bin has >2000 counts, and if more than 50% of those come from <1% of pixels, then it is considered to be noise-dominated and hence unusable.
| Quadrant | # 1 sec bins | Bins with >0 counts | Bins with >2000 counts | High rate bins dominated by noise | Noise dominated (total time) | Noise dominated (detector-on time) | Marked lightcurve |
|---|---|---|---|---|---|---|---|
| A | 7114 | 4899 | 670 | 670 | 9.42% | 13.68% | 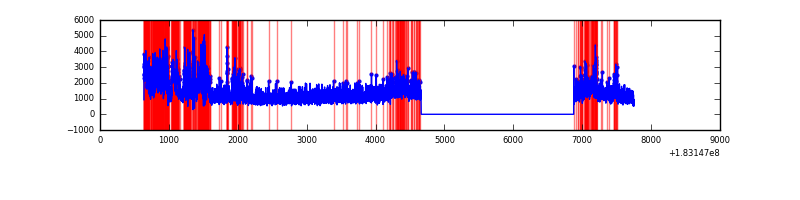 |
| B | 7114 | 4899 | 2314 | 2314 | 32.53% | 47.23% | 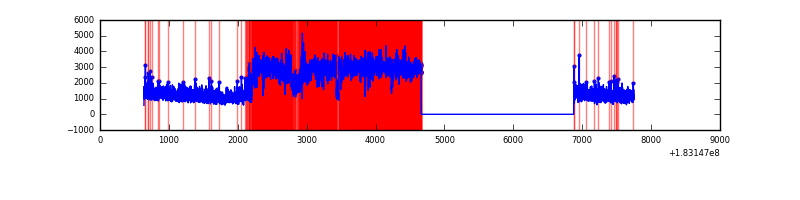 |
| C | 7114 | 4899 | 53 | 53 | 0.75% | 1.08% | 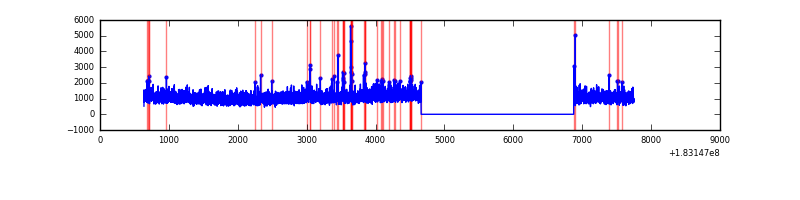 |
| D | 7114 | 4899 | 127 | 127 | 1.79% | 2.59% | 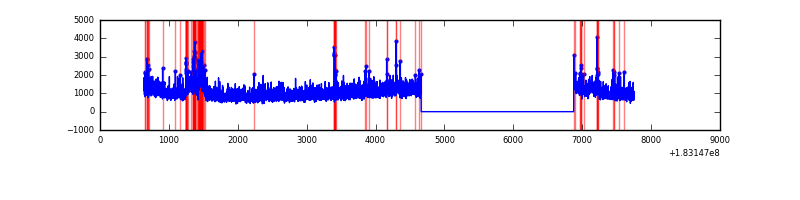 |
Top three noisy pixels from each quadrant. If the there are fewer than three noisy pixels in the level2.evt file, extra rows are filled as -1
| Pixel properties | Quadrant properties | ||||||
|---|---|---|---|---|---|---|---|
| Quadrant | DetID | PixID | Counts | Sigma | Mean | Median | Sigma |
| A | 0 | 69 | 1421452 | 4674.71 | 1370 | 1359 | 303.8 |
| A | 0 | 238 | 63998 | 206.2 | 1370 | 1359 | 303.8 |
| A | 12 | 150 | 6472 | 16.83 | 1370 | 1359 | 303.8 |
| B | 2 | 2 | 4751240 | 15193.22 | 1329 | 1340 | 312.6 |
| B | 0 | 23 | 30927 | 94.64 | 1329 | 1340 | 312.6 |
| B | 4 | 67 | 21522 | 64.55 | 1329 | 1340 | 312.6 |
| C | 5 | 234 | 56323 | 154.45 | 1280 | 1327 | 356.1 |
| C | 3 | 159 | 50940 | 139.33 | 1280 | 1327 | 356.1 |
| C | 1 | 1 | 36502 | 98.78 | 1280 | 1327 | 356.1 |
| D | 2 | 171 | 218229 | 593.59 | 1214 | 1257 | 365.5 |
| D | 2 | 25 | 192024 | 521.9 | 1214 | 1257 | 365.5 |
| D | 1 | 5 | 71842 | 193.11 | 1214 | 1257 | 365.5 |
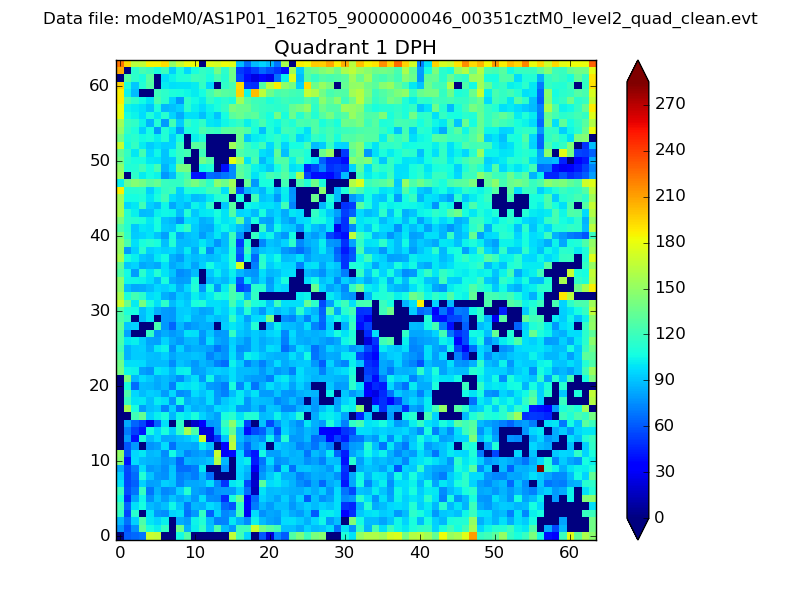
Histogram calculated using DETX and DETY for each event in the final _common_clean file
| Quadrant A |  |
 |
Quadrant B |
|---|---|---|---|
| Quadrant D | 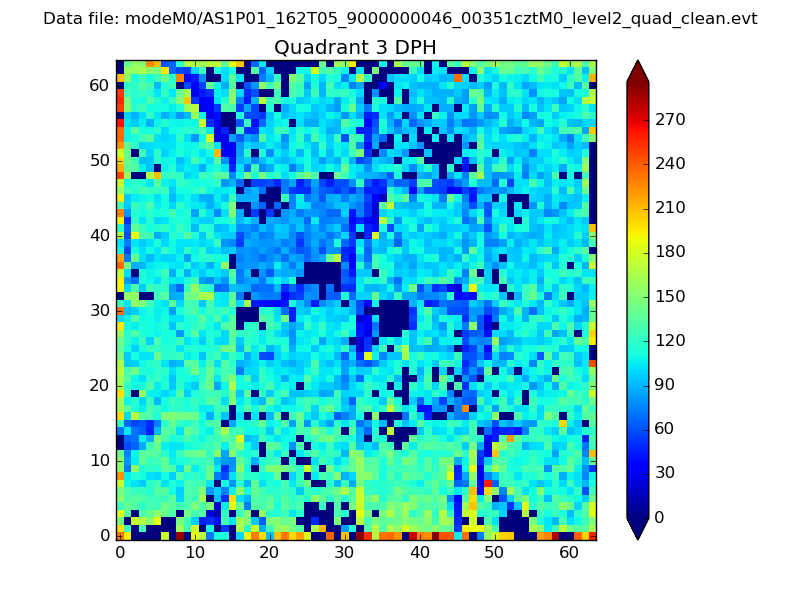 |
 |
Quadrant C |
| Plot type | Count rate plots | Images |
|---|---|---|
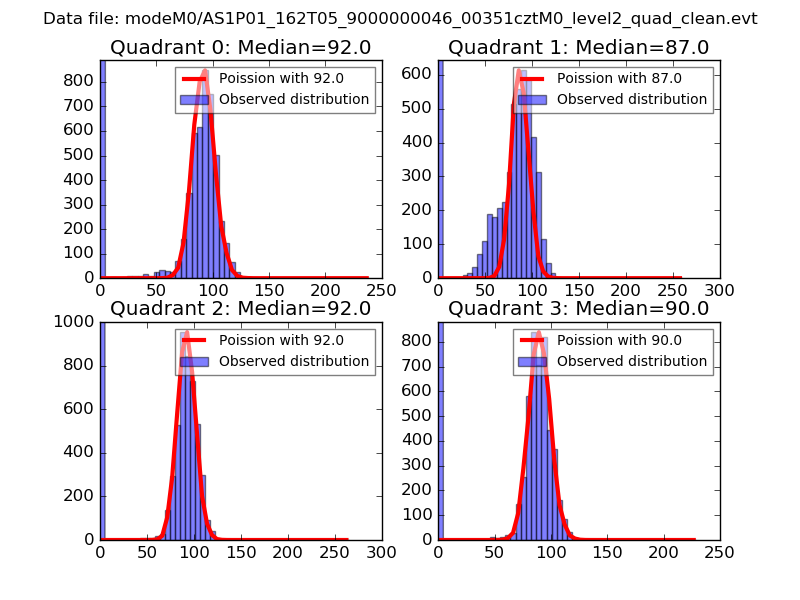
| Comparison with Poisson distribution Blue bars denote a histogram of data divided into 1 sec bins. Red curve is a Poisson curve with rate = median count rate of data. |
 |
 |
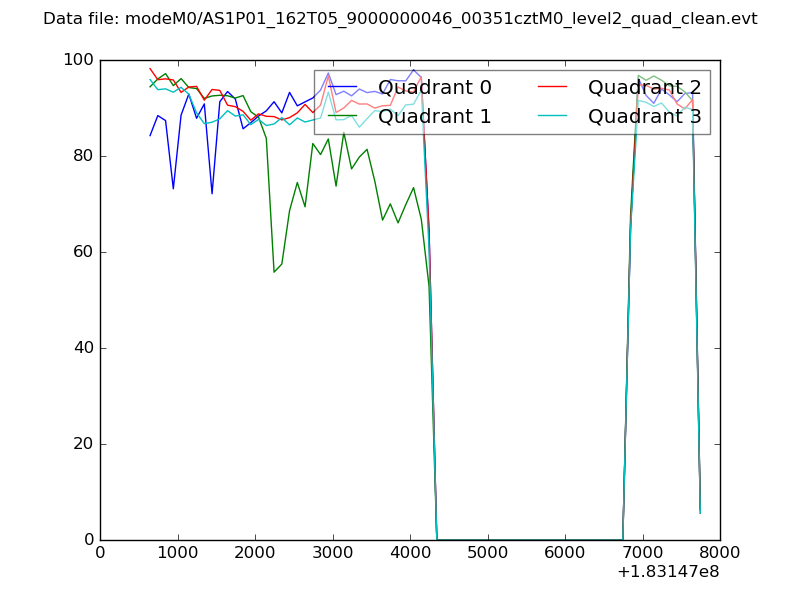
| Quadrant-wise count rates Data is divided into 100 sec bins |
 |
|
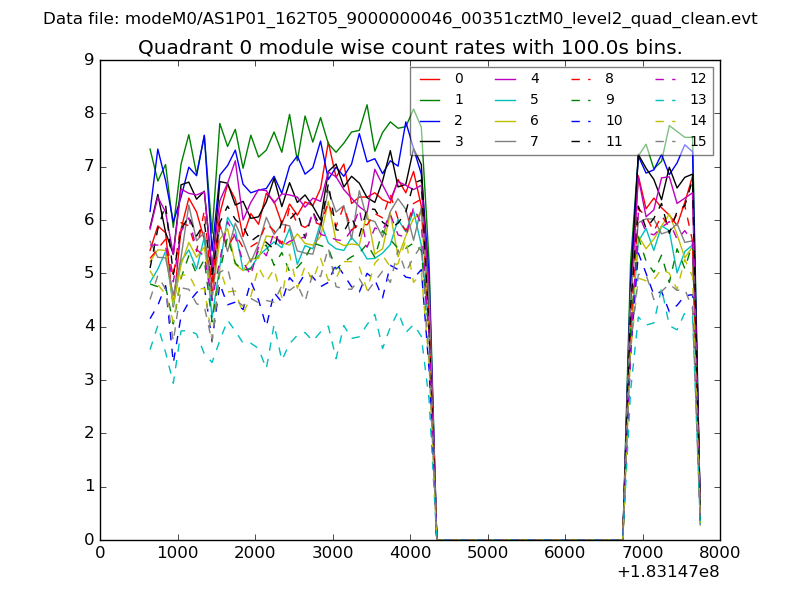
| Module-wise count rates for Quadrant A Data is divided into 100 sec bins |
 |
 |
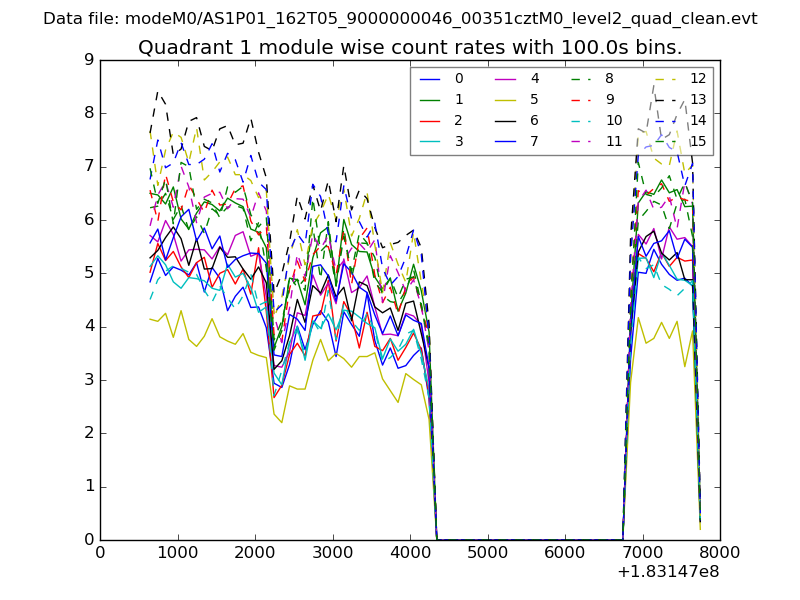
| Module-wise count rates for Quadrant B Data is divided into 100 sec bins |
 |
 |
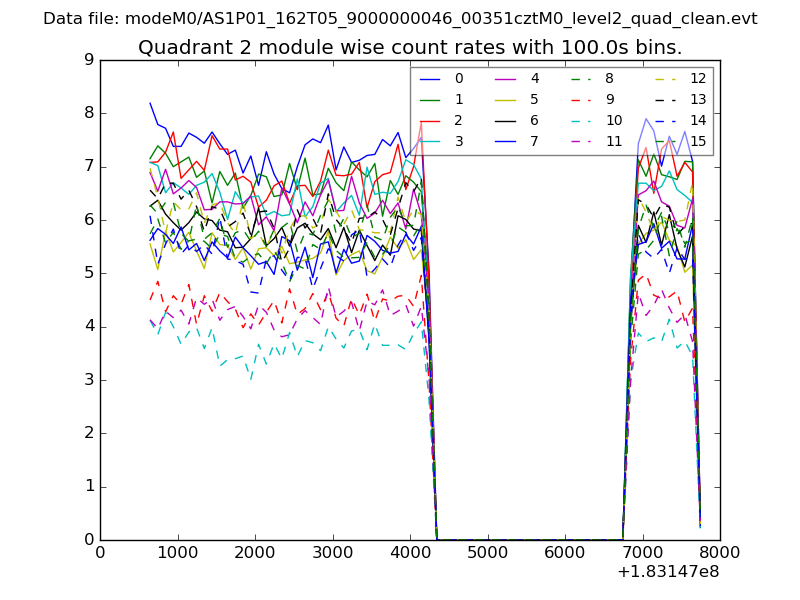
| Module-wise count rates for Quadrant C Data is divided into 100 sec bins |
 |
 |
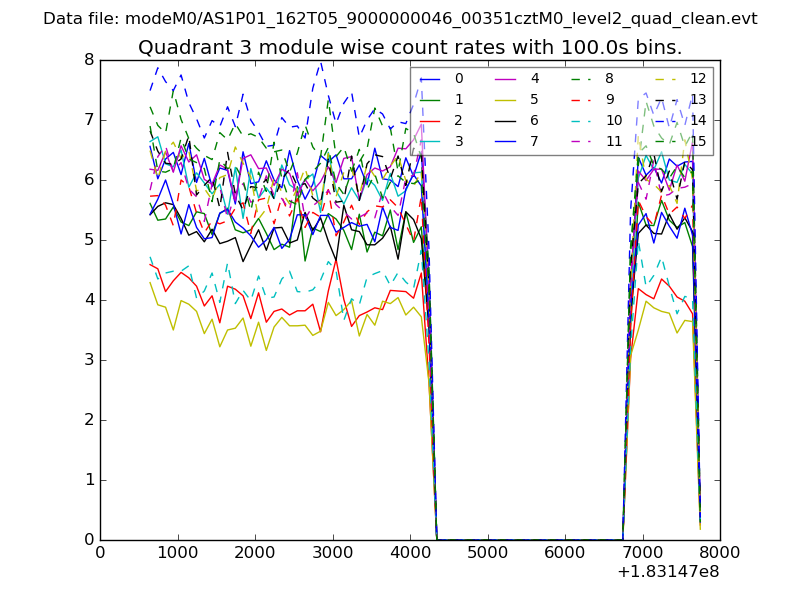
| Module-wise count rates for Quadrant D Data is divided into 100 sec bins |
 |
 |
| Parameter | Plot |
|---|---|
| CZT HV Monitor | 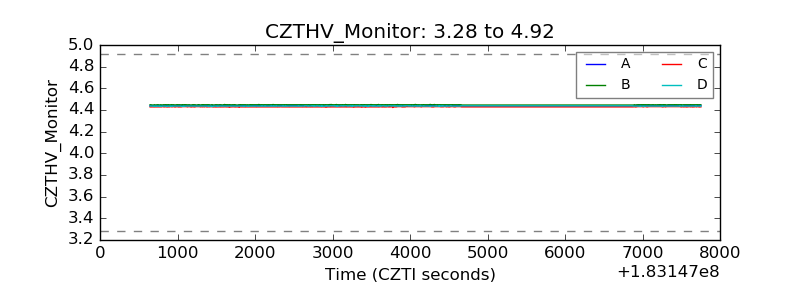 |
| D_VDD | 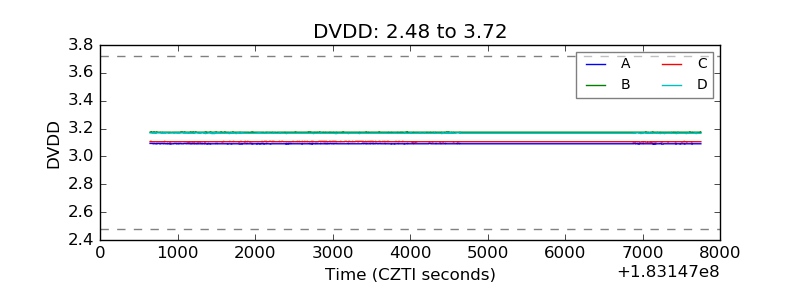 |
| Temperature 1 | 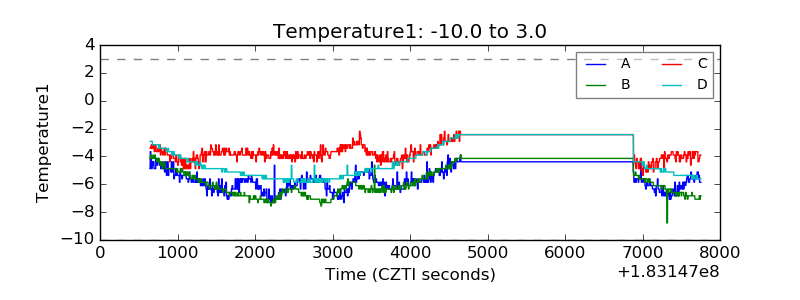 |
| Veto HV Monitor | 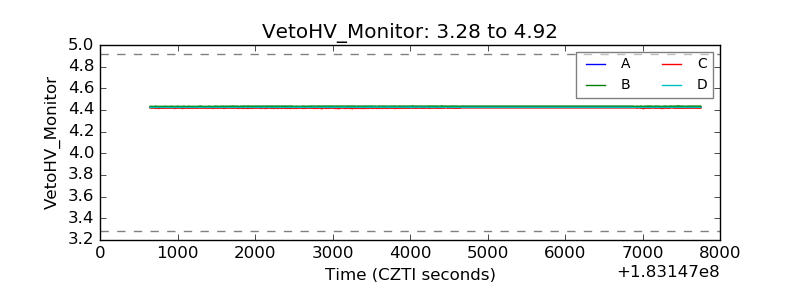 |
| Veto LLD | 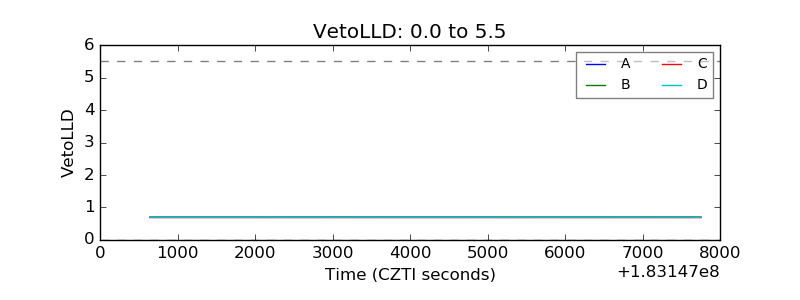 |
| Alpha Counter | 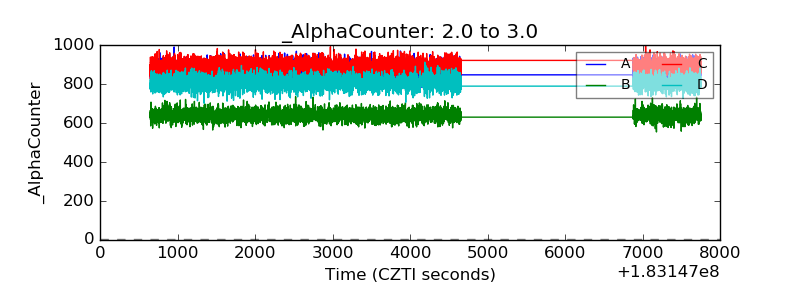 |
| _CPM_Rate | 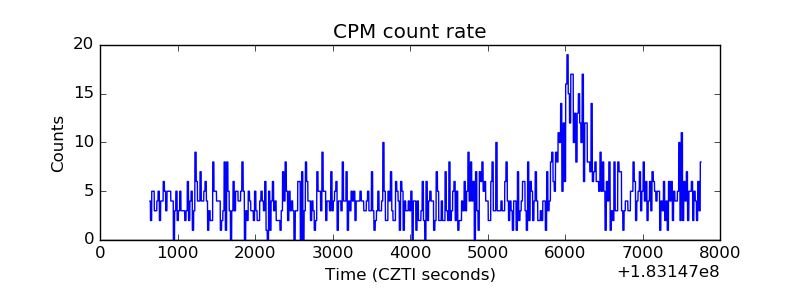 |
| CZT Counter |  |
| +2.5 Volts monitor |  |
| +5 Volts monitor |  |
| _ROLL_ROT | 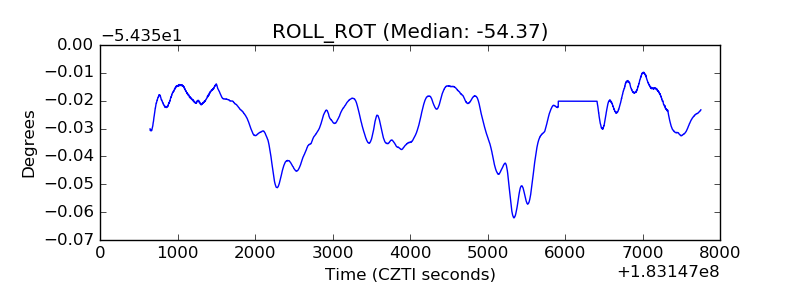 |
| _Roll_DEC | 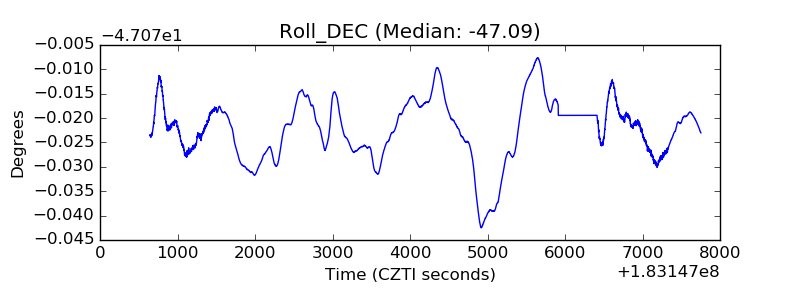 |
| _Roll_RA |  |
| Veto Counter | 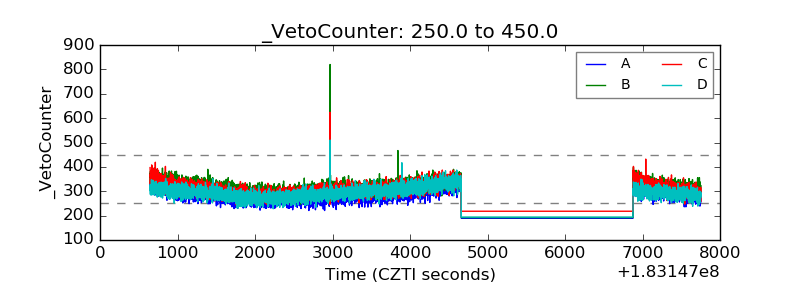 |