| Param | Original file | Final file |
|---|---|---|
| Filename | modeM0/AS1P01_161T01_9000000048cztM0_level2.fits | modeM0/AS1P01_161T01_9000000048cztM0_level2_quad_clean.evt |
| Size (bytes) | 153,959,040 | 130,158,720 |
| Size | 146.8 MB | 124.1 MB |
| Events in quadrant A | 862,506 | 690,151 |
| Events in quadrant B | 830,838 | 552,241 |
| Events in quadrant C | 922,156 | 750,864 |
| Events in quadrant D | 769,148 | 672,405 |
| Mode M0 | |||
|---|---|---|---|
| Quadrant | BADHDUFLAG | Total packets | Discarded packets |
| A | 0 | 101768 | 0 |
| B | 0 | 109791 | 0 |
| C | 0 | 76040 | 0 |
| D | 0 | 85494 | 0 |
| Mode SS | |||
|---|---|---|---|
| Quadrant | BADHDUFLAG | Total packets | Discarded packets |
| A | 0 | 380 | 0 |
| B | 0 | 380 | 0 |
| C | 0 | 380 | 0 |
| D | 0 | 380 | 0 |
| Mode M9 | |||
|---|---|---|---|
| Quadrant | BADHDUFLAG | Total packets | Discarded packets |
| A | 0 | 77 | 0 |
| B | 0 | 77 | 0 |
| C | 0 | 77 | 0 |
| D | 0 | 77 | 0 |
| Quadrant | Total seconds | Saturated seconds | Saturation percentage |
|---|---|---|---|
| A | 18497 | 2161 | 11.682976% |
| B | 18497 | 3637 | 19.662648% |
| C | 18497 | 4 | 0.021625% |
| D | 18497 | 559 | 3.022112% |
Noise dominated data is calculated using 1-second bins in cleaned event files. If a bin has >2000 counts, and if more than 50% of those come from <1% of pixels, then it is considered to be noise-dominated and hence unusable.
| Quadrant | # 1 sec bins | Bins with >0 counts | Bins with >2000 counts | High rate bins dominated by noise | Noise dominated (total time) | Noise dominated (detector-on time) | Marked lightcurve |
|---|---|---|---|---|---|---|---|
| A | 27728 | 18426 | 0 | 0 | 0.00% | 0.00% |  |
| B | 27728 | 18497 | 0 | 0 | 0.00% | 0.00% |  |
| C | 27728 | 18498 | 0 | 0 | 0.00% | 0.00% |  |
| D | 27728 | 18446 | 0 | 0 | 0.00% | 0.00% |  |
Top three noisy pixels from each quadrant. If the there are fewer than three noisy pixels in the level2.evt file, extra rows are filled as -1
| Pixel properties | Quadrant properties | ||||||
|---|---|---|---|---|---|---|---|
| Quadrant | DetID | PixID | Counts | Sigma | Mean | Median | Sigma |
| A | 7 | 110 | 879 | 12.44 | 224 | 210 | 53.8 |
| A | 0 | 29 | 803 | 11.03 | 224 | 210 | 53.8 |
| A | 14 | 249 | 622 | 7.66 | 224 | 210 | 53.8 |
| B | 2 | 9 | 702 | 11.95 | 220 | 211 | 41.1 |
| B | 14 | 254 | 594 | 9.32 | 220 | 211 | 41.1 |
| B | 2 | 8 | 545 | 8.13 | 220 | 211 | 41.1 |
| C | 12 | 241 | 646 | 6.78 | 243 | 227 | 61.8 |
| C | 2 | 191 | 623 | 6.41 | 243 | 227 | 61.8 |
| C | 3 | 187 | 607 | 6.15 | 243 | 227 | 61.8 |
| D | 6 | 44 | 601 | 7.33 | 220 | 203 | 54.3 |
| D | 11 | 82 | 598 | 7.28 | 220 | 203 | 54.3 |
| D | 3 | 14 | 555 | 6.49 | 220 | 203 | 54.3 |
Histogram calculated using DETX and DETY for each event in the final _common_clean file
| Quadrant A |  |
 |
Quadrant B |
|---|---|---|---|
| Quadrant D | 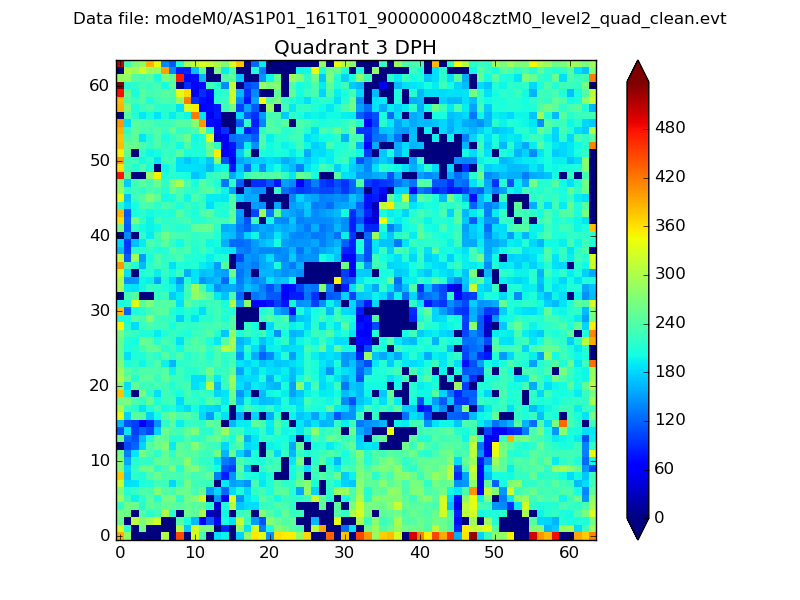 |
 |
Quadrant C |
| Plot type | Count rate plots | Images |
|---|---|---|
| Comparison with Poisson distribution Blue bars denote a histogram of data divided into 1 sec bins. Red curve is a Poisson curve with rate = median count rate of data. |
 |
 |
| Quadrant-wise count rates Data is divided into 100 sec bins |
 |
|
| Module-wise count rates for Quadrant A Data is divided into 100 sec bins |
 |
 |
| Module-wise count rates for Quadrant B Data is divided into 100 sec bins |
 |
 |
| Module-wise count rates for Quadrant C Data is divided into 100 sec bins |
 |
 |
| Module-wise count rates for Quadrant D Data is divided into 100 sec bins |
 |
 |
| Parameter | Plot |
|---|---|
| CZT HV Monitor |  |
| D_VDD |  |
| Temperature 1 |  |
| Veto HV Monitor |  |
| Veto LLD |  |
| Alpha Counter |  |
| _CPM_Rate |  |
| CZT Counter |  |
| +2.5 Volts monitor |  |
| +5 Volts monitor |  |
| _ROLL_ROT | 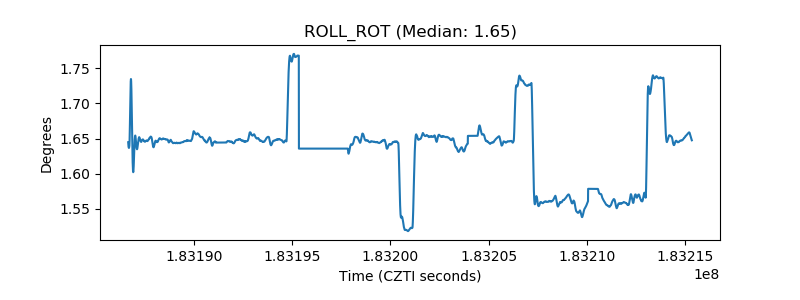 |
| _Roll_DEC | 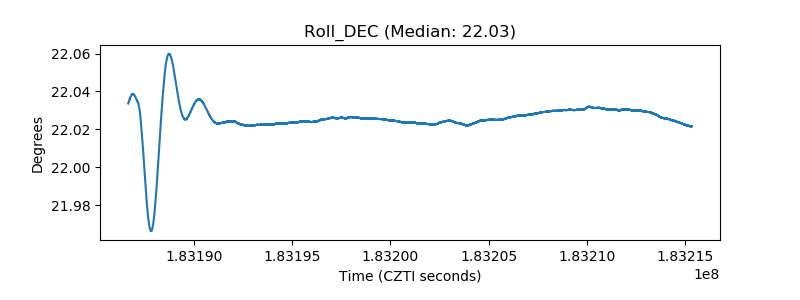 |
| _Roll_RA | 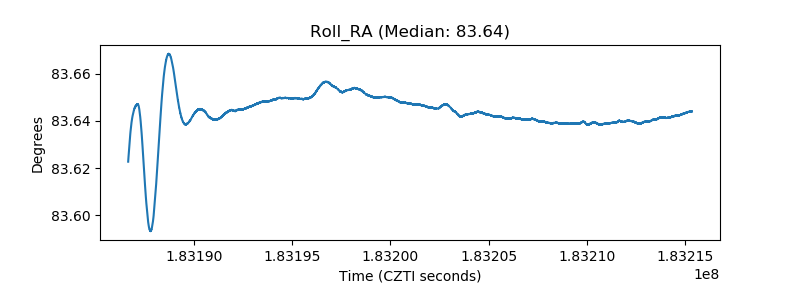 |
| Veto Counter |  |