| Param | Original file | Final file |
|---|---|---|
| Filename | modeM0/AS1P01_161T05_9000000050cztM0_level2.fits | modeM0/AS1P01_161T05_9000000050cztM0_level2_quad_clean.evt |
| Size (bytes) | 32,745,600 | 13,435,200 |
| Size | 31.2 MB | 12.8 MB |
| Events in quadrant A | 174,812 | 26,333 |
| Events in quadrant B | 182,164 | 34,769 |
| Events in quadrant C | 192,064 | 33,744 |
| Events in quadrant D | 158,578 | 26,880 |
| Mode M0 | |||
|---|---|---|---|
| Quadrant | BADHDUFLAG | Total packets | Discarded packets |
| A | 0 | 28496 | 0 |
| B | 0 | 19911 | 0 |
| C | 0 | 16236 | 0 |
| D | 0 | 20083 | 0 |
| Mode M9 | |||
|---|---|---|---|
| Quadrant | BADHDUFLAG | Total packets | Discarded packets |
| A | 0 | 19 | 0 |
| B | 0 | 19 | 0 |
| C | 0 | 19 | 0 |
| D | 0 | 19 | 0 |
| Mode SS | |||
|---|---|---|---|
| Quadrant | BADHDUFLAG | Total packets | Discarded packets |
| A | 0 | 82 | 0 |
| B | 0 | 82 | 0 |
| C | 0 | 82 | 0 |
| D | 0 | 82 | 0 |
| Quadrant | Total seconds | Saturated seconds | Saturation percentage |
|---|---|---|---|
| A | 4025 | 487 | 12.099379% |
| B | 4025 | 316 | 7.850932% |
| C | 4025 | 24 | 0.596273% |
| D | 4025 | 135 | 3.354037% |
Noise dominated data is calculated using 1-second bins in cleaned event files. If a bin has >2000 counts, and if more than 50% of those come from <1% of pixels, then it is considered to be noise-dominated and hence unusable.
| Quadrant | # 1 sec bins | Bins with >0 counts | Bins with >2000 counts | High rate bins dominated by noise | Noise dominated (total time) | Noise dominated (detector-on time) | Marked lightcurve |
|---|---|---|---|---|---|---|---|
| A | 4024 | 4023 | 0 | 0 | 0.00% | 0.00% |  |
| B | 4024 | 4024 | 0 | 0 | 0.00% | 0.00% |  |
| C | 4024 | 4024 | 0 | 0 | 0.00% | 0.00% | 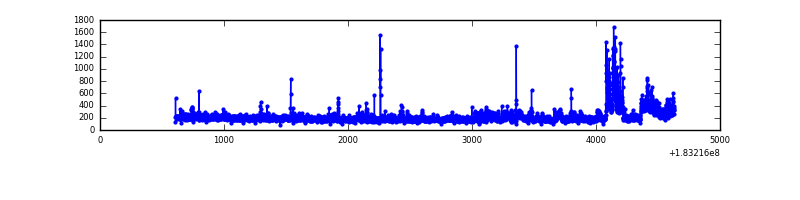 |
| D | 4024 | 4023 | 0 | 0 | 0.00% | 0.00% |  |
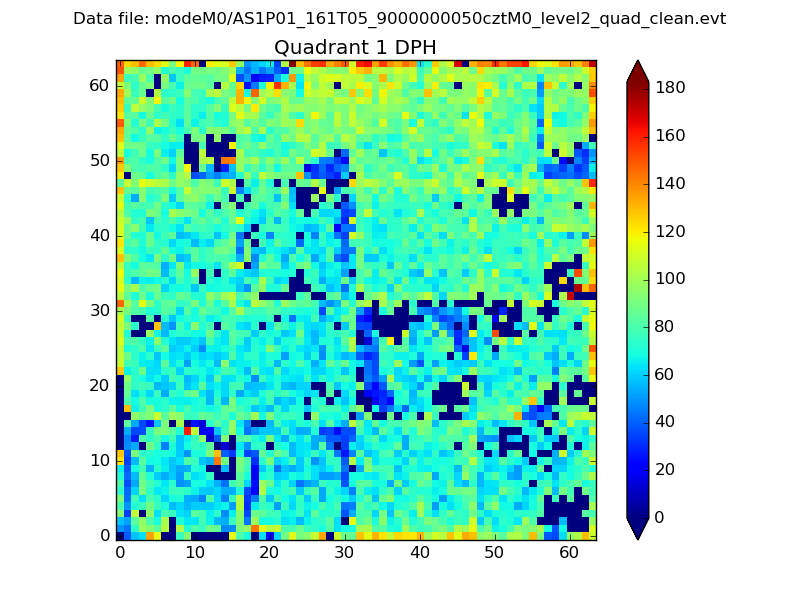
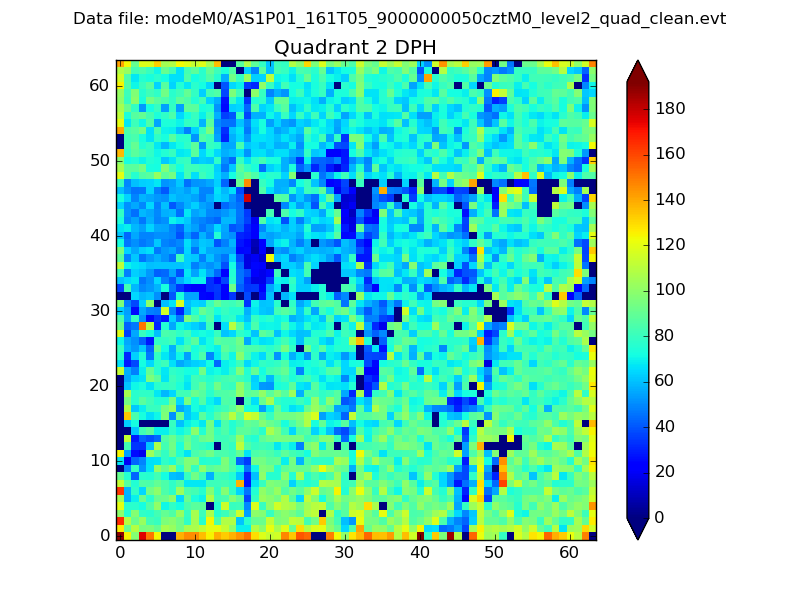
Top three noisy pixels from each quadrant. If the there are fewer than three noisy pixels in the level2.evt file, extra rows are filled as -1
| Pixel properties | Quadrant properties | ||||||
|---|---|---|---|---|---|---|---|
| Quadrant | DetID | PixID | Counts | Sigma | Mean | Median | Sigma |
| A | 0 | 29 | 179 | 11.0 | 45 | 43 | 12.4 |
| A | 7 | 110 | 155 | 9.06 | 45 | 43 | 12.4 |
| A | 0 | 30 | 132 | 7.2 | 45 | 43 | 12.4 |
| B | 2 | 9 | 141 | 8.55 | 48 | 46 | 11.1 |
| B | 2 | 8 | 119 | 6.57 | 48 | 46 | 11.1 |
| B | 10 | 225 | 118 | 6.48 | 48 | 46 | 11.1 |
| C | 2 | 191 | 155 | 7.56 | 50 | 47 | 14.3 |
| C | 3 | 203 | 151 | 7.28 | 50 | 47 | 14.3 |
| C | 3 | 202 | 132 | 5.95 | 50 | 47 | 14.3 |
| D | 6 | 44 | 134 | 7.19 | 45 | 41 | 12.9 |
| D | 11 | 82 | 127 | 6.65 | 45 | 41 | 12.9 |
| D | 3 | 14 | 125 | 6.49 | 45 | 41 | 12.9 |
Histogram calculated using DETX and DETY for each event in the final _common_clean file
| Quadrant A | 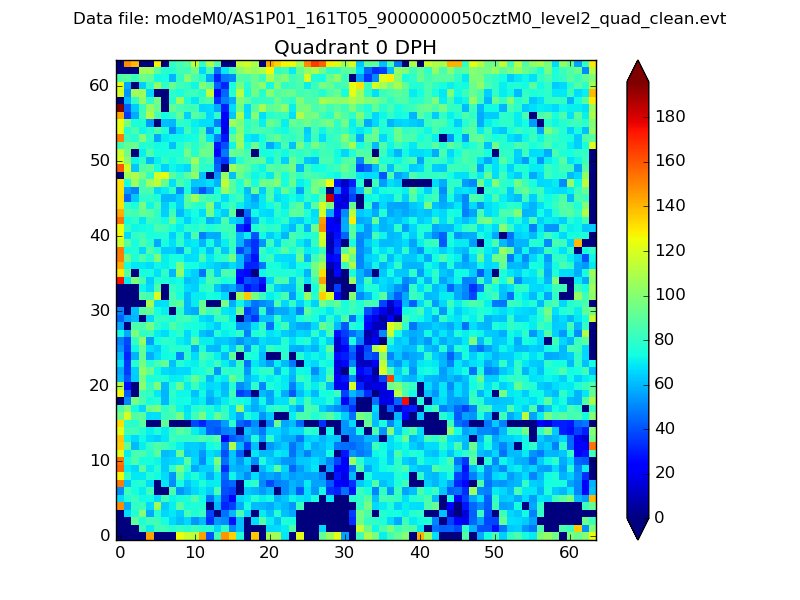 |
 |
Quadrant B |
|---|---|---|---|
| Quadrant D |  |
 |
Quadrant C |
| Plot type | Count rate plots | Images |
|---|---|---|
| Comparison with Poisson distribution Blue bars denote a histogram of data divided into 1 sec bins. Red curve is a Poisson curve with rate = median count rate of data. |
 |
 |
| Quadrant-wise count rates Data is divided into 100 sec bins |
 |
|
| Module-wise count rates for Quadrant A Data is divided into 100 sec bins |
 |
 |
| Module-wise count rates for Quadrant B Data is divided into 100 sec bins |
 |
 |
| Module-wise count rates for Quadrant C Data is divided into 100 sec bins |
 |
 |
| Module-wise count rates for Quadrant D Data is divided into 100 sec bins |
 |
 |
| Parameter | Plot |
|---|---|
| CZT HV Monitor |  |
| D_VDD | 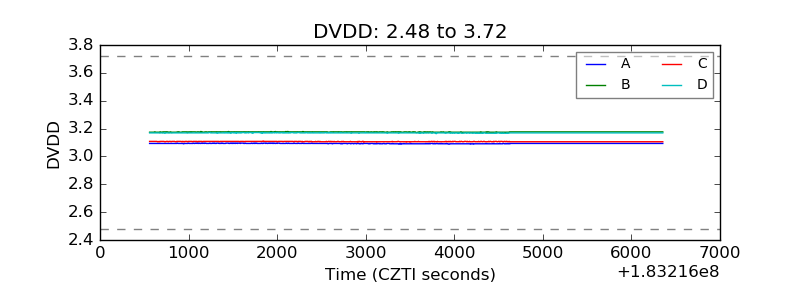 |
| Temperature 1 |  |
| Veto HV Monitor |  |
| Veto LLD |  |
| Alpha Counter |  |
| _CPM_Rate |  |
| CZT Counter |  |
| +2.5 Volts monitor |  |
| +5 Volts monitor |  |
| _ROLL_ROT |  |
| _Roll_DEC |  |
| _Roll_RA | 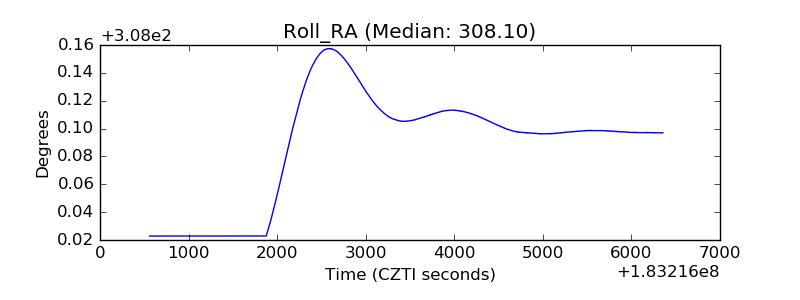 |
| Veto Counter |  |