| Param | Original file | Final file |
|---|---|---|
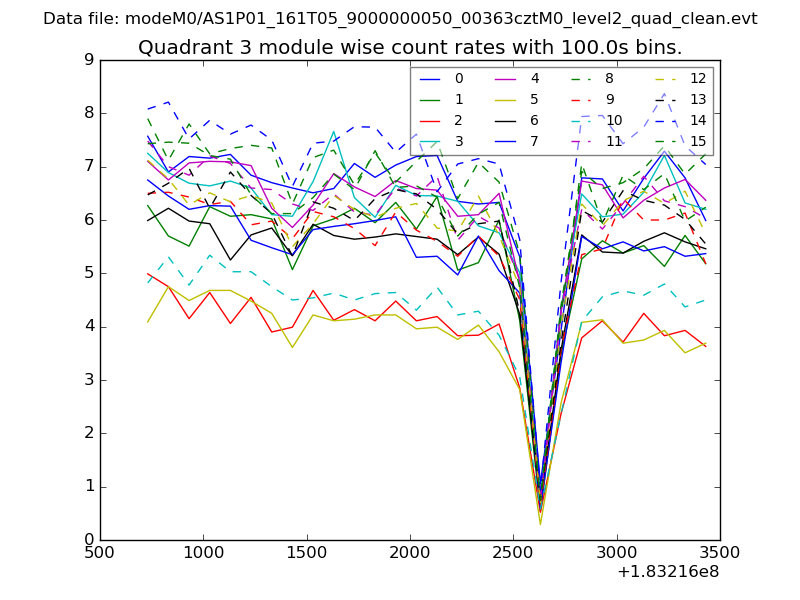
| Filename | modeM0/AS1P01_161T05_9000000050_00363cztM0_level2.evt | modeM0/AS1P01_161T05_9000000050_00363cztM0_level2_quad_clean.evt |
| Size (bytes) | 800,285,760 | 43,781,760 |
| Size | 763.2 MB | 41.8 MB |
| Events in quadrant A | 8,430,943 | 252,232 |
| Events in quadrant B | 5,555,883 | 271,283 |
| Events in quadrant C | 4,360,836 | 271,807 |
| Events in quadrant D | 5,630,856 | 253,934 |
| Mode M0 | |||
|---|---|---|---|
| Quadrant | BADHDUFLAG | Total packets | Discarded packets |
| A | 0 | 27839 | 0 |
| B | 0 | 19329 | 0 |
| C | 0 | 15729 | 0 |
| D | 0 | 19482 | 0 |
| Mode M9 | |||
|---|---|---|---|
| Quadrant | BADHDUFLAG | Total packets | Discarded packets |
| A | 0 | 18 | 0 |
| B | 0 | 18 | 0 |
| C | 0 | 18 | 0 |
| D | 0 | 18 | 0 |
| Mode SS | |||
|---|---|---|---|
| Quadrant | BADHDUFLAG | Total packets | Discarded packets |
| A | 0 | 80 | 0 |
| B | 0 | 80 | 0 |
| C | 0 | 80 | 0 |
| D | 0 | 80 | 0 |
| Quadrant | Total seconds | Saturated seconds | Saturation percentage |
|---|---|---|---|
| A | 3907 | 481 | 12.311236% |
| B | 3907 | 315 | 8.062452% |
| C | 3907 | 23 | 0.588687% |
| D | 3907 | 132 | 3.378551% |
Noise dominated data is calculated using 1-second bins in cleaned event files. If a bin has >2000 counts, and if more than 50% of those come from <1% of pixels, then it is considered to be noise-dominated and hence unusable.
| Quadrant | # 1 sec bins | Bins with >0 counts | Bins with >2000 counts | High rate bins dominated by noise | Noise dominated (total time) | Noise dominated (detector-on time) | Marked lightcurve |
|---|---|---|---|---|---|---|---|
| A | 3907 | 3907 | 2195 | 2195 | 56.18% | 56.18% | 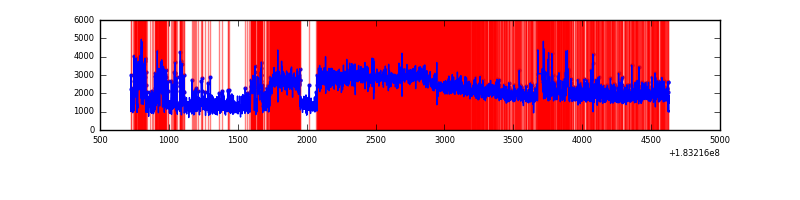 |
| B | 3907 | 3907 | 540 | 540 | 13.82% | 13.82% | 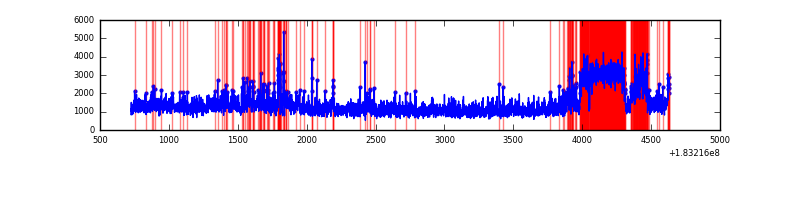 |
| C | 3907 | 3907 | 71 | 71 | 1.82% | 1.82% | 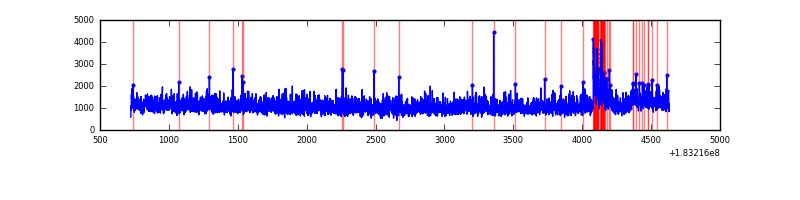 |
| D | 3907 | 3907 | 543 | 543 | 13.90% | 13.90% | 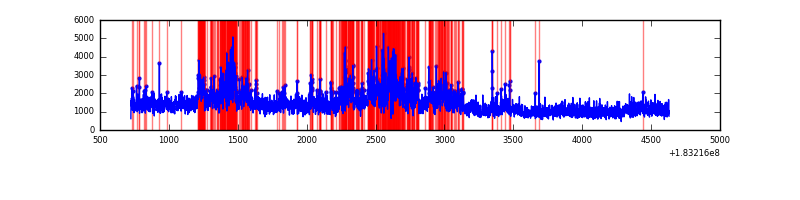 |
Top three noisy pixels from each quadrant. If the there are fewer than three noisy pixels in the level2.evt file, extra rows are filled as -1
| Pixel properties | Quadrant properties | ||||||
|---|---|---|---|---|---|---|---|
| Quadrant | DetID | PixID | Counts | Sigma | Mean | Median | Sigma |
| A | 15 | 216 | 3402598 | 13770.55 | 1109 | 1099 | 247.0 |
| A | 0 | 69 | 498715 | 2014.54 | 1109 | 1099 | 247.0 |
| A | 12 | 150 | 110541 | 443.06 | 1109 | 1099 | 247.0 |
| B | 2 | 2 | 883362 | 3412.64 | 1111 | 1116 | 258.5 |
| B | 7 | 220 | 143600 | 551.15 | 1111 | 1116 | 258.5 |
| B | 0 | 234 | 100297 | 383.65 | 1111 | 1116 | 258.5 |
| C | 4 | 253 | 168095 | 571.88 | 1045 | 1084 | 292.0 |
| C | 1 | 1 | 43500 | 145.24 | 1045 | 1084 | 292.0 |
| C | 3 | 159 | 9870 | 30.09 | 1045 | 1084 | 292.0 |
| D | 7 | 85 | 1070851 | 3422.37 | 1002 | 1040 | 312.6 |
| D | 2 | 152 | 225411 | 717.77 | 1002 | 1040 | 312.6 |
| D | 14 | 52 | 88443 | 279.61 | 1002 | 1040 | 312.6 |
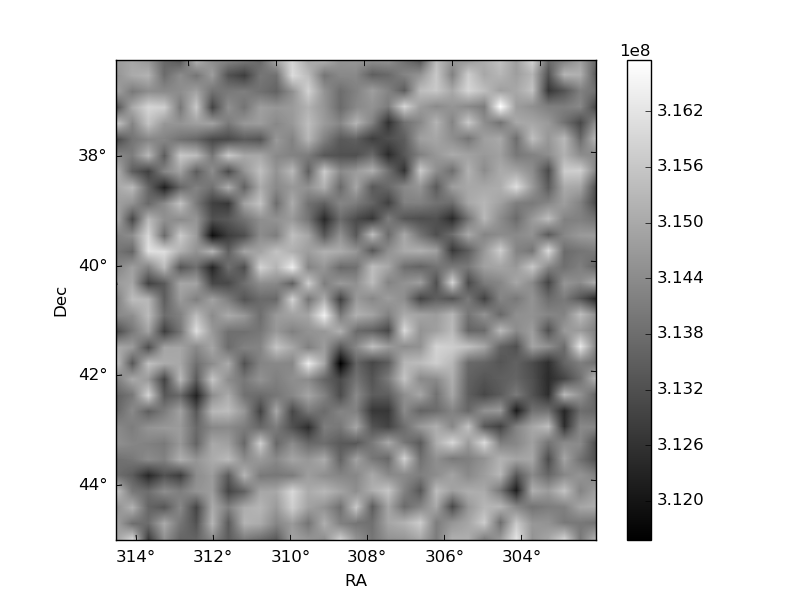
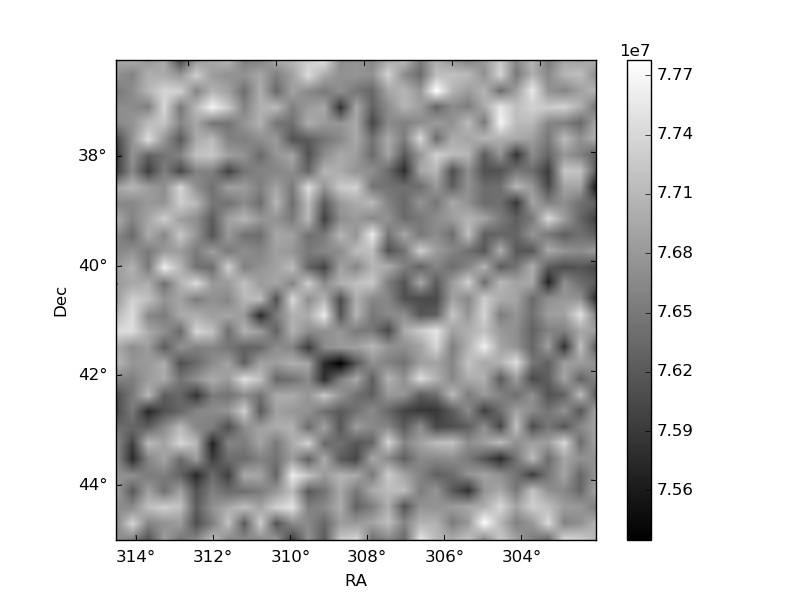
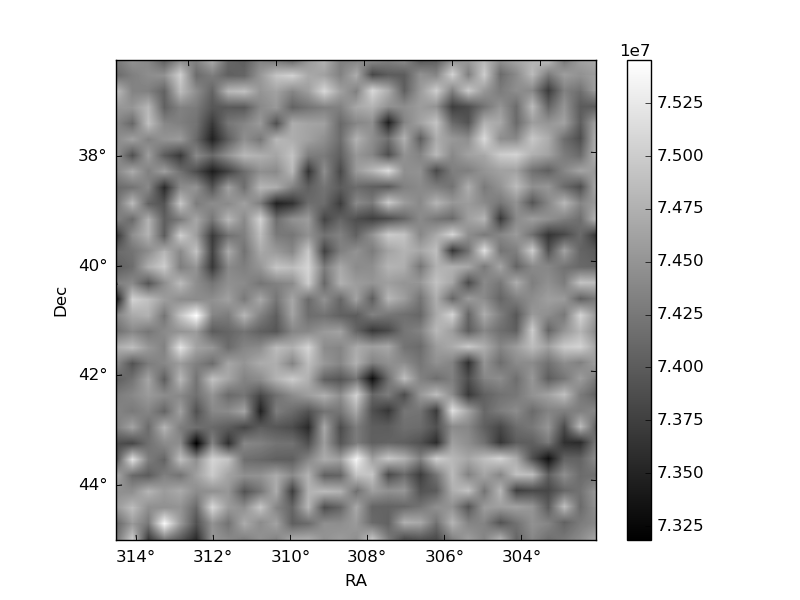
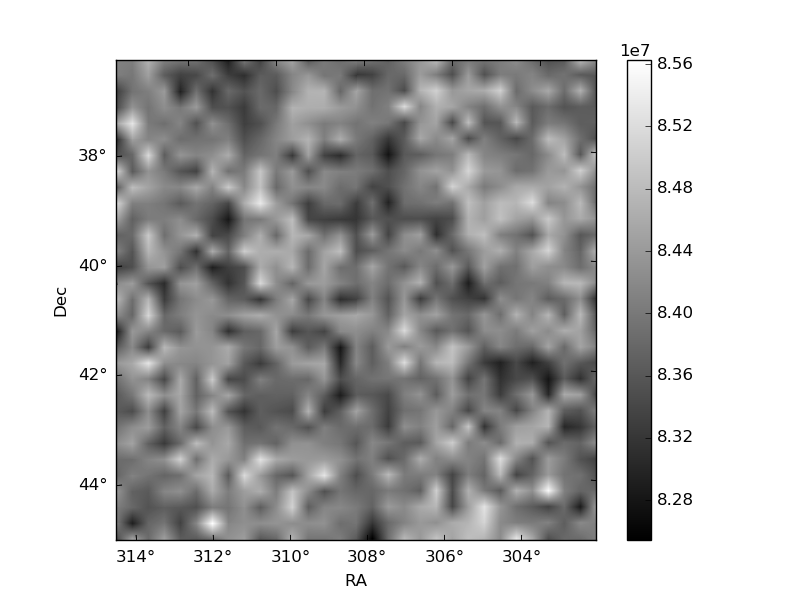
Histogram calculated using DETX and DETY for each event in the final _common_clean file
| Quadrant A | 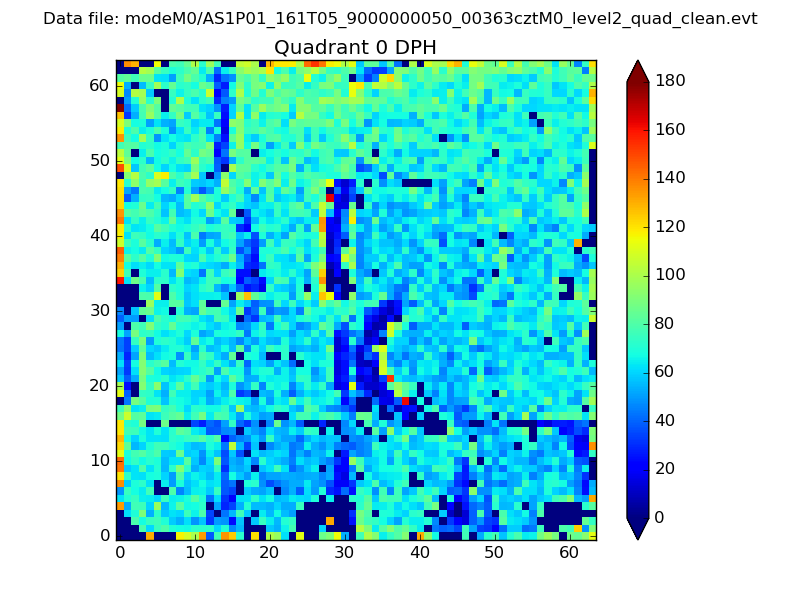 |
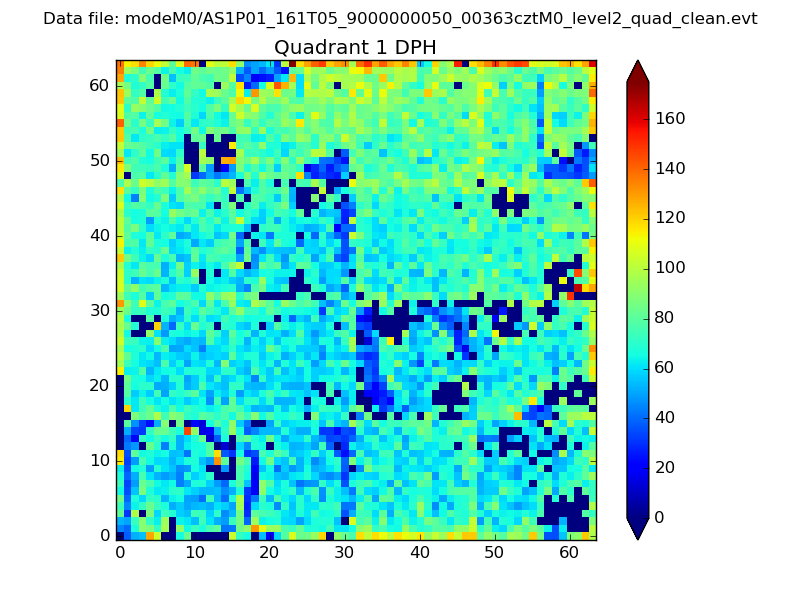 |
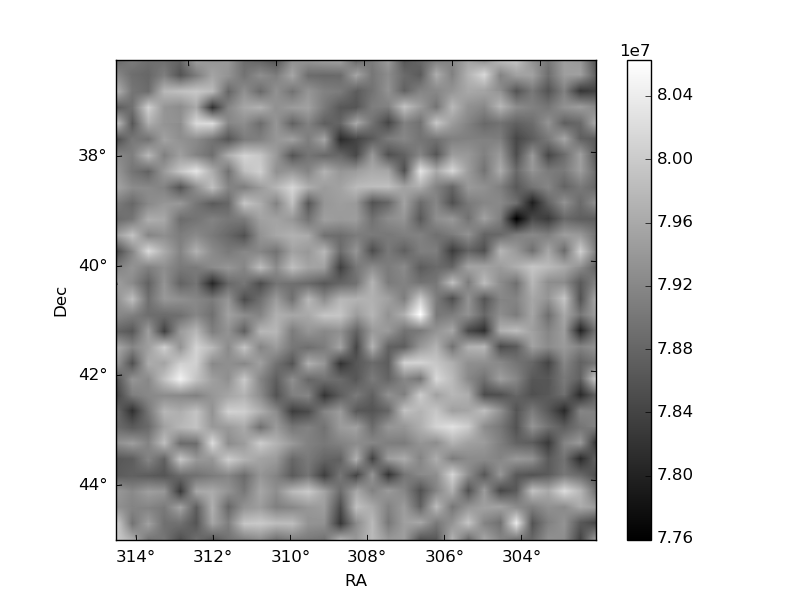
Quadrant B |
|---|---|---|---|
| Quadrant D | 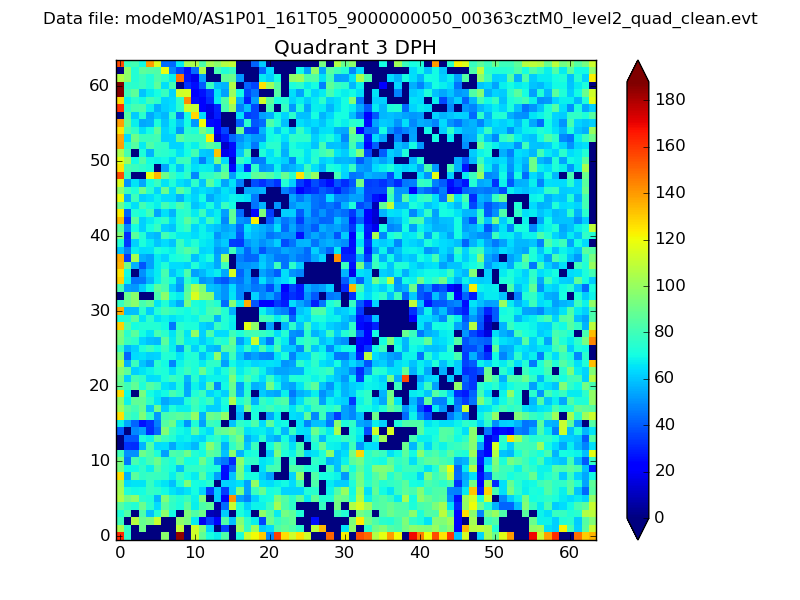 |
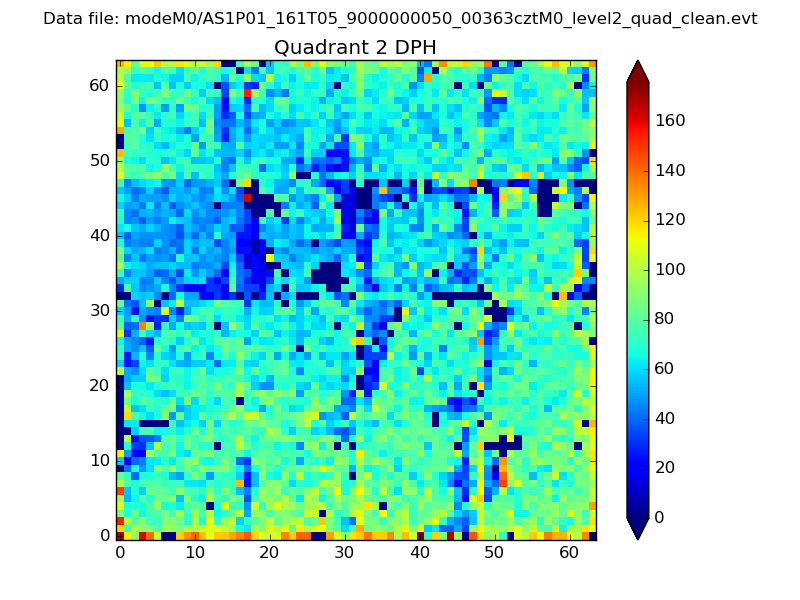 |
Quadrant C |
| Plot type | Count rate plots | Images |
|---|---|---|
| Comparison with Poisson distribution Blue bars denote a histogram of data divided into 1 sec bins. Red curve is a Poisson curve with rate = median count rate of data. |
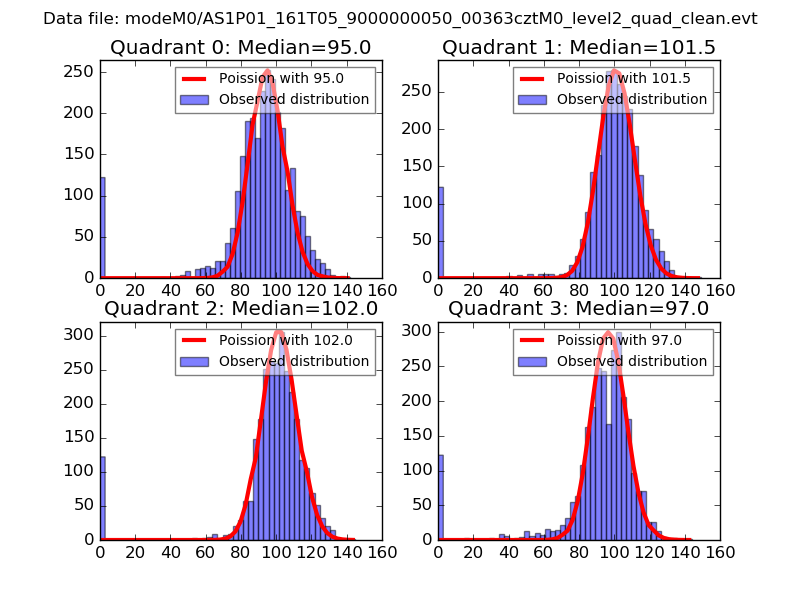 |
 |
| Quadrant-wise count rates Data is divided into 100 sec bins |
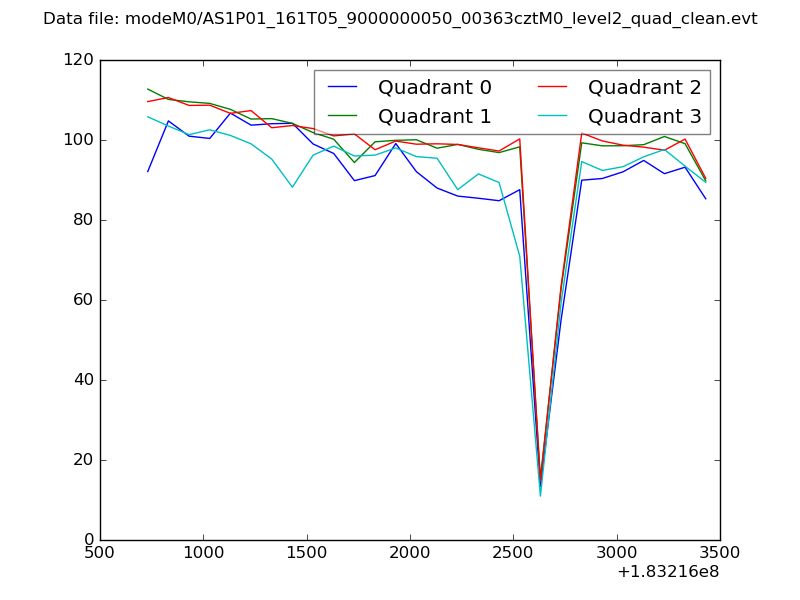 |
|
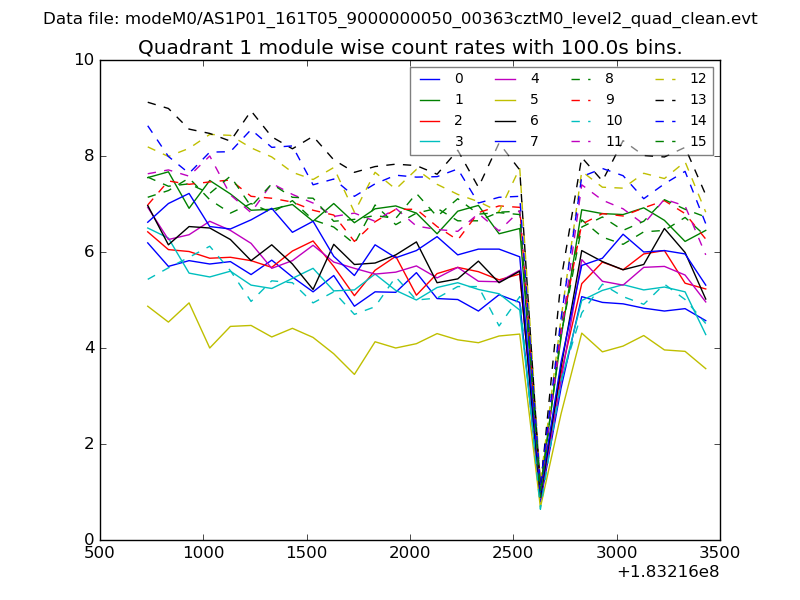
| Module-wise count rates for Quadrant A Data is divided into 100 sec bins |
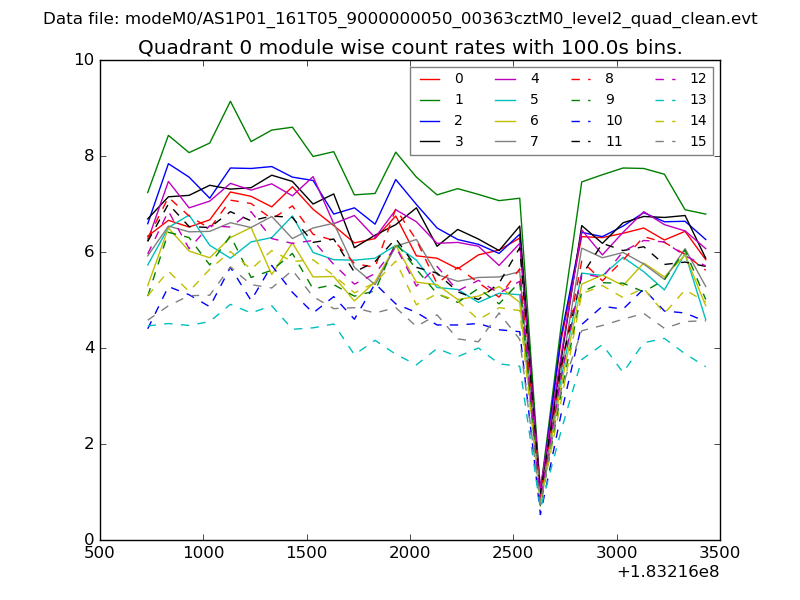 |
 |
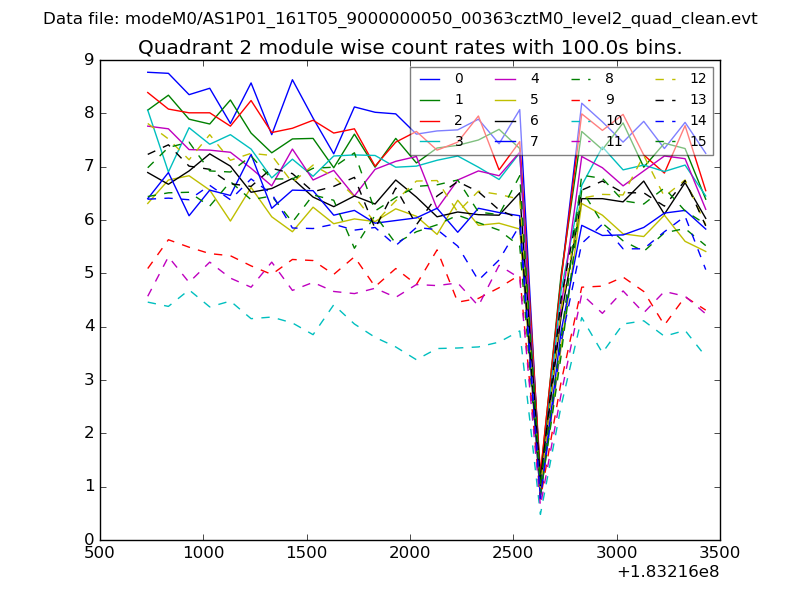
| Module-wise count rates for Quadrant B Data is divided into 100 sec bins |
 |
 |
| Module-wise count rates for Quadrant C Data is divided into 100 sec bins |
 |
 |
| Module-wise count rates for Quadrant D Data is divided into 100 sec bins |
 |
 |
| Parameter | Plot |
|---|---|
| CZT HV Monitor |  |
| D_VDD | 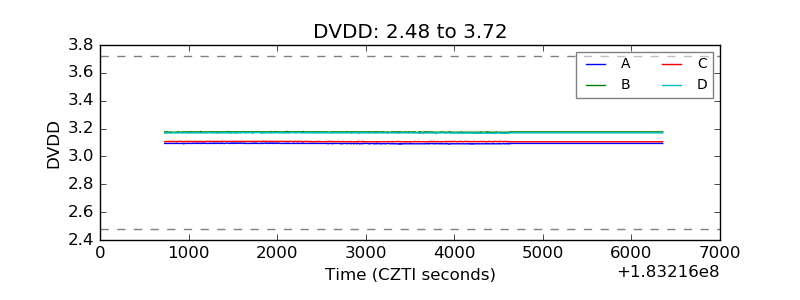 |
| Temperature 1 | 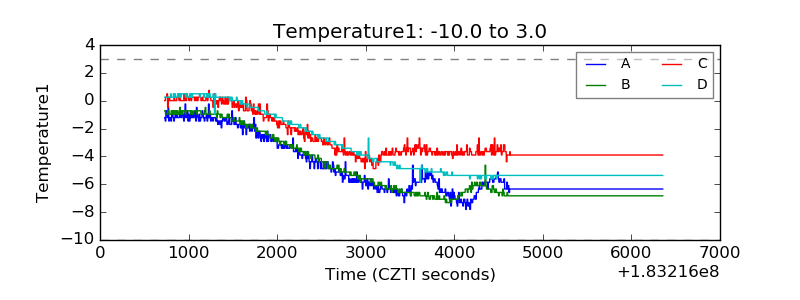 |
| Veto HV Monitor | 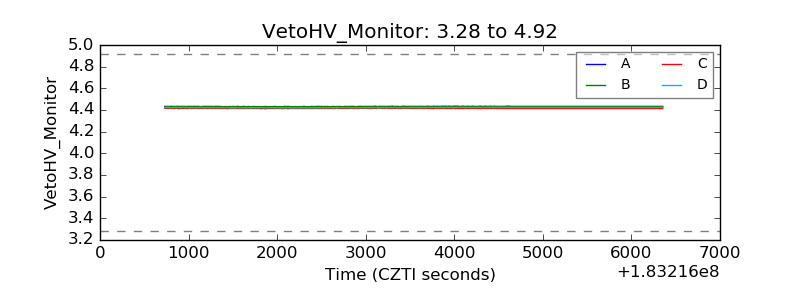 |
| Veto LLD | 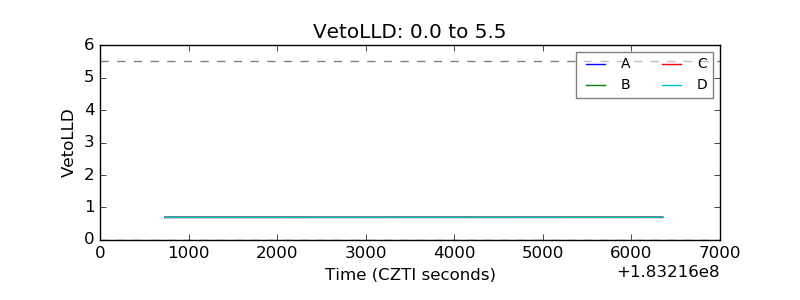 |
| Alpha Counter | 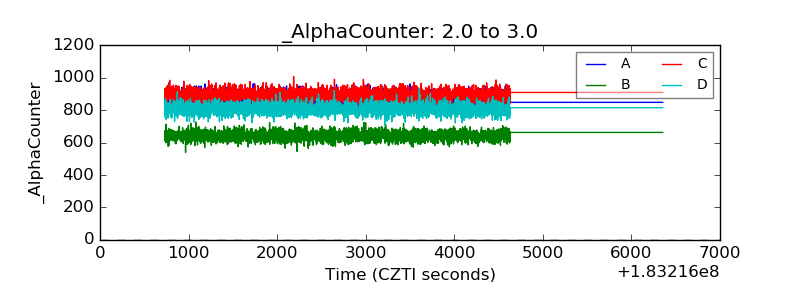 |
| _CPM_Rate | 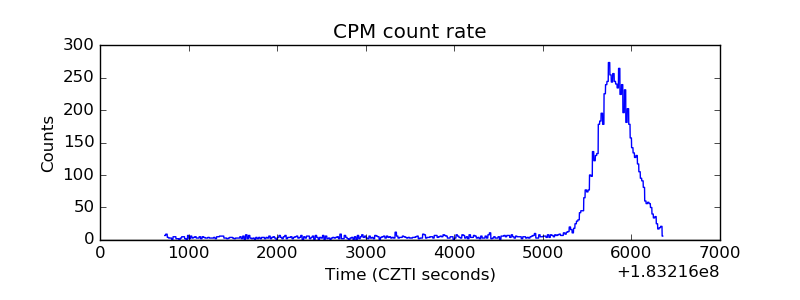 |
| CZT Counter | 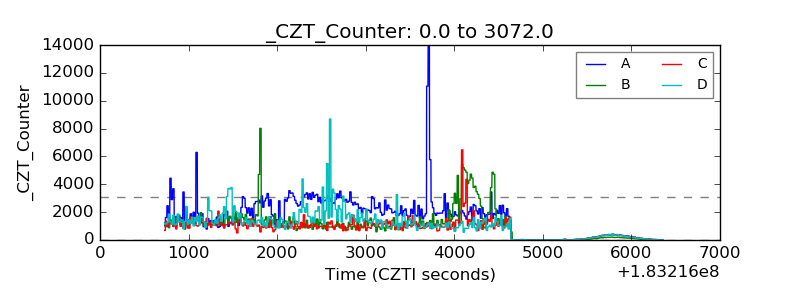 |
| +2.5 Volts monitor |  |
| +5 Volts monitor |  |
| _ROLL_ROT | 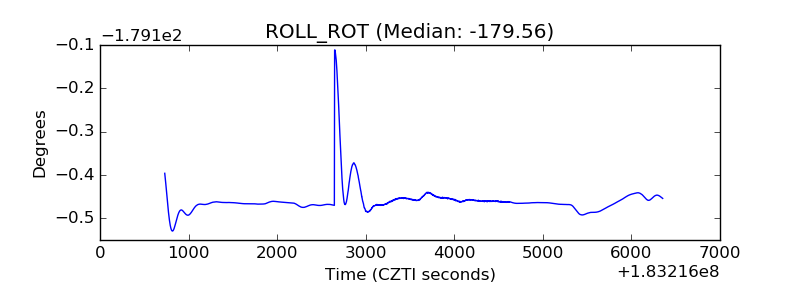 |
| _Roll_DEC | 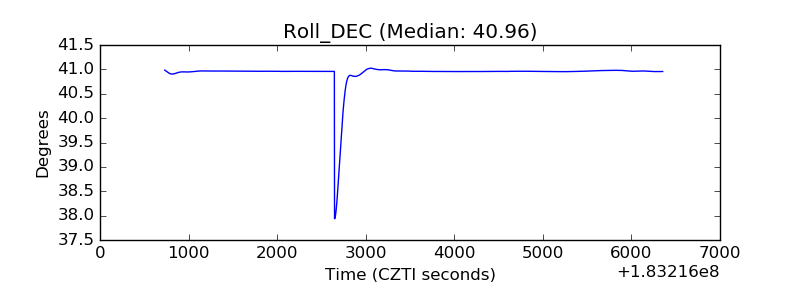 |
| _Roll_RA | 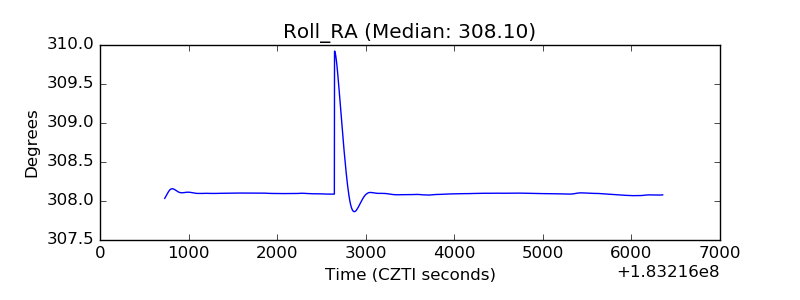 |
| Veto Counter | 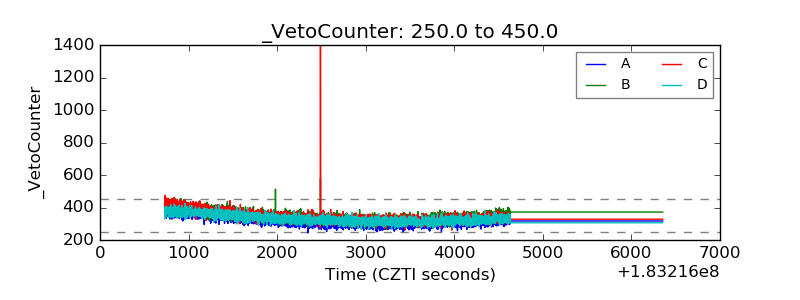 |