| Param | Original file | Final file |
|---|---|---|
| Filename | modeM0/AS1P01_162T05_9000000052cztM0_level2.fits | modeM0/AS1P01_162T05_9000000052cztM0_level2_quad_clean.evt |
| Size (bytes) | 205,937,280 | 228,957,120 |
| Size | 196.4 MB | 218.4 MB |
| Events in quadrant A | 1,185,458 | 1,497,493 |
| Events in quadrant B | 955,326 | 816,238 |
| Events in quadrant C | 1,199,156 | 1,426,015 |
| Events in quadrant D | 1,006,156 | 1,309,241 |
| Mode SS | |||
|---|---|---|---|
| Quadrant | BADHDUFLAG | Total packets | Discarded packets |
| A | 0 | 560 | 0 |
| B | 0 | 560 | 0 |
| C | 0 | 560 | 0 |
| D | 0 | 560 | 0 |
| Mode M9 | |||
|---|---|---|---|
| Quadrant | BADHDUFLAG | Total packets | Discarded packets |
| A | 0 | 158 | 0 |
| B | 0 | 158 | 0 |
| C | 0 | 158 | 0 |
| D | 0 | 158 | 0 |
| Mode M0 | |||
|---|---|---|---|
| Quadrant | BADHDUFLAG | Total packets | Discarded packets |
| A | 0 | 116137 | 0 |
| B | 0 | 218054 | 0 |
| C | 0 | 107960 | 0 |
| D | 0 | 112904 | 0 |
| Quadrant | Total seconds | Saturated seconds | Saturation percentage |
|---|---|---|---|
| A | 27405 | 58 | 0.211640% |
| B | 27405 | 13221 | 48.243021% |
| C | 27405 | 35 | 0.127714% |
| D | 27405 | 621 | 2.266010% |
Noise dominated data is calculated using 1-second bins in cleaned event files. If a bin has >2000 counts, and if more than 50% of those come from <1% of pixels, then it is considered to be noise-dominated and hence unusable.
| Quadrant | # 1 sec bins | Bins with >0 counts | Bins with >2000 counts | High rate bins dominated by noise | Noise dominated (total time) | Noise dominated (detector-on time) | Marked lightcurve |
|---|---|---|---|---|---|---|---|
| A | 43122 | 27405 | 0 | 0 | 0.00% | 0.00% |  |
| B | 43122 | 27399 | 0 | 0 | 0.00% | 0.00% | 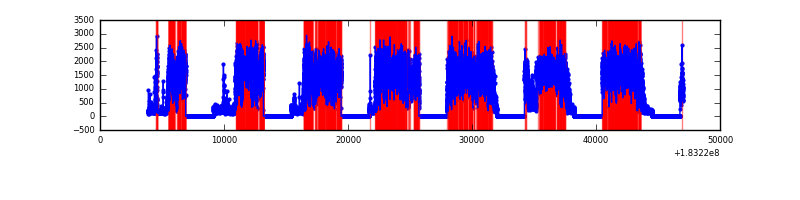 |
| C | 43122 | 27404 | 0 | 0 | 0.00% | 0.00% |  |
| D | 43122 | 27405 | 0 | 0 | 0.00% | 0.00% |  |
Top three noisy pixels from each quadrant. If the there are fewer than three noisy pixels in the level2.evt file, extra rows are filled as -1
| Pixel properties | Quadrant properties | ||||||
|---|---|---|---|---|---|---|---|
| Quadrant | DetID | PixID | Counts | Sigma | Mean | Median | Sigma |
| A | 7 | 110 | 1145 | 11.5 | 307 | 287 | 74.6 |
| A | 0 | 29 | 1131 | 11.31 | 307 | 287 | 74.6 |
| A | 0 | 30 | 837 | 7.37 | 307 | 287 | 74.6 |
| B | 2 | 9 | 827 | 12.15 | 253 | 240 | 48.3 |
| B | 5 | 128 | 725 | 10.04 | 253 | 240 | 48.3 |
| B | 14 | 254 | 664 | 8.78 | 253 | 240 | 48.3 |
| C | 12 | 241 | 906 | 7.68 | 316 | 292 | 80.0 |
| C | 3 | 187 | 829 | 6.71 | 316 | 292 | 80.0 |
| C | 2 | 191 | 789 | 6.21 | 316 | 292 | 80.0 |
| D | 11 | 82 | 788 | 7.27 | 288 | 264 | 72.0 |
| D | 6 | 231 | 737 | 6.57 | 288 | 264 | 72.0 |
| D | 6 | 44 | 732 | 6.5 | 288 | 264 | 72.0 |
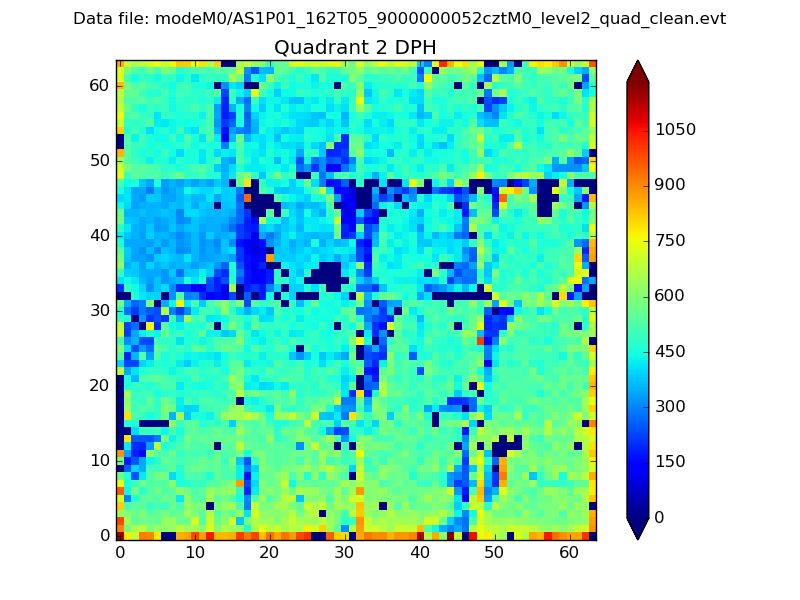
Histogram calculated using DETX and DETY for each event in the final _common_clean file
| Quadrant A | 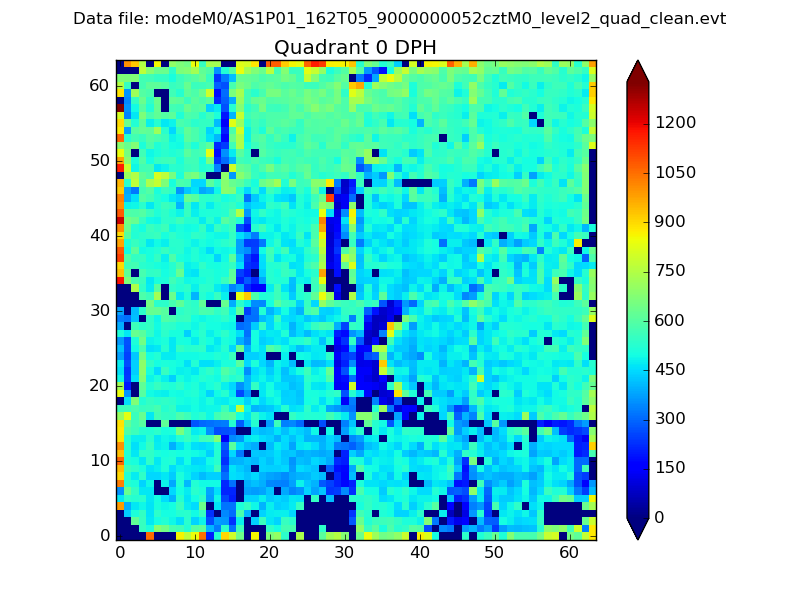 |
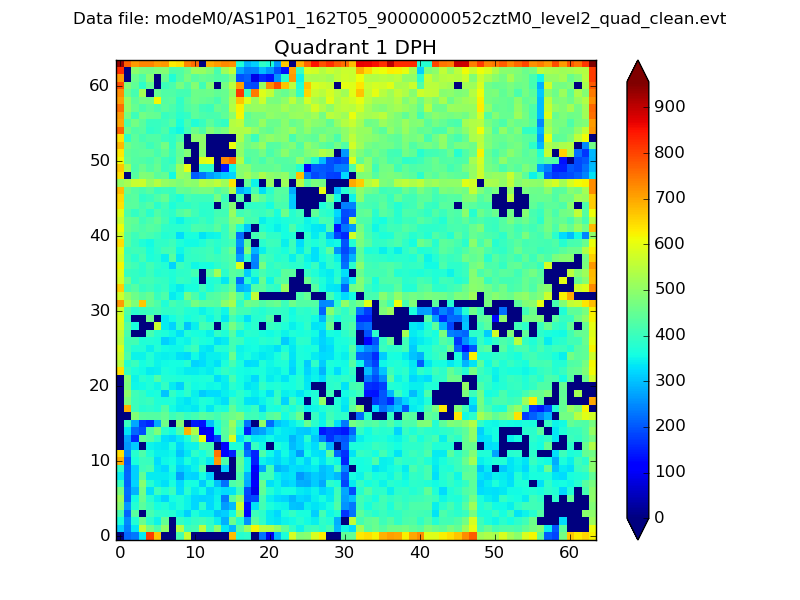 |
Quadrant B |
|---|---|---|---|
| Quadrant D | 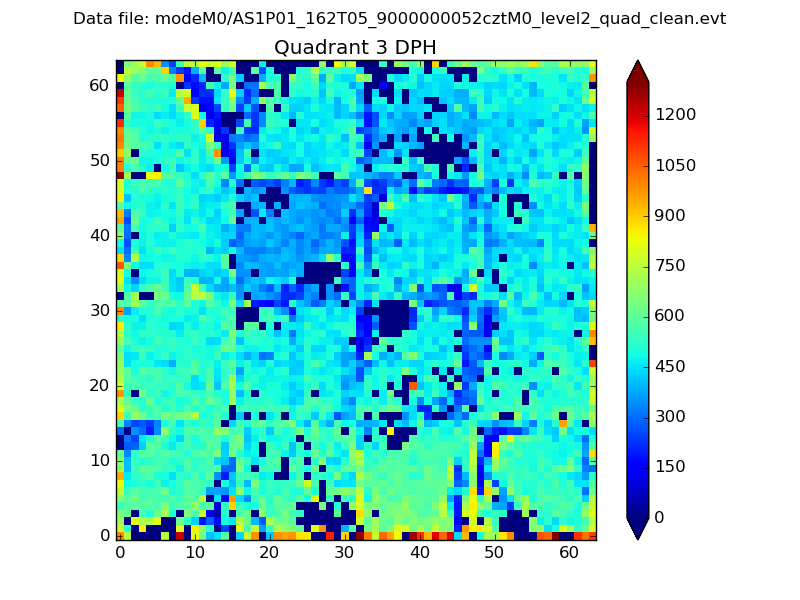 |
 |
Quadrant C |
| Plot type | Count rate plots | Images |
|---|---|---|
| Comparison with Poisson distribution Blue bars denote a histogram of data divided into 1 sec bins. Red curve is a Poisson curve with rate = median count rate of data. |
 |
 |
| Quadrant-wise count rates Data is divided into 100 sec bins |
 |
|
| Module-wise count rates for Quadrant A Data is divided into 100 sec bins |
 |
 |
| Module-wise count rates for Quadrant B Data is divided into 100 sec bins |
 |
 |
| Module-wise count rates for Quadrant C Data is divided into 100 sec bins |
 |
 |
| Module-wise count rates for Quadrant D Data is divided into 100 sec bins |
 |
 |
| Parameter | Plot |
|---|---|
| CZT HV Monitor |  |
| D_VDD | 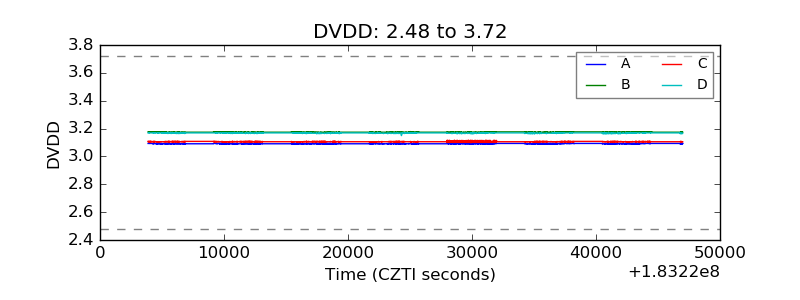 |
| Temperature 1 | 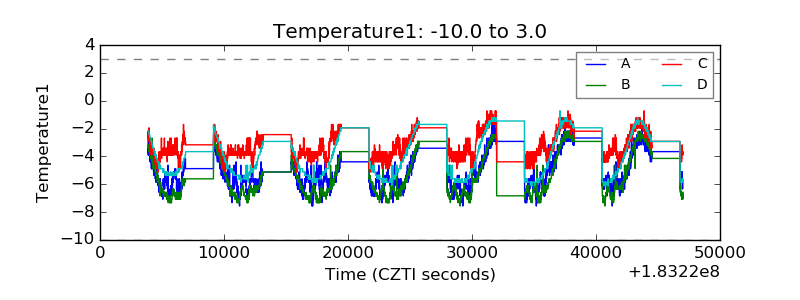 |
| Veto HV Monitor | 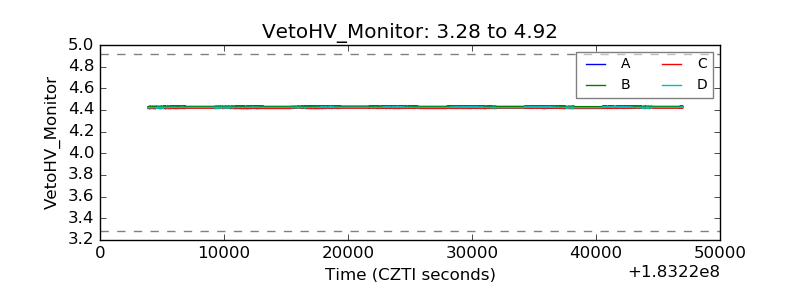 |
| Veto LLD |  |
| Alpha Counter |  |
| _CPM_Rate |  |
| CZT Counter |  |
| +2.5 Volts monitor |  |
| +5 Volts monitor |  |
| _ROLL_ROT | 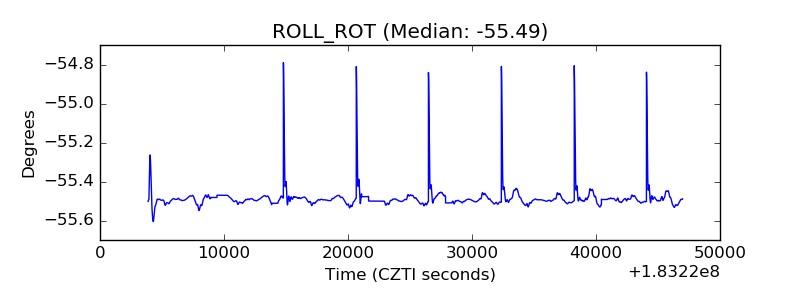 |
| _Roll_DEC | 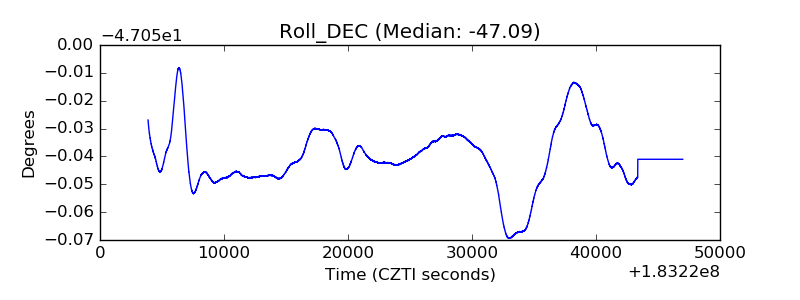 |
| _Roll_RA | 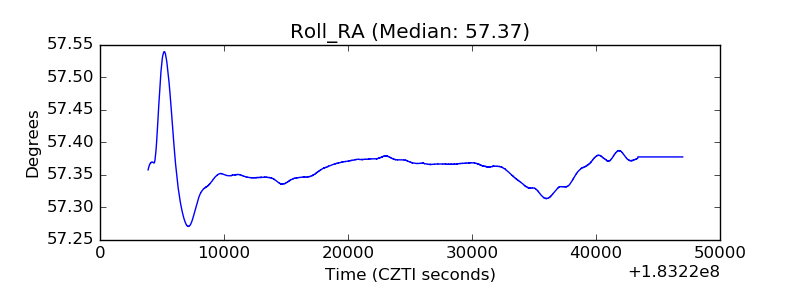 |
| Veto Counter | 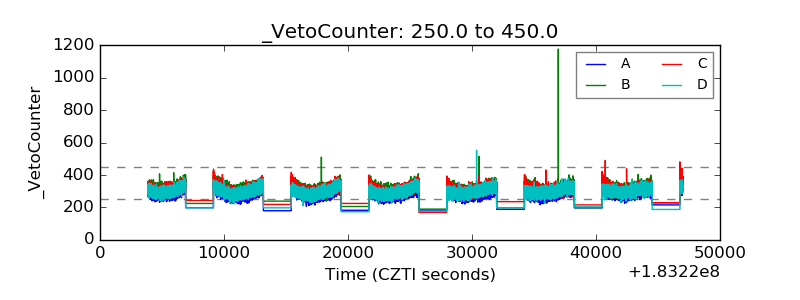 |