| Param | Original file | Final file |
|---|---|---|
| Filename | modeM0/AS1P01_162T05_9000000052_00367cztM0_level2.evt | modeM0/AS1P01_162T05_9000000052_00367cztM0_level2_quad_clean.evt |
| Size (bytes) | 895,294,080 | 52,922,880 |
| Size | 853.8 MB | 50.5 MB |
| Events in quadrant A | 5,334,053 | 343,349 |
| Events in quadrant B | 11,821,265 | 270,045 |
| Events in quadrant C | 4,895,292 | 336,852 |
| Events in quadrant D | 4,758,815 | 328,680 |
| Mode SS | |||
|---|---|---|---|
| Quadrant | BADHDUFLAG | Total packets | Discarded packets |
| A | 0 | 92 | 0 |
| B | 0 | 92 | 0 |
| C | 0 | 92 | 0 |
| D | 0 | 92 | 0 |
| Mode M9 | |||
|---|---|---|---|
| Quadrant | BADHDUFLAG | Total packets | Discarded packets |
| A | 0 | 23 | 0 |
| B | 0 | 23 | 0 |
| C | 0 | 23 | 0 |
| D | 0 | 24 | 0 |
| Mode M0 | |||
|---|---|---|---|
| Quadrant | BADHDUFLAG | Total packets | Discarded packets |
| A | 0 | 19096 | 3 |
| B | 0 | 38736 | 2 |
| C | 0 | 17831 | 2 |
| D | 0 | 17442 | 2 |
| Quadrant | Total seconds | Saturated seconds | Saturation percentage |
|---|---|---|---|
| A | 4592 | 2 | 0.043554% |
| B | 4592 | 2395 | 52.155923% |
| C | 4592 | 5 | 0.108885% |
| D | 4592 | 3 | 0.065331% |
Noise dominated data is calculated using 1-second bins in cleaned event files. If a bin has >2000 counts, and if more than 50% of those come from <1% of pixels, then it is considered to be noise-dominated and hence unusable.
| Quadrant | # 1 sec bins | Bins with >0 counts | Bins with >2000 counts | High rate bins dominated by noise | Noise dominated (total time) | Noise dominated (detector-on time) | Marked lightcurve |
|---|---|---|---|---|---|---|---|
| A | 6837 | 4593 | 87 | 87 | 1.27% | 1.89% |  |
| B | 6837 | 4593 | 3480 | 3480 | 50.90% | 75.77% |  |
| C | 6837 | 4593 | 38 | 38 | 0.56% | 0.83% |  |
| D | 6837 | 4593 | 34 | 34 | 0.50% | 0.74% | 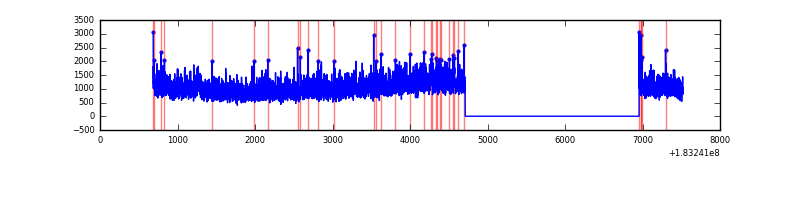 |
Top three noisy pixels from each quadrant. If the there are fewer than three noisy pixels in the level2.evt file, extra rows are filled as -1
| Pixel properties | Quadrant properties | ||||||
|---|---|---|---|---|---|---|---|
| Quadrant | DetID | PixID | Counts | Sigma | Mean | Median | Sigma |
| A | 0 | 238 | 187464 | 636.69 | 1315 | 1303 | 292.4 |
| A | 0 | 69 | 26821 | 87.27 | 1315 | 1303 | 292.4 |
| A | 12 | 243 | 16352 | 51.47 | 1315 | 1303 | 292.4 |
| B | 2 | 2 | 7386437 | 27671.11 | 1139 | 1143 | 266.9 |
| B | 0 | 220 | 27211 | 97.67 | 1139 | 1143 | 266.9 |
| B | 5 | 46 | 14888 | 51.5 | 1139 | 1143 | 266.9 |
| C | 14 | 206 | 30247 | 83.43 | 1233 | 1275 | 347.2 |
| C | 0 | 64 | 14705 | 38.68 | 1233 | 1275 | 347.2 |
| C | 5 | 17 | 5280 | 11.53 | 1233 | 1275 | 347.2 |
| D | 7 | 85 | 58792 | 156.6 | 1167 | 1212 | 367.7 |
| D | 2 | 166 | 46797 | 123.98 | 1167 | 1212 | 367.7 |
| D | 1 | 5 | 39534 | 104.23 | 1167 | 1212 | 367.7 |
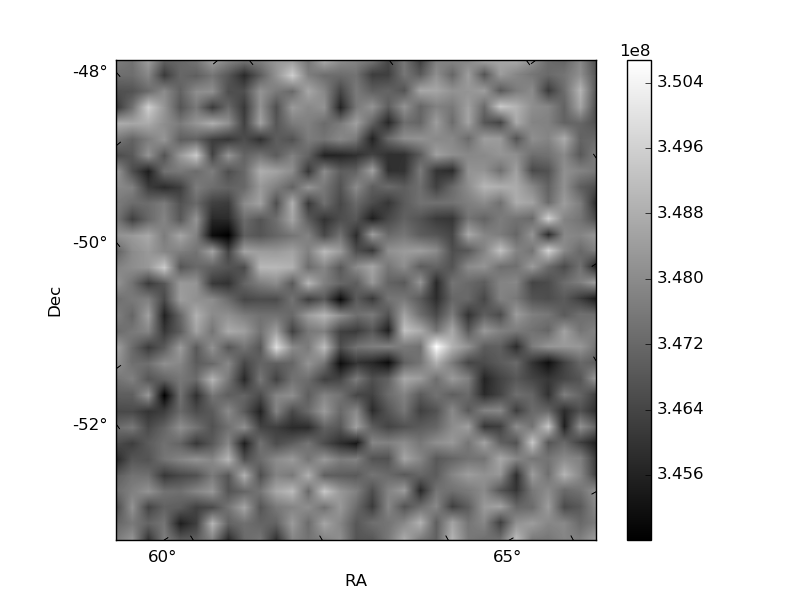
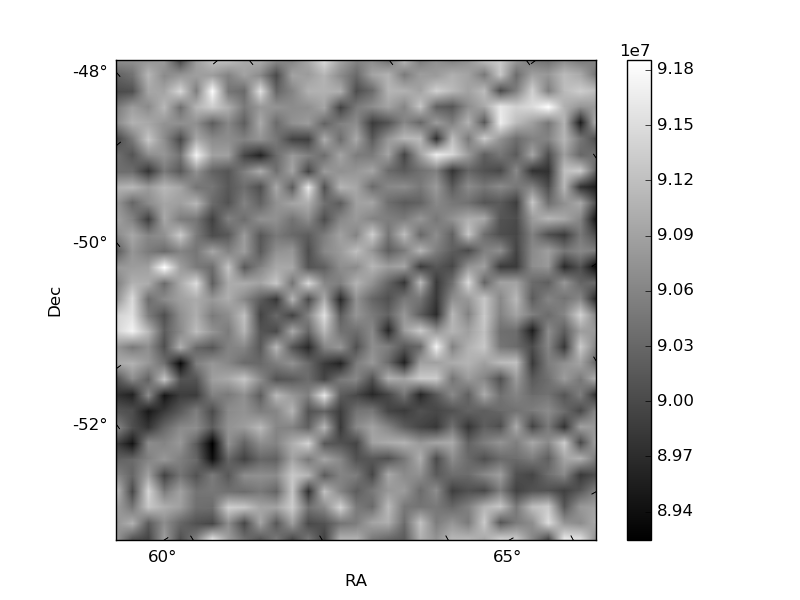
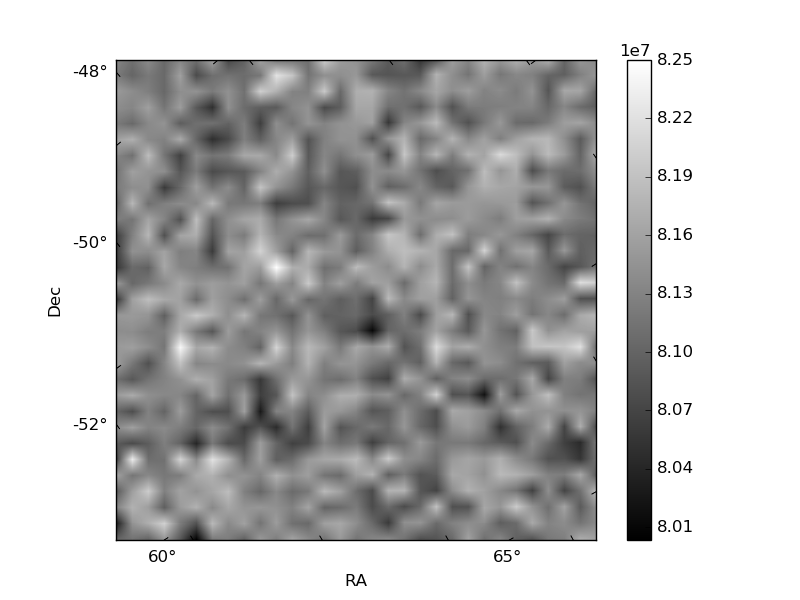
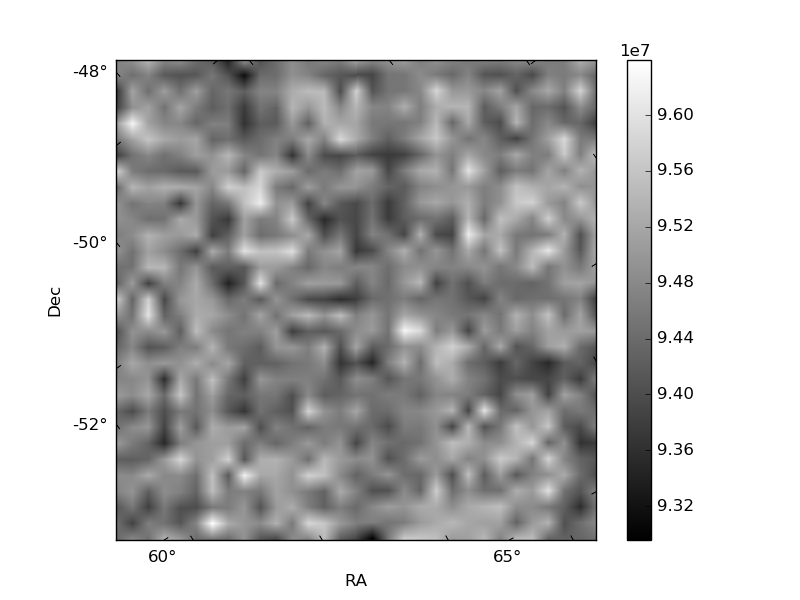
Histogram calculated using DETX and DETY for each event in the final _common_clean file
| Quadrant A | 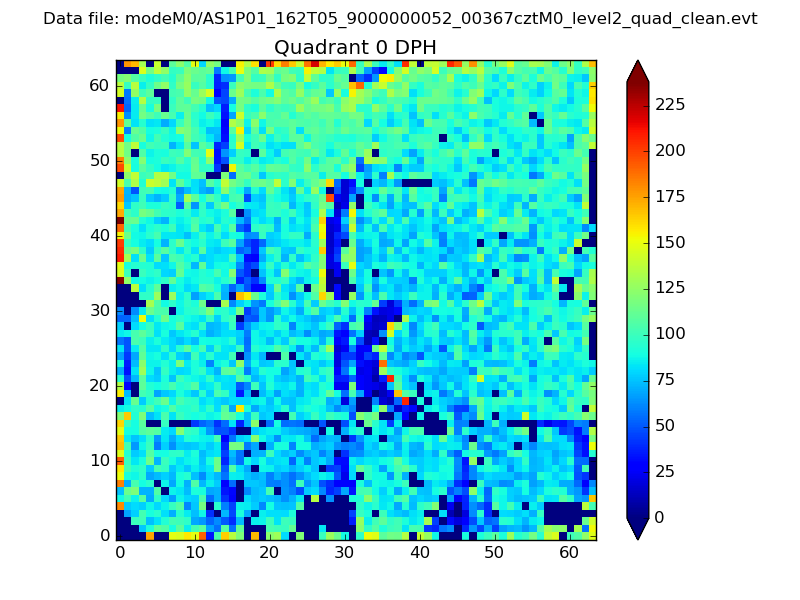 |
 |
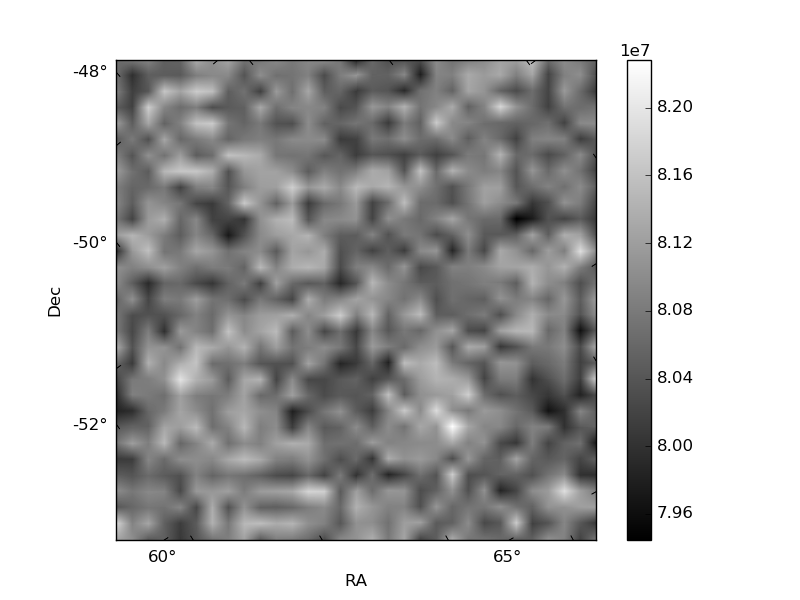
Quadrant B |
|---|---|---|---|
| Quadrant D | 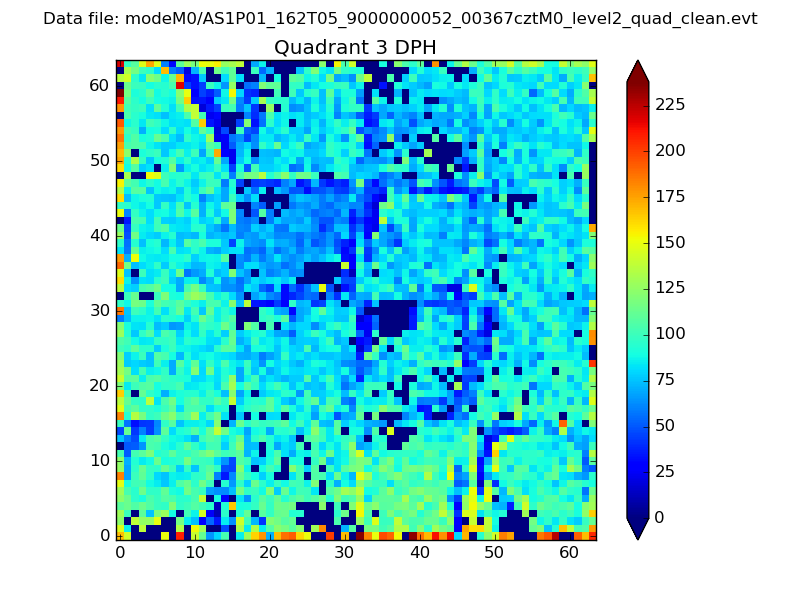 |
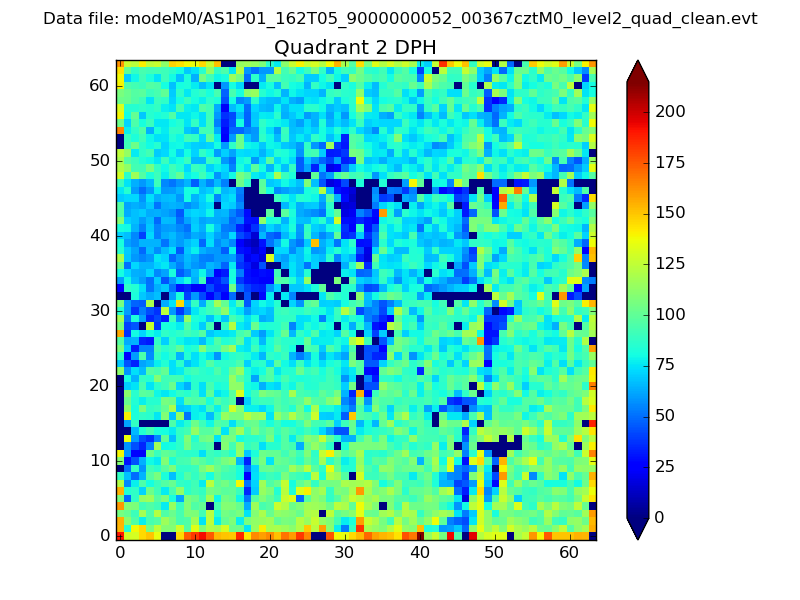 |
Quadrant C |
| Plot type | Count rate plots | Images |
|---|---|---|
| Comparison with Poisson distribution Blue bars denote a histogram of data divided into 1 sec bins. Red curve is a Poisson curve with rate = median count rate of data. |
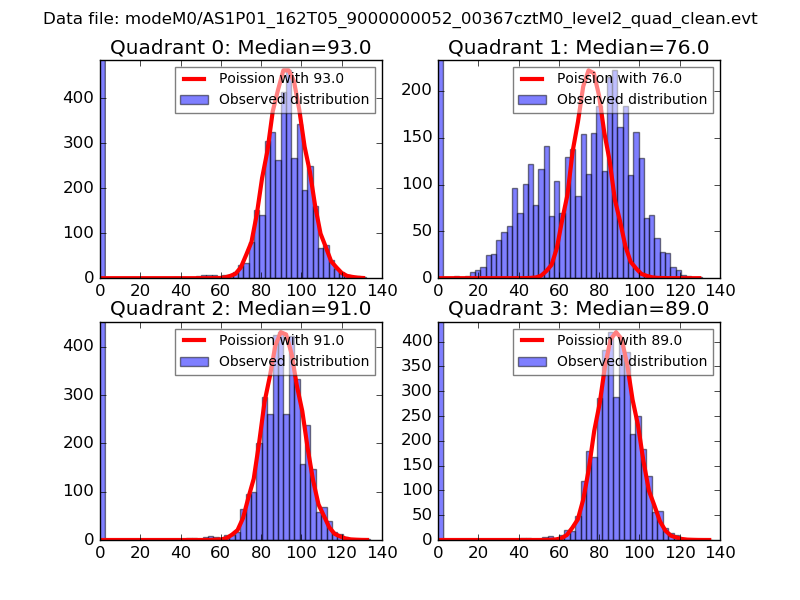 |
 |
| Quadrant-wise count rates Data is divided into 100 sec bins |
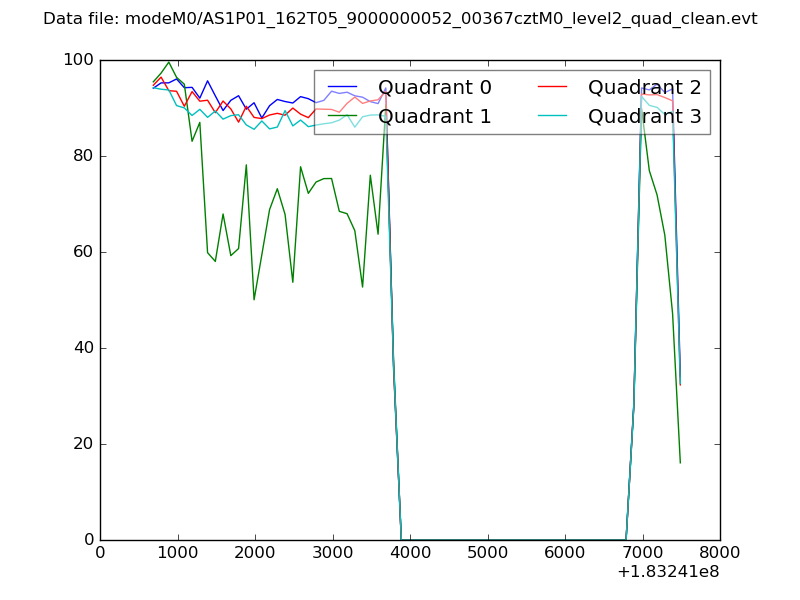 |
|
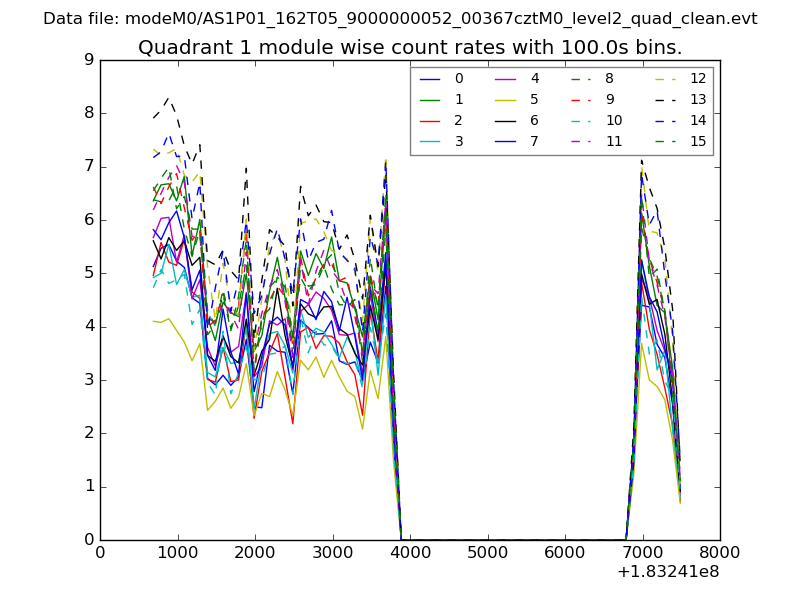
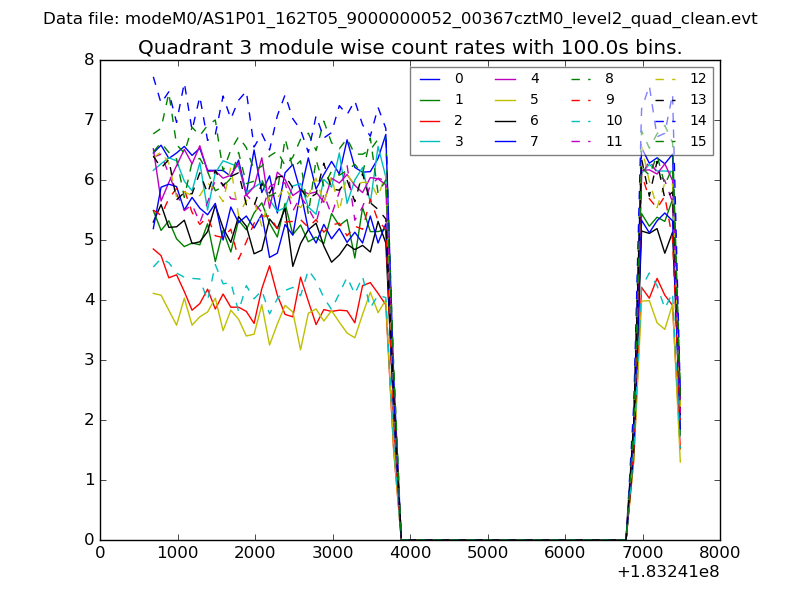
| Module-wise count rates for Quadrant A Data is divided into 100 sec bins |
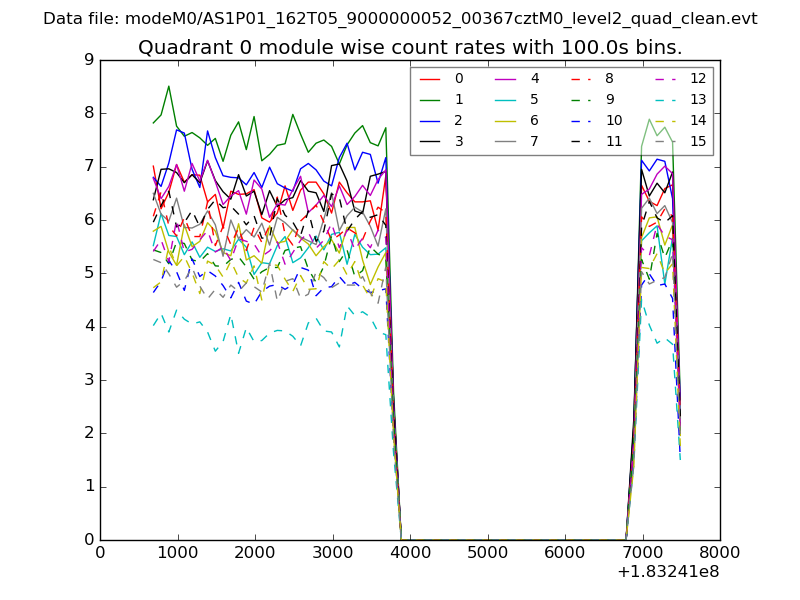 |
 |
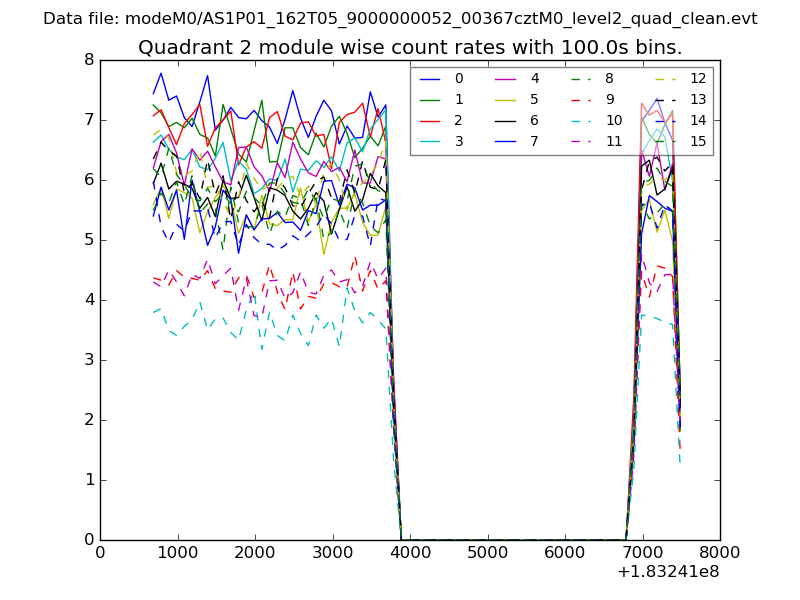
| Module-wise count rates for Quadrant B Data is divided into 100 sec bins |
 |
 |
| Module-wise count rates for Quadrant C Data is divided into 100 sec bins |
 |
 |
| Module-wise count rates for Quadrant D Data is divided into 100 sec bins |
 |
 |
| Parameter | Plot |
|---|---|
| CZT HV Monitor | 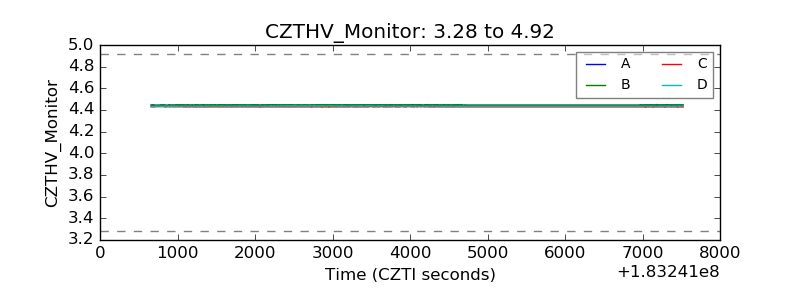 |
| D_VDD | 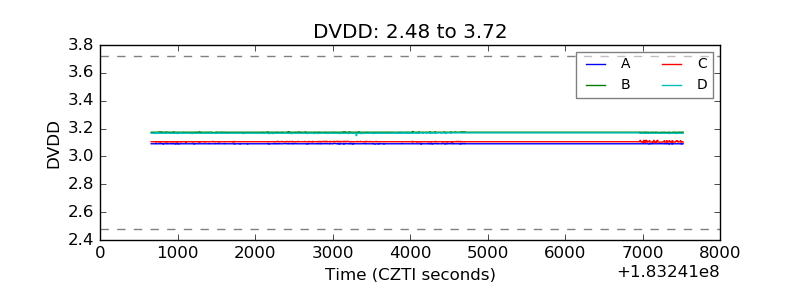 |
| Temperature 1 | 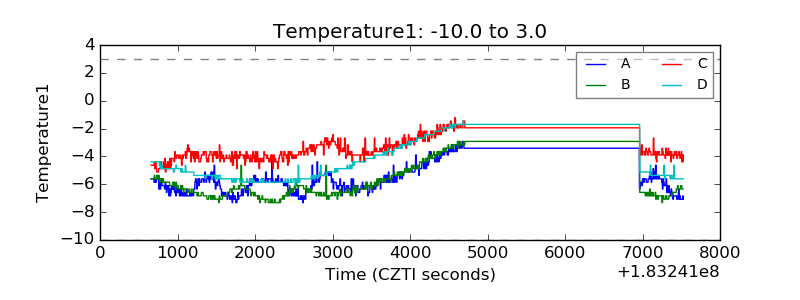 |
| Veto HV Monitor | 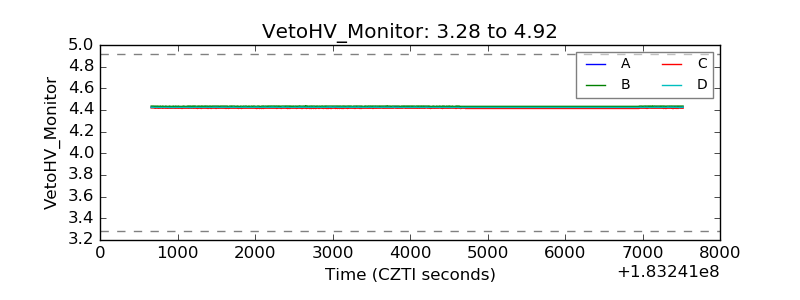 |
| Veto LLD |  |
| Alpha Counter | 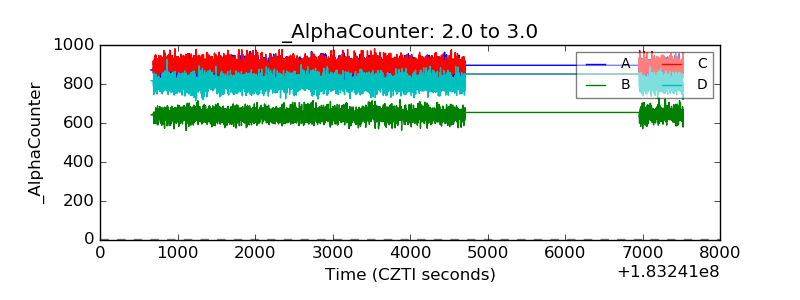 |
| _CPM_Rate | 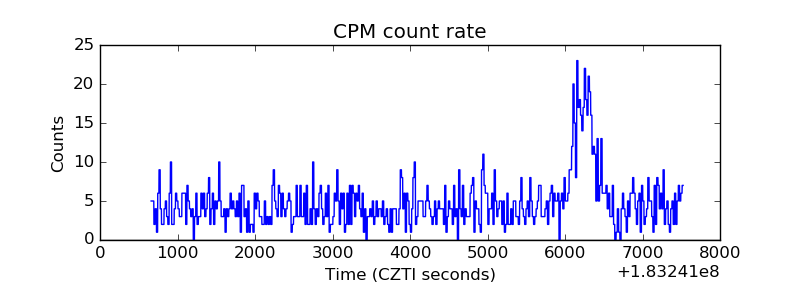 |
| CZT Counter | 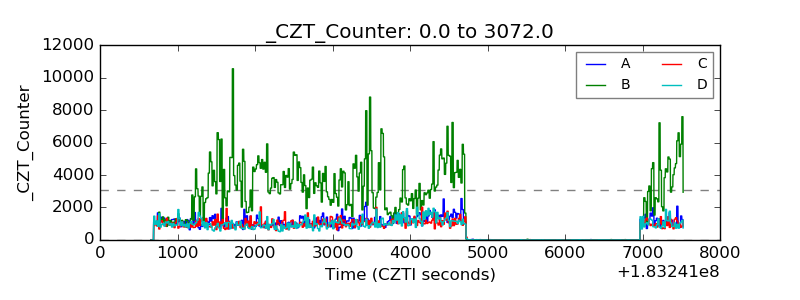 |
| +2.5 Volts monitor |  |
| +5 Volts monitor |  |
| _ROLL_ROT | 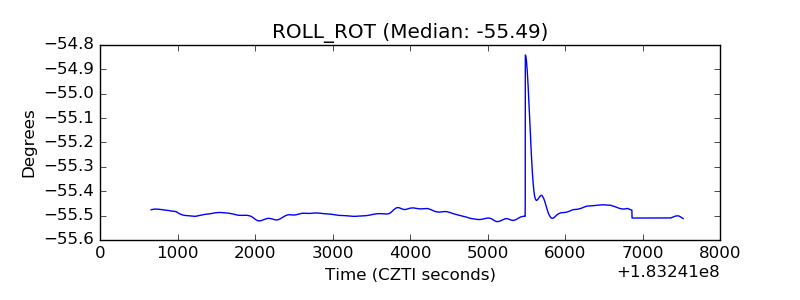 |
| _Roll_DEC | 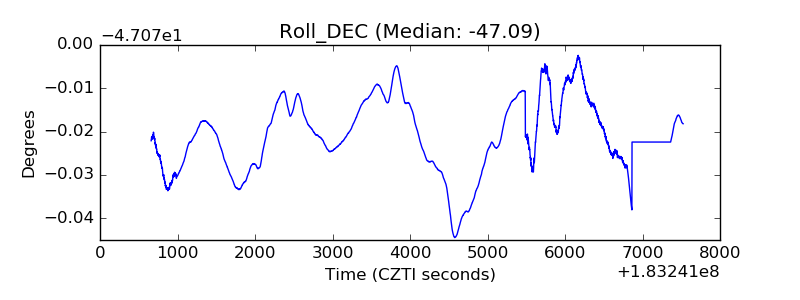 |
| _Roll_RA | 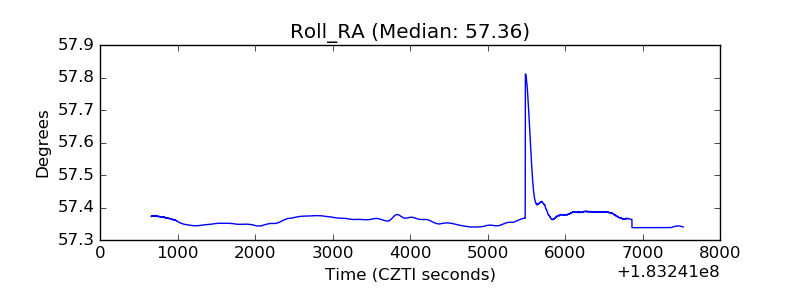 |
| Veto Counter | 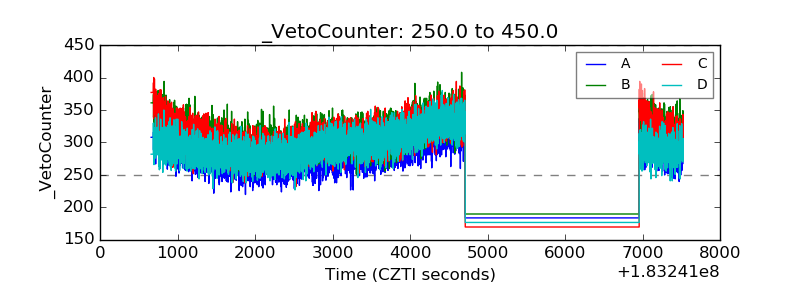 |