| Param | Original file | Final file |
|---|---|---|
| Filename | modeM0/AS1P01_162T05_9000000052_00371cztM0_level2.evt | modeM0/AS1P01_162T05_9000000052_00371cztM0_level2_quad_clean.evt |
| Size (bytes) | 781,698,240 | 29,136,960 |
| Size | 745.5 MB | 27.8 MB |
| Events in quadrant A | 4,797,315 | 165,755 |
| Events in quadrant B | 9,715,544 | 121,629 |
| Events in quadrant C | 4,409,194 | 163,041 |
| Events in quadrant D | 4,498,617 | 161,397 |
| Mode SS | |||
|---|---|---|---|
| Quadrant | BADHDUFLAG | Total packets | Discarded packets |
| A | 0 | 156 | 78 |
| B | 0 | 156 | 78 |
| C | 0 | 156 | 78 |
| D | 0 | 156 | 78 |
| Mode M9 | |||
|---|---|---|---|
| Quadrant | BADHDUFLAG | Total packets | Discarded packets |
| A | 0 | 46 | 23 |
| B | 0 | 46 | 23 |
| C | 0 | 46 | 23 |
| D | 0 | 46 | 23 |
| Mode M0 | |||
|---|---|---|---|
| Quadrant | BADHDUFLAG | Total packets | Discarded packets |
| A | 0 | 33888 | 16945 |
| B | 0 | 63832 | 31917 |
| C | 0 | 31614 | 15808 |
| D | 0 | 32150 | 16076 |
| Quadrant | Total seconds | Saturated seconds | Saturation percentage |
|---|---|---|---|
| A | 3808 | 8 | 0.210084% |
| B | 3808 | 2292 | 60.189076% |
| C | 3808 | 6 | 0.157563% |
| D | 3808 | 12 | 0.315126% |
Noise dominated data is calculated using 1-second bins in cleaned event files. If a bin has >2000 counts, and if more than 50% of those come from <1% of pixels, then it is considered to be noise-dominated and hence unusable.
| Quadrant | # 1 sec bins | Bins with >0 counts | Bins with >2000 counts | High rate bins dominated by noise | Noise dominated (total time) | Noise dominated (detector-on time) | Marked lightcurve |
|---|---|---|---|---|---|---|---|
| A | 6053 | 3809 | 112 | 112 | 1.85% | 2.94% | 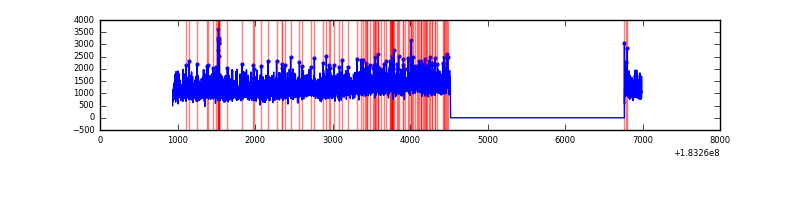 |
| B | 6053 | 3809 | 2722 | 2722 | 44.97% | 71.46% | 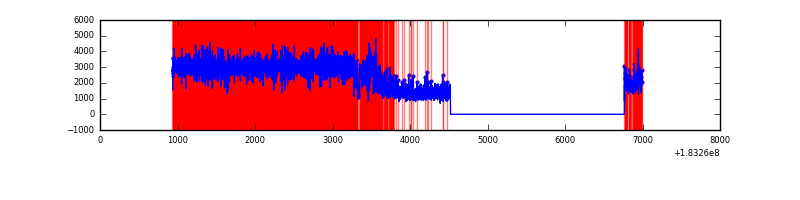 |
| C | 6053 | 3809 | 69 | 69 | 1.14% | 1.81% | 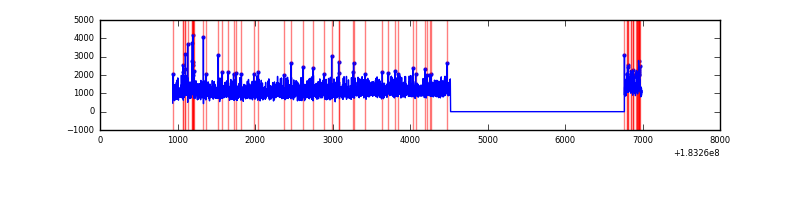 |
| D | 6053 | 3809 | 82 | 82 | 1.35% | 2.15% | 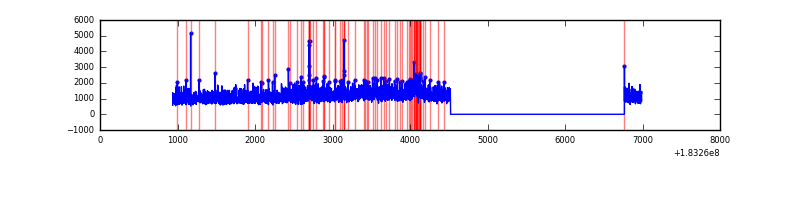 |
Top three noisy pixels from each quadrant. If the there are fewer than three noisy pixels in the level2.evt file, extra rows are filled as -1
| Pixel properties | Quadrant properties | ||||||
|---|---|---|---|---|---|---|---|
| Quadrant | DetID | PixID | Counts | Sigma | Mean | Median | Sigma |
| A | 0 | 238 | 99169 | 371.95 | 1169 | 1157 | 263.5 |
| A | 12 | 247 | 69070 | 257.73 | 1169 | 1157 | 263.5 |
| A | 15 | 127 | 46588 | 172.41 | 1169 | 1157 | 263.5 |
| B | 2 | 2 | 5883857 | 25498.69 | 971 | 977 | 230.7 |
| B | 4 | 251 | 36692 | 154.8 | 971 | 977 | 230.7 |
| B | 0 | 207 | 22376 | 92.75 | 971 | 977 | 230.7 |
| C | 1 | 1 | 73380 | 238.25 | 1084 | 1126 | 303.3 |
| C | 3 | 159 | 48428 | 155.97 | 1084 | 1126 | 303.3 |
| C | 9 | 68 | 20721 | 64.61 | 1084 | 1126 | 303.3 |
| D | 7 | 85 | 141430 | 418.68 | 1056 | 1098 | 335.2 |
| D | 1 | 5 | 113319 | 334.81 | 1056 | 1098 | 335.2 |
| D | 13 | 223 | 47786 | 139.29 | 1056 | 1098 | 335.2 |
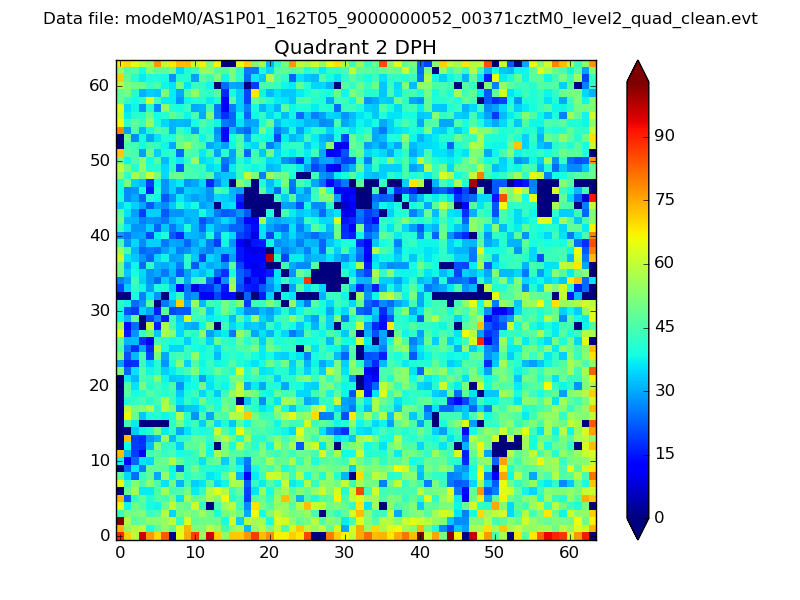
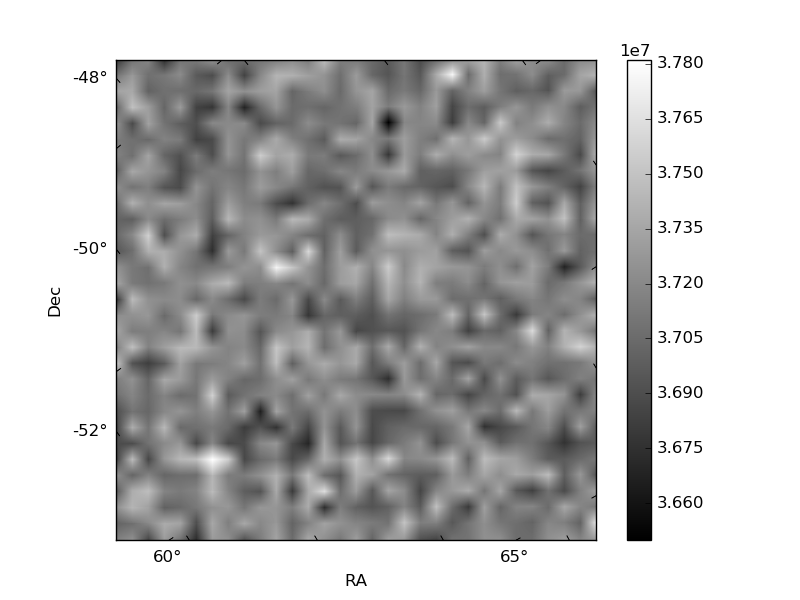
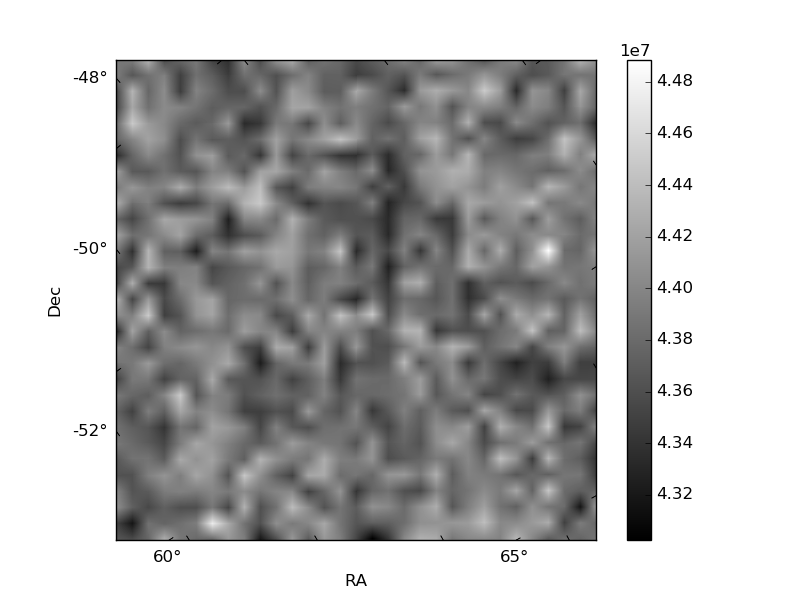
Histogram calculated using DETX and DETY for each event in the final _common_clean file
| Quadrant A | 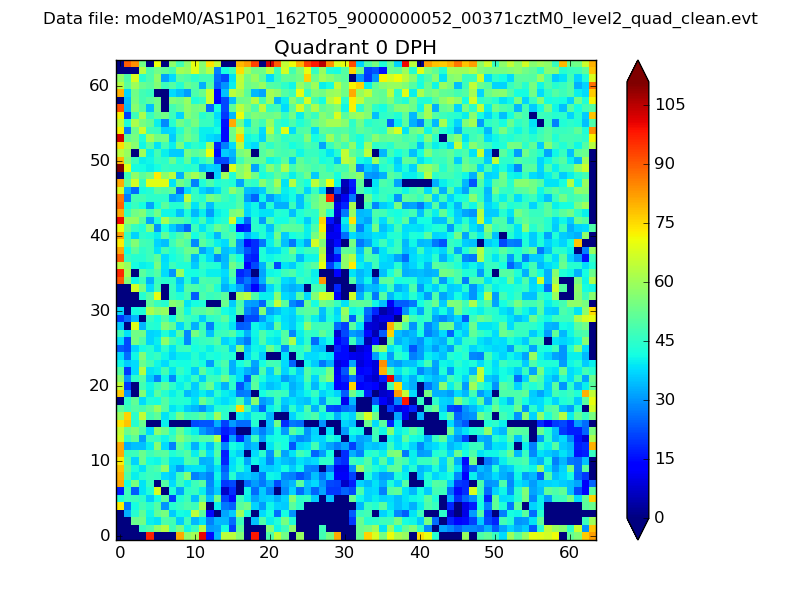 |
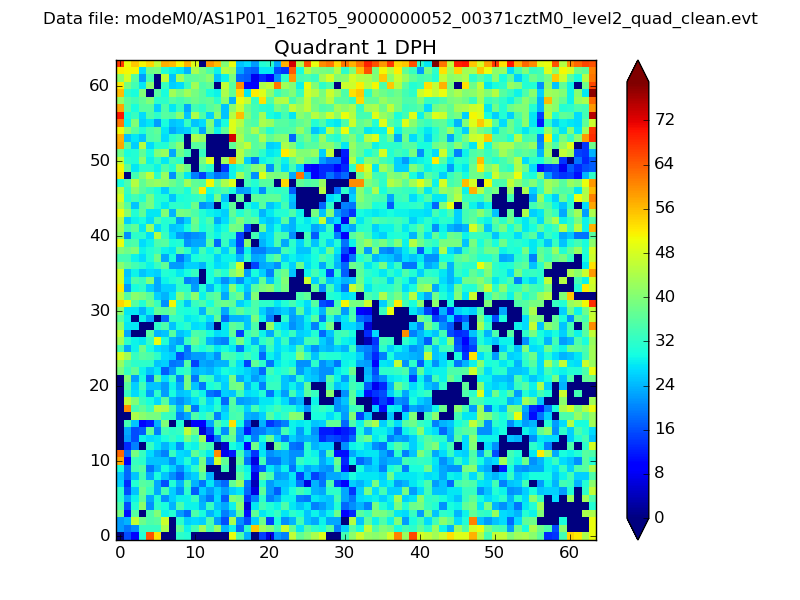 |
Quadrant B |
|---|---|---|---|
| Quadrant D | 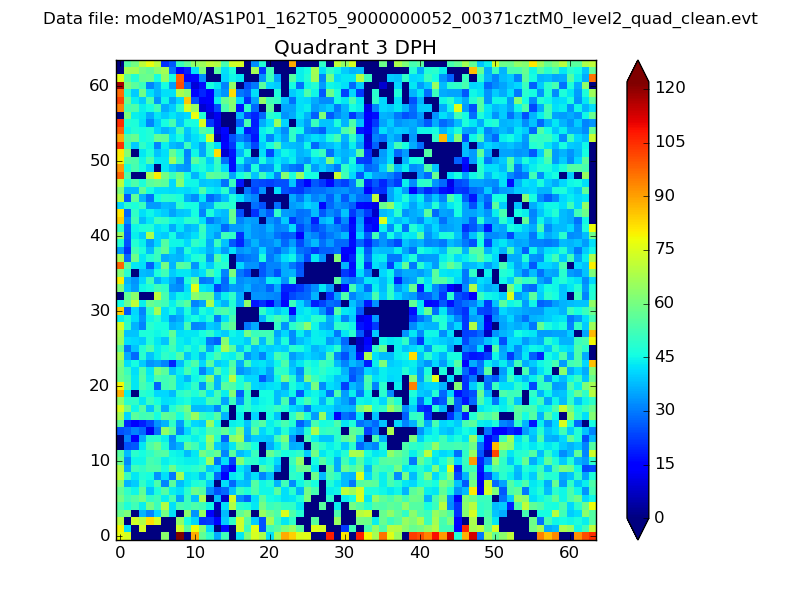 |
 |
Quadrant C |
| Plot type | Count rate plots | Images |
|---|---|---|
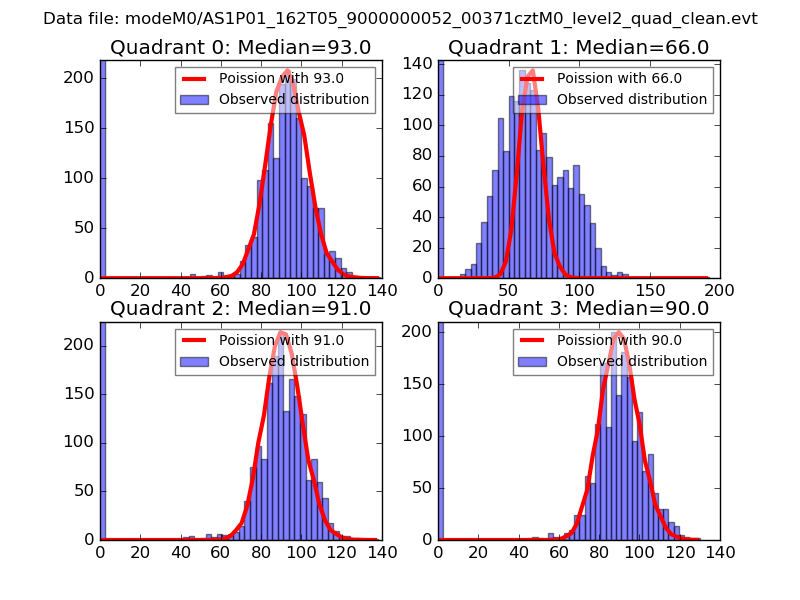
| Comparison with Poisson distribution Blue bars denote a histogram of data divided into 1 sec bins. Red curve is a Poisson curve with rate = median count rate of data. |
 |
 |
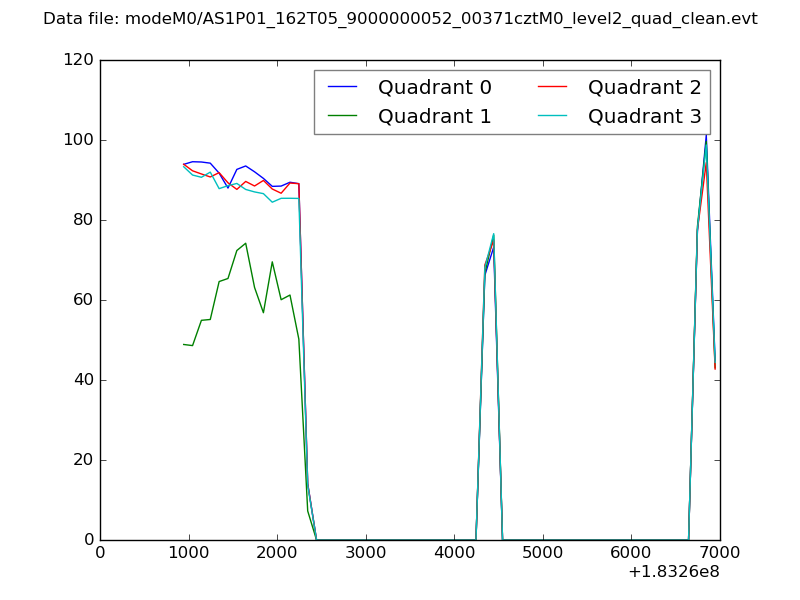
| Quadrant-wise count rates Data is divided into 100 sec bins |
 |
|
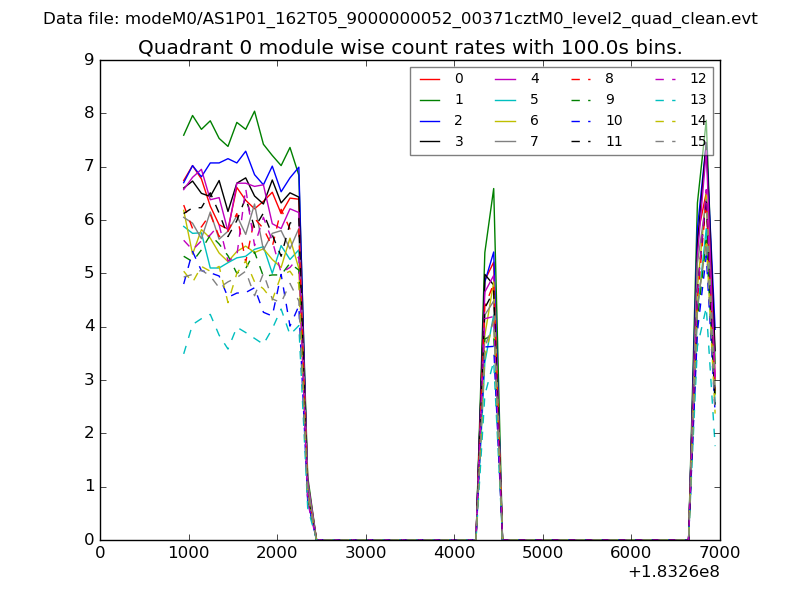
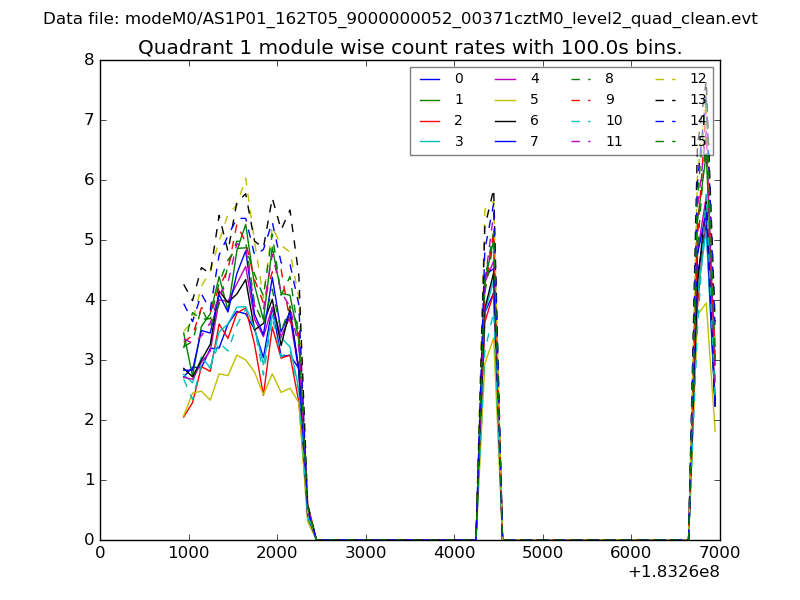
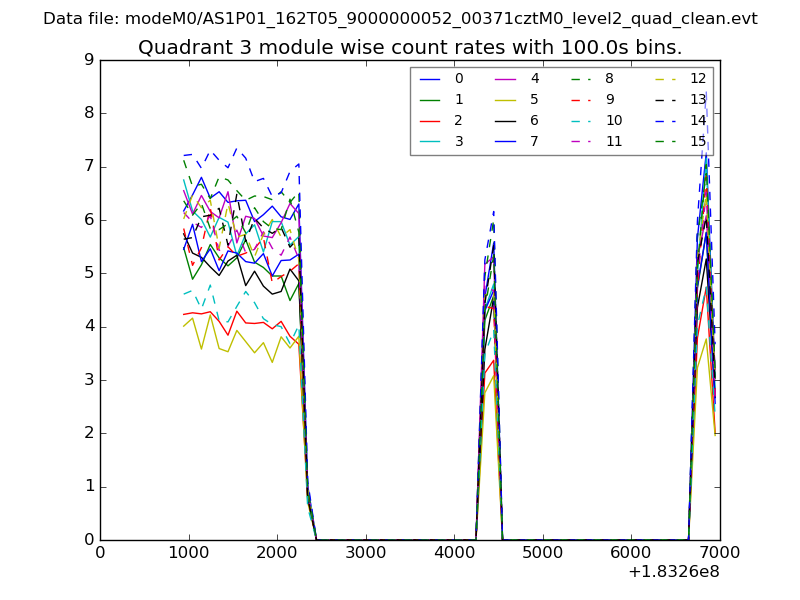
| Module-wise count rates for Quadrant A Data is divided into 100 sec bins |
 |
 |
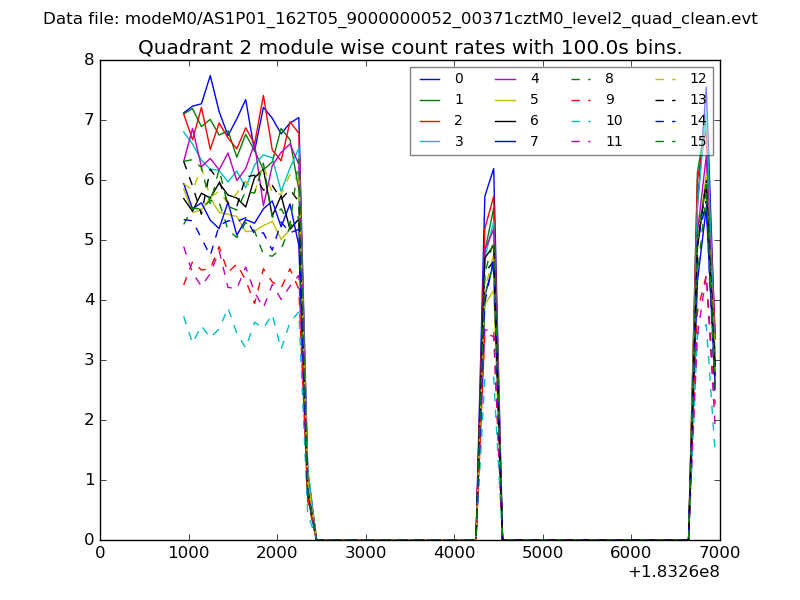
| Module-wise count rates for Quadrant B Data is divided into 100 sec bins |
 |
 |
| Module-wise count rates for Quadrant C Data is divided into 100 sec bins |
 |
 |
| Module-wise count rates for Quadrant D Data is divided into 100 sec bins |
 |
 |
| Parameter | Plot |
|---|---|
| CZT HV Monitor | 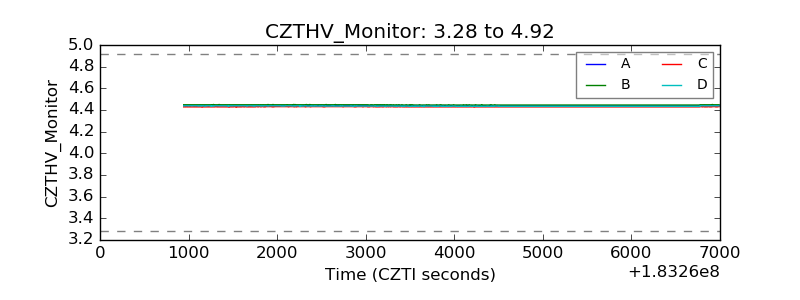 |
| D_VDD | 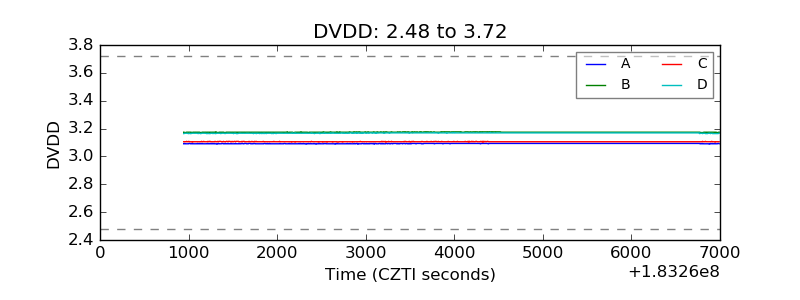 |
| Temperature 1 | 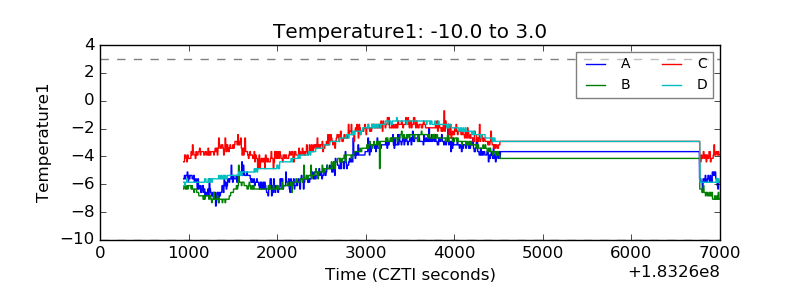 |
| Veto HV Monitor | 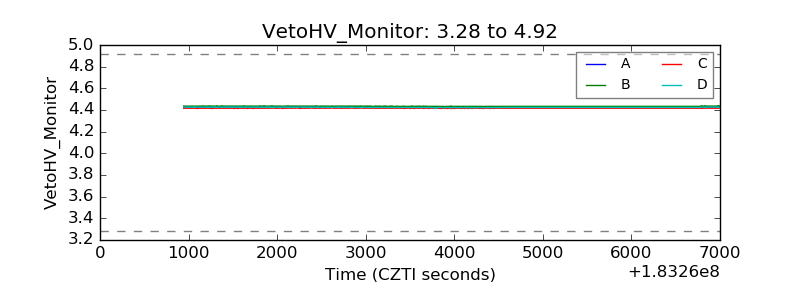 |
| Veto LLD |  |
| Alpha Counter | 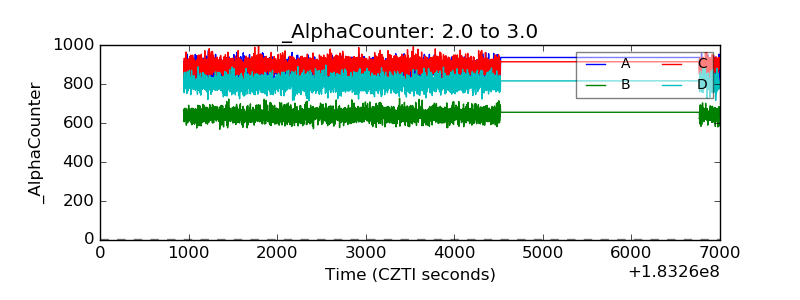 |
| _CPM_Rate | 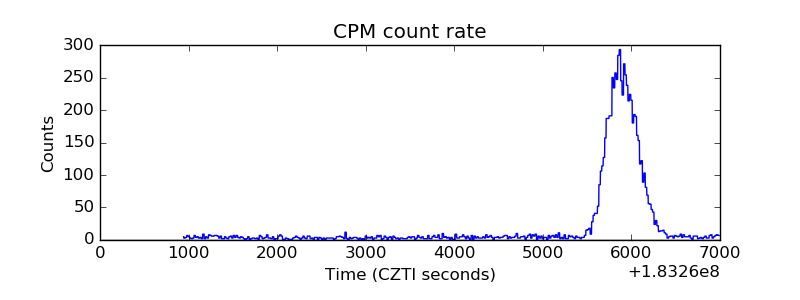 |
| CZT Counter | 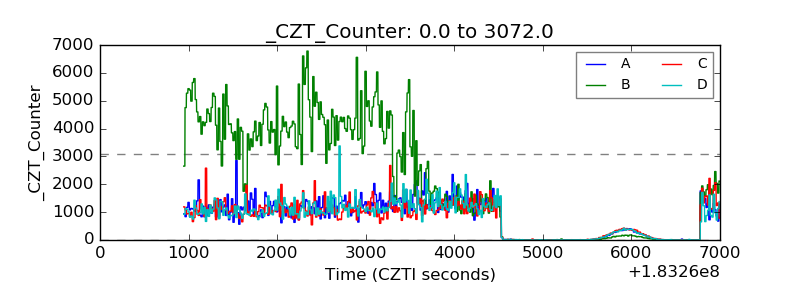 |
| +2.5 Volts monitor |  |
| +5 Volts monitor |  |
| _ROLL_ROT | 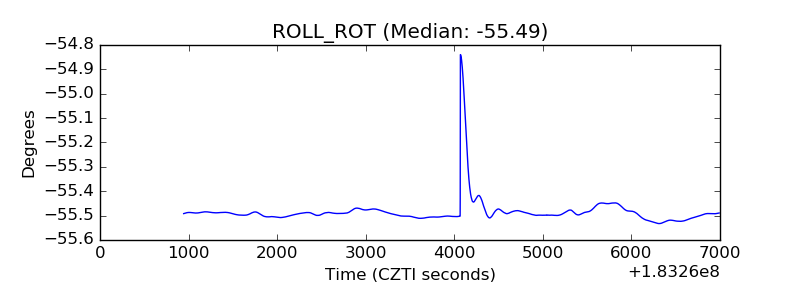 |
| _Roll_DEC | 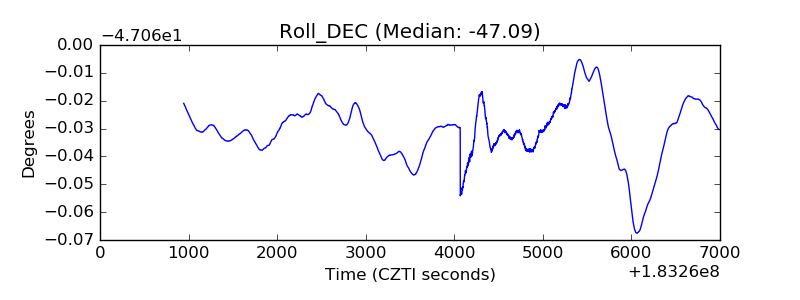 |
| _Roll_RA | 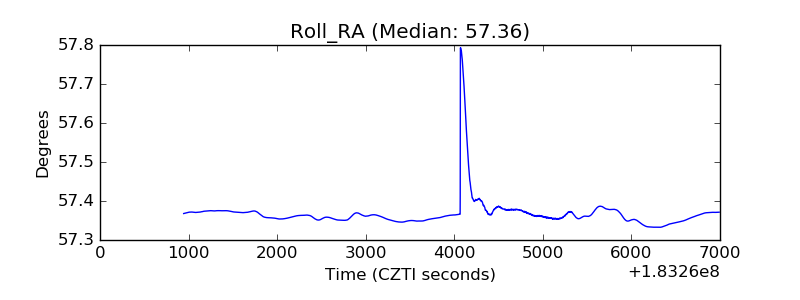 |
| Veto Counter | 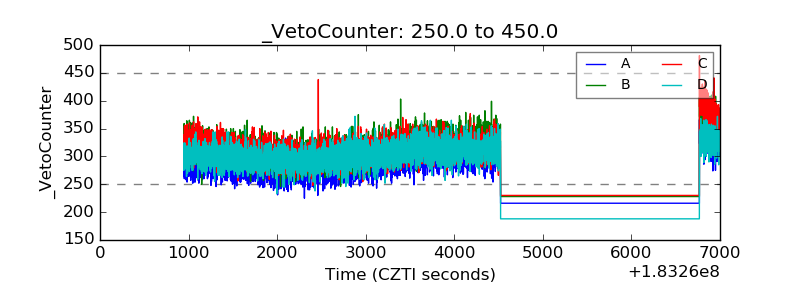 |