| Param | Original file | Final file |
|---|---|---|
| Filename | modeM0/AS1P01_161T03_9000000054cztM0_level2.fits | modeM0/AS1P01_161T03_9000000054cztM0_level2_quad_clean.evt |
| Size (bytes) | 60,664,320 | 66,827,520 |
| Size | 57.9 MB | 63.7 MB |
| Events in quadrant A | 346,094 | 389,714 |
| Events in quadrant B | 340,934 | 392,169 |
| Events in quadrant C | 343,590 | 380,808 |
| Events in quadrant D | 291,792 | 345,354 |
| Mode SS | |||
|---|---|---|---|
| Quadrant | BADHDUFLAG | Total packets | Discarded packets |
| A | 0 | 154 | 0 |
| B | 0 | 154 | 0 |
| C | 0 | 154 | 0 |
| D | 0 | 154 | 0 |
| Mode M0 | |||
|---|---|---|---|
| Quadrant | BADHDUFLAG | Total packets | Discarded packets |
| A | 0 | 35796 | 0 |
| B | 0 | 34745 | 0 |
| C | 0 | 29482 | 0 |
| D | 0 | 31566 | 0 |
| Mode M9 | |||
|---|---|---|---|
| Quadrant | BADHDUFLAG | Total packets | Discarded packets |
| A | 0 | 44 | 0 |
| B | 0 | 44 | 0 |
| C | 0 | 44 | 0 |
| D | 0 | 44 | 0 |
| Quadrant | Total seconds | Saturated seconds | Saturation percentage |
|---|---|---|---|
| A | 7393 | 69 | 0.933315% |
| B | 7393 | 189 | 2.556472% |
| C | 7393 | 5 | 0.067632% |
| D | 7393 | 13 | 0.175842% |
Noise dominated data is calculated using 1-second bins in cleaned event files. If a bin has >2000 counts, and if more than 50% of those come from <1% of pixels, then it is considered to be noise-dominated and hence unusable.
| Quadrant | # 1 sec bins | Bins with >0 counts | Bins with >2000 counts | High rate bins dominated by noise | Noise dominated (total time) | Noise dominated (detector-on time) | Marked lightcurve |
|---|---|---|---|---|---|---|---|
| A | 11882 | 7392 | 0 | 0 | 0.00% | 0.00% |  |
| B | 11882 | 7393 | 0 | 0 | 0.00% | 0.00% | 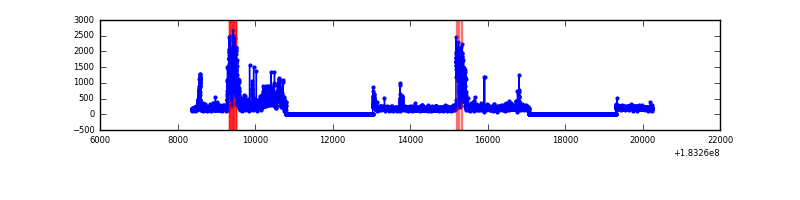 |
| C | 11882 | 7393 | 0 | 0 | 0.00% | 0.00% |  |
| D | 11882 | 7393 | 0 | 0 | 0.00% | 0.00% | 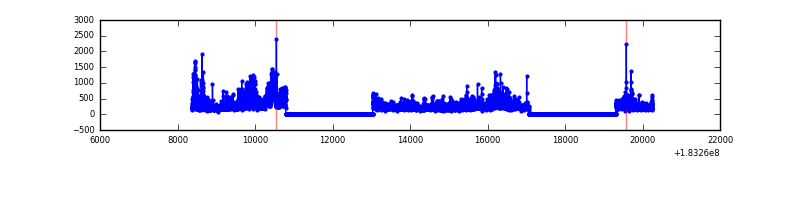 |
Top three noisy pixels from each quadrant. If the there are fewer than three noisy pixels in the level2.evt file, extra rows are filled as -1
| Pixel properties | Quadrant properties | ||||||
|---|---|---|---|---|---|---|---|
| Quadrant | DetID | PixID | Counts | Sigma | Mean | Median | Sigma |
| A | 0 | 29 | 365 | 12.04 | 90 | 85 | 23.2 |
| A | 7 | 110 | 336 | 10.8 | 90 | 85 | 23.2 |
| A | 0 | 30 | 289 | 8.78 | 90 | 85 | 23.2 |
| B | 2 | 9 | 291 | 10.95 | 90 | 86 | 18.7 |
| B | 2 | 8 | 228 | 7.58 | 90 | 86 | 18.7 |
| B | 14 | 254 | 227 | 7.53 | 90 | 86 | 18.7 |
| C | 12 | 241 | 267 | 7.59 | 90 | 84 | 24.1 |
| C | 1 | 81 | 239 | 6.43 | 90 | 84 | 24.1 |
| C | 2 | 191 | 227 | 5.93 | 90 | 84 | 24.1 |
| D | 6 | 114 | 231 | 7.14 | 83 | 76 | 21.7 |
| D | 11 | 82 | 225 | 6.86 | 83 | 76 | 21.7 |
| D | 3 | 14 | 218 | 6.54 | 83 | 76 | 21.7 |
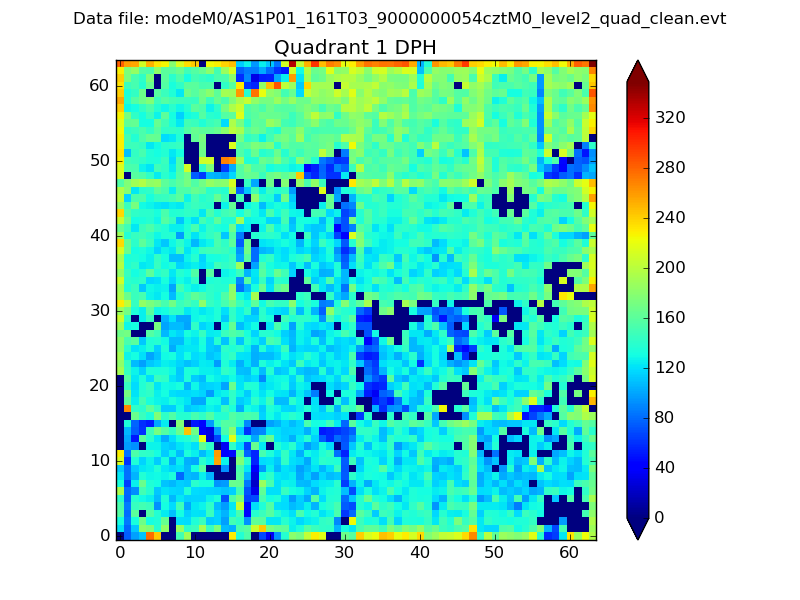
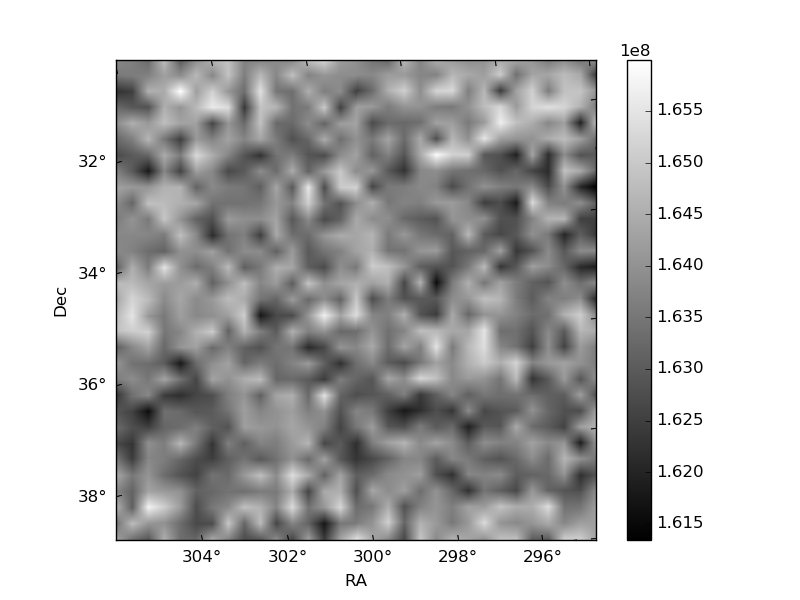
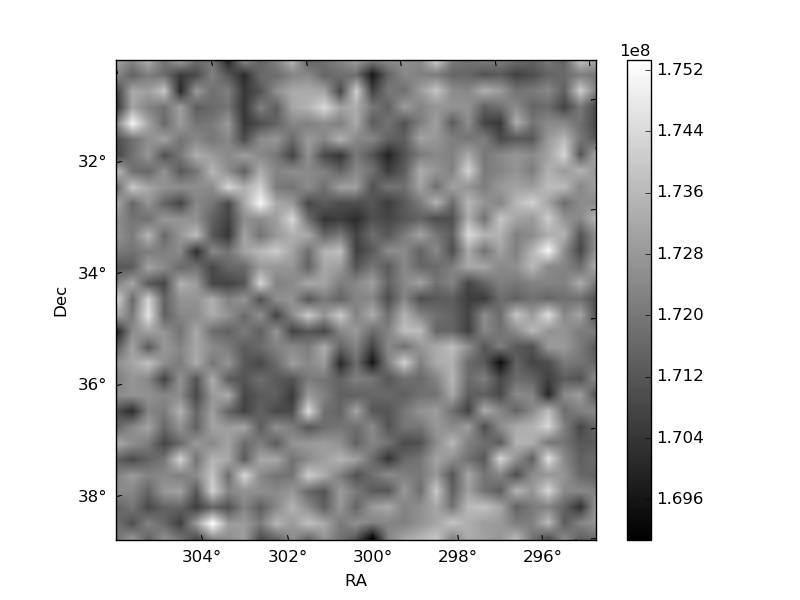
Histogram calculated using DETX and DETY for each event in the final _common_clean file
| Quadrant A |  |
 |
Quadrant B |
|---|---|---|---|
| Quadrant D |  |
 |
Quadrant C |
| Plot type | Count rate plots | Images |
|---|---|---|
| Comparison with Poisson distribution Blue bars denote a histogram of data divided into 1 sec bins. Red curve is a Poisson curve with rate = median count rate of data. |
 |
 |
| Quadrant-wise count rates Data is divided into 100 sec bins |
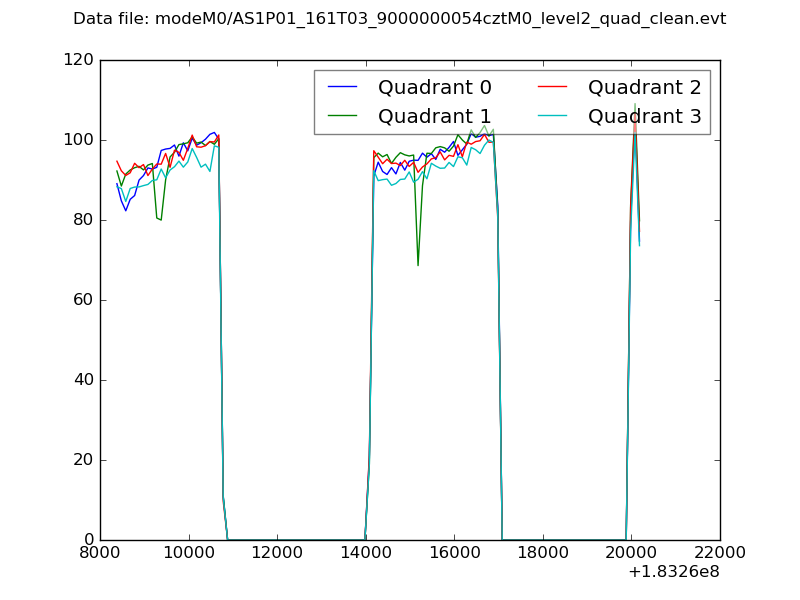 |
|
| Module-wise count rates for Quadrant A Data is divided into 100 sec bins |
 |
 |
| Module-wise count rates for Quadrant B Data is divided into 100 sec bins |
 |
 |
| Module-wise count rates for Quadrant C Data is divided into 100 sec bins |
 |
 |
| Module-wise count rates for Quadrant D Data is divided into 100 sec bins |
 |
 |
| Parameter | Plot |
|---|---|
| CZT HV Monitor |  |
| D_VDD | 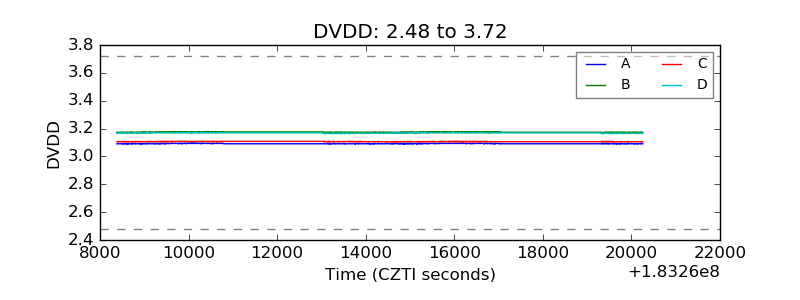 |
| Temperature 1 | 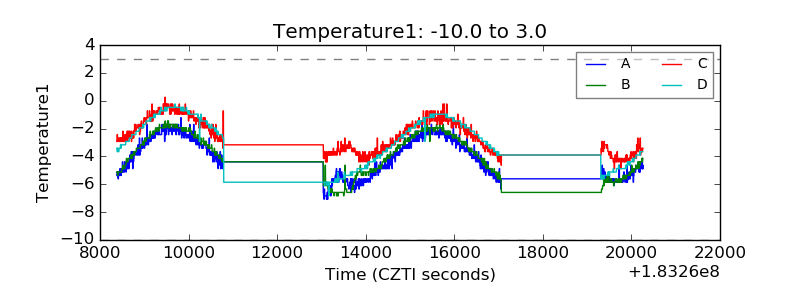 |
| Veto HV Monitor | 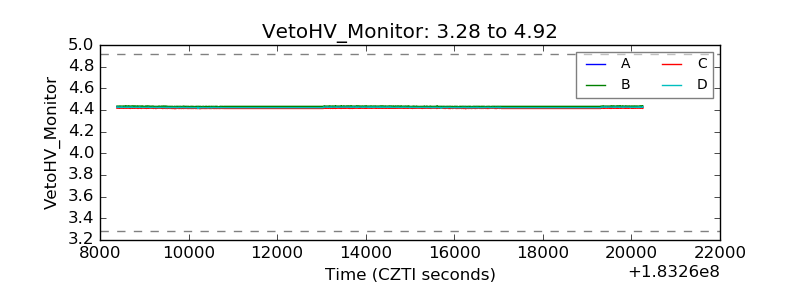 |
| Veto LLD | 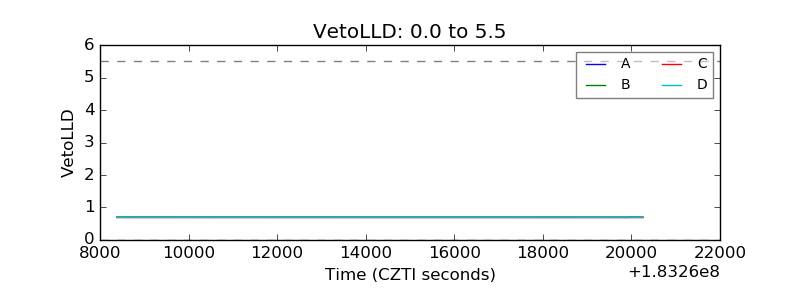 |
| Alpha Counter |  |
| _CPM_Rate |  |
| CZT Counter |  |
| +2.5 Volts monitor |  |
| +5 Volts monitor |  |
| _ROLL_ROT |  |
| _Roll_DEC |  |
| _Roll_RA |  |
| Veto Counter |  |