| Param | Original file | Final file |
|---|---|---|
| Filename | modeM0/AS1P01_161T05_9000000058cztM0_level2.fits | modeM0/AS1P01_161T05_9000000058cztM0_level2_quad_clean.evt |
| Size (bytes) | 258,174,720 | 239,276,160 |
| Size | 246.2 MB | 228.2 MB |
| Events in quadrant A | 1,449,780 | 1,304,026 |
| Events in quadrant B | 1,460,950 | 1,338,628 |
| Events in quadrant C | 1,436,692 | 1,270,857 |
| Events in quadrant D | 1,187,310 | 1,049,007 |
| Mode SS | |||
|---|---|---|---|
| Quadrant | BADHDUFLAG | Total packets | Discarded packets |
| A | 0 | 678 | 0 |
| B | 0 | 678 | 0 |
| C | 0 | 678 | 0 |
| D | 0 | 678 | 0 |
| Mode M9 | |||
|---|---|---|---|
| Quadrant | BADHDUFLAG | Total packets | Discarded packets |
| A | 0 | 176 | 0 |
| B | 0 | 176 | 0 |
| C | 0 | 176 | 0 |
| D | 0 | 176 | 0 |
| Mode M0 | |||
|---|---|---|---|
| Quadrant | BADHDUFLAG | Total packets | Discarded packets |
| A | 0 | 145525 | 0 |
| B | 0 | 139661 | 0 |
| C | 0 | 145474 | 0 |
| D | 0 | 159478 | 0 |
| Quadrant | Total seconds | Saturated seconds | Saturation percentage |
|---|---|---|---|
| A | 33228 | 452 | 1.360299% |
| B | 33228 | 45 | 0.135428% |
| C | 33228 | 380 | 1.143614% |
| D | 33228 | 2073 | 6.238714% |
Noise dominated data is calculated using 1-second bins in cleaned event files. If a bin has >2000 counts, and if more than 50% of those come from <1% of pixels, then it is considered to be noise-dominated and hence unusable.
| Quadrant | # 1 sec bins | Bins with >0 counts | Bins with >2000 counts | High rate bins dominated by noise | Noise dominated (total time) | Noise dominated (detector-on time) | Marked lightcurve |
|---|---|---|---|---|---|---|---|
| A | 50646 | 33225 | 0 | 0 | 0.00% | 0.00% |  |
| B | 50646 | 33227 | 0 | 0 | 0.00% | 0.00% |  |
| C | 50646 | 33225 | 0 | 0 | 0.00% | 0.00% |  |
| D | 50646 | 33215 | 0 | 0 | 0.00% | 0.00% |  |
Top three noisy pixels from each quadrant. If the there are fewer than three noisy pixels in the level2.evt file, extra rows are filled as -1
| Pixel properties | Quadrant properties | ||||||
|---|---|---|---|---|---|---|---|
| Quadrant | DetID | PixID | Counts | Sigma | Mean | Median | Sigma |
| A | 7 | 110 | 1358 | 11.01 | 377 | 352 | 91.4 |
| A | 0 | 29 | 1326 | 10.66 | 377 | 352 | 91.4 |
| A | 0 | 30 | 1055 | 7.69 | 377 | 352 | 91.4 |
| B | 2 | 9 | 1221 | 12.15 | 386 | 366 | 70.4 |
| B | 14 | 254 | 1008 | 9.12 | 386 | 366 | 70.4 |
| B | 2 | 18 | 961 | 8.45 | 386 | 366 | 70.4 |
| C | 3 | 203 | 1180 | 8.67 | 379 | 350 | 95.7 |
| C | 3 | 202 | 1052 | 7.34 | 379 | 350 | 95.7 |
| C | 12 | 241 | 1033 | 7.14 | 379 | 350 | 95.7 |
| D | 6 | 44 | 903 | 7.02 | 340 | 311 | 84.4 |
| D | 6 | 114 | 894 | 6.91 | 340 | 311 | 84.4 |
| D | 11 | 82 | 887 | 6.83 | 340 | 311 | 84.4 |
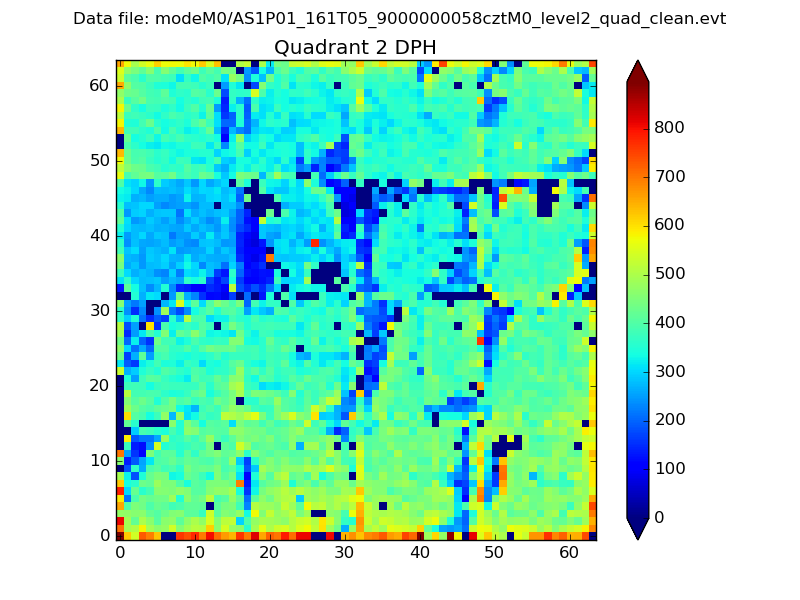
Histogram calculated using DETX and DETY for each event in the final _common_clean file
| Quadrant A |  |
 |
Quadrant B |
|---|---|---|---|
| Quadrant D | 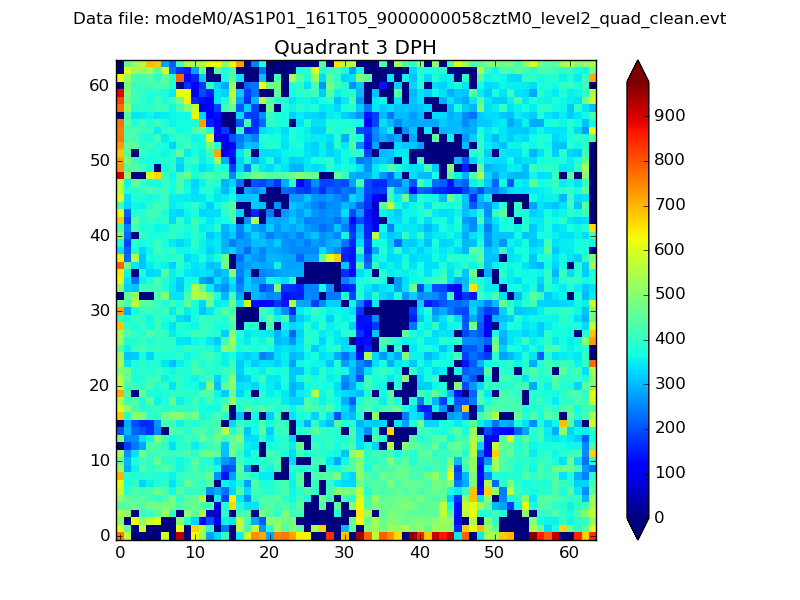 |
 |
Quadrant C |
| Plot type | Count rate plots | Images |
|---|---|---|
| Comparison with Poisson distribution Blue bars denote a histogram of data divided into 1 sec bins. Red curve is a Poisson curve with rate = median count rate of data. |
 |
 |
| Quadrant-wise count rates Data is divided into 100 sec bins |
 |
|
| Module-wise count rates for Quadrant A Data is divided into 100 sec bins |
 |
 |
| Module-wise count rates for Quadrant B Data is divided into 100 sec bins |
 |
 |
| Module-wise count rates for Quadrant C Data is divided into 100 sec bins |
 |
 |
| Module-wise count rates for Quadrant D Data is divided into 100 sec bins |
 |
 |
| Parameter | Plot |
|---|---|
| CZT HV Monitor |  |
| D_VDD |  |
| Temperature 1 |  |
| Veto HV Monitor |  |
| Veto LLD |  |
| Alpha Counter |  |
| _CPM_Rate |  |
| CZT Counter |  |
| +2.5 Volts monitor |  |
| +5 Volts monitor |  |
| _ROLL_ROT |  |
| _Roll_DEC |  |
| _Roll_RA |  |
| Veto Counter |  |