| Param | Original file | Final file |
|---|---|---|
| Filename | modeM0/AS1P01_161T05_9000000058_00377cztM0_level2.evt | modeM0/AS1P01_161T05_9000000058_00377cztM0_level2_quad_clean.evt |
| Size (bytes) | 37,506,240 | 3,214,080 |
| Size | 35.8 MB | 3.1 MB |
| Events in quadrant A | 292,539 | 20,090 |
| Events in quadrant B | 249,930 | 19,104 |
| Events in quadrant C | 280,441 | 19,427 |
| Events in quadrant D | 295,053 | 14,811 |
| Mode SS | |||
|---|---|---|---|
| Quadrant | BADHDUFLAG | Total packets | Discarded packets |
| A | 0 | 4 | 0 |
| B | 0 | 4 | 0 |
| C | 0 | 4 | 0 |
| D | 0 | 4 | 0 |
| Mode M0 | |||
|---|---|---|---|
| Quadrant | BADHDUFLAG | Total packets | Discarded packets |
| A | 0 | 1018 | 1 |
| B | 0 | 905 | 0 |
| C | 0 | 986 | 0 |
| D | 0 | 1028 | 0 |
| Quadrant | Total seconds | Saturated seconds | Saturation percentage |
|---|---|---|---|
| A | 215 | 1 | 0.465116% |
| B | 215 | 0 | 0.000000% |
| C | 215 | 2 | 0.930233% |
| D | 215 | 11 | 5.116279% |
Noise dominated data is calculated using 1-second bins in cleaned event files. If a bin has >2000 counts, and if more than 50% of those come from <1% of pixels, then it is considered to be noise-dominated and hence unusable.
| Quadrant | # 1 sec bins | Bins with >0 counts | Bins with >2000 counts | High rate bins dominated by noise | Noise dominated (total time) | Noise dominated (detector-on time) | Marked lightcurve |
|---|---|---|---|---|---|---|---|
| A | 215 | 215 | 16 | 16 | 7.44% | 7.44% |  |
| B | 215 | 215 | 3 | 3 | 1.40% | 1.40% |  |
| C | 215 | 215 | 12 | 12 | 5.58% | 5.58% | 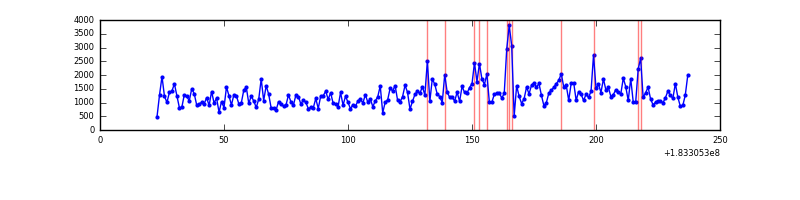 |
| D | 215 | 215 | 18 | 18 | 8.37% | 8.37% |  |
Top three noisy pixels from each quadrant. If the there are fewer than three noisy pixels in the level2.evt file, extra rows are filled as -1
| Pixel properties | Quadrant properties | ||||||
|---|---|---|---|---|---|---|---|
| Quadrant | DetID | PixID | Counts | Sigma | Mean | Median | Sigma |
| A | 0 | 69 | 32919 | 2053.35 | 64 | 63 | 16.0 |
| A | 15 | 127 | 6112 | 378.04 | 64 | 63 | 16.0 |
| A | 0 | 238 | 2888 | 176.55 | 64 | 63 | 16.0 |
| B | 0 | 230 | 3755 | 221.61 | 63 | 63 | 16.7 |
| B | 0 | 183 | 1714 | 99.1 | 63 | 63 | 16.7 |
| B | 4 | 82 | 1209 | 68.79 | 63 | 63 | 16.7 |
| C | 5 | 234 | 28727 | 1623.9 | 58 | 60 | 17.7 |
| C | 10 | 107 | 19906 | 1124.22 | 58 | 60 | 17.7 |
| C | 1 | 1 | 1348 | 72.96 | 58 | 60 | 17.7 |
| D | 1 | 5 | 17561 | 788.81 | 61 | 60 | 22.2 |
| D | 1 | 4 | 10975 | 491.96 | 61 | 60 | 22.2 |
| D | 13 | 117 | 8823 | 394.97 | 61 | 60 | 22.2 |
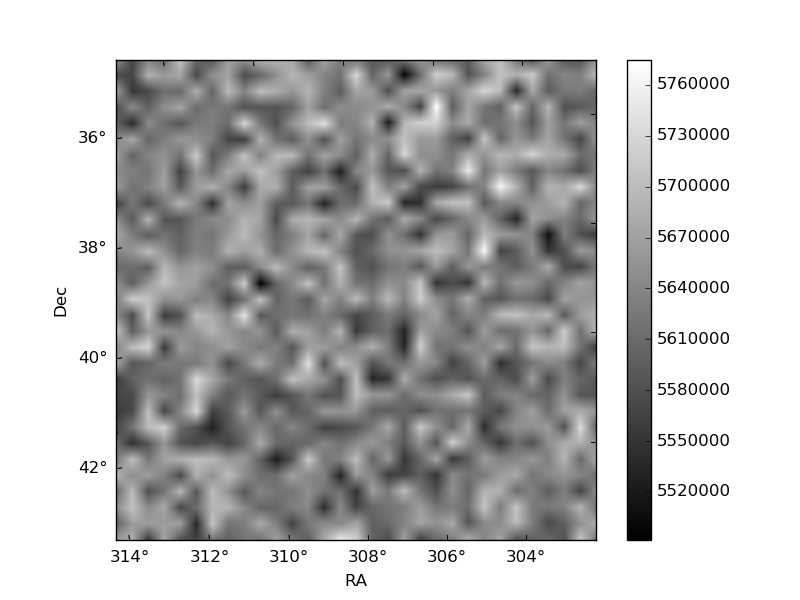
Histogram calculated using DETX and DETY for each event in the final _common_clean file
| Quadrant A | 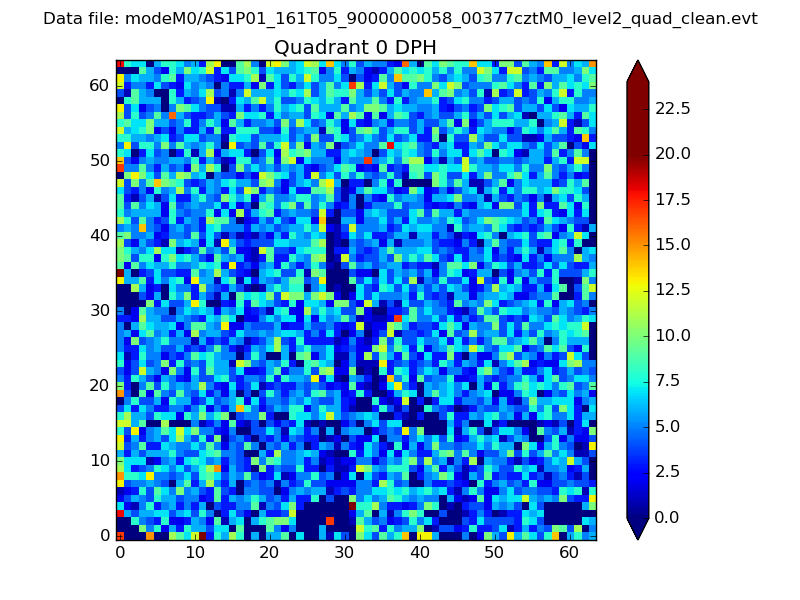 |
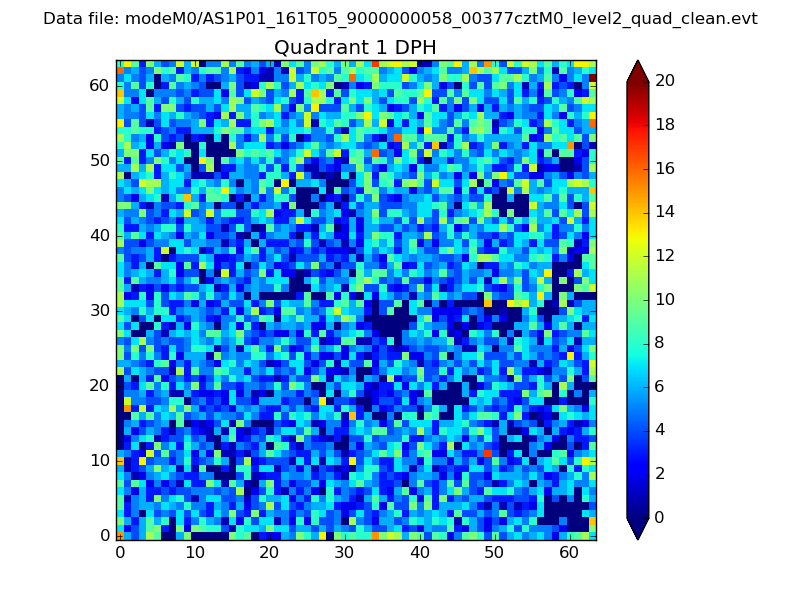 |
Quadrant B |
|---|---|---|---|
| Quadrant D | 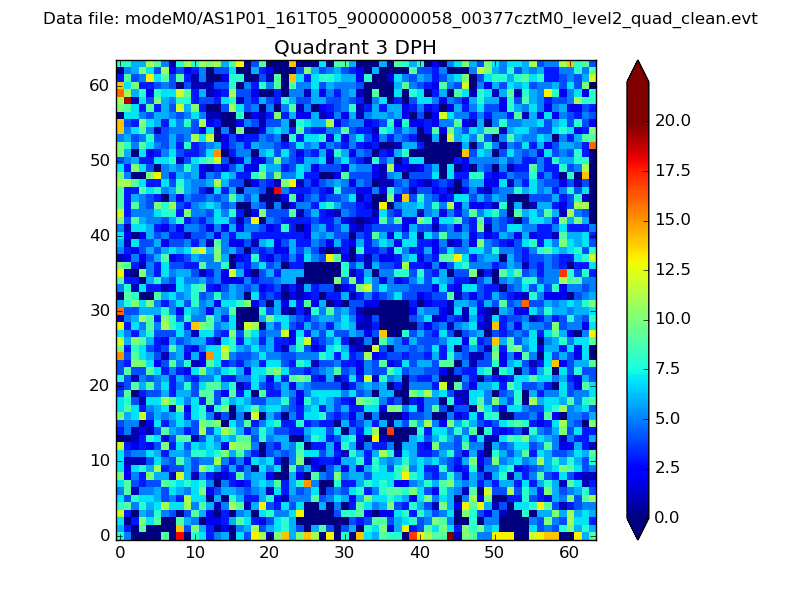 |
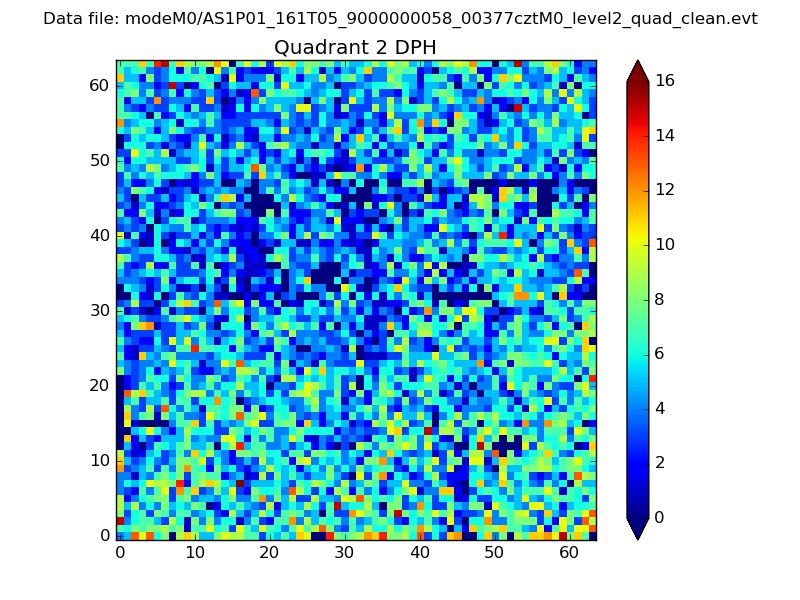 |
Quadrant C |
| Plot type | Count rate plots | Images |
|---|---|---|
| Comparison with Poisson distribution Blue bars denote a histogram of data divided into 1 sec bins. Red curve is a Poisson curve with rate = median count rate of data. |
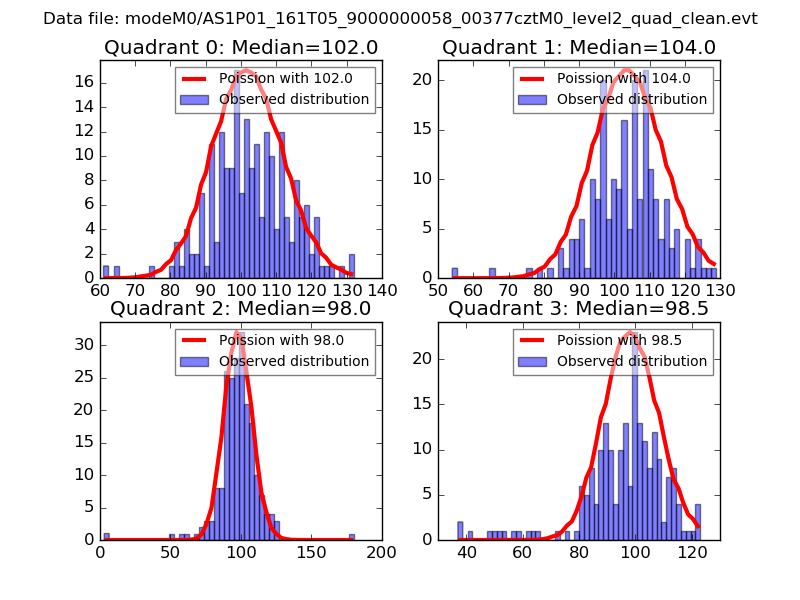 |
 |
| Quadrant-wise count rates Data is divided into 100 sec bins |
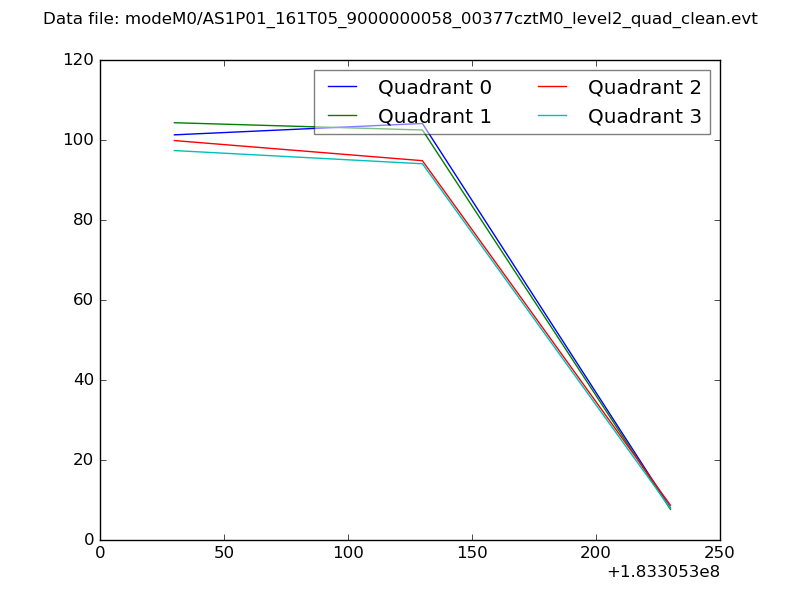 |
|
| Module-wise count rates for Quadrant A Data is divided into 100 sec bins |
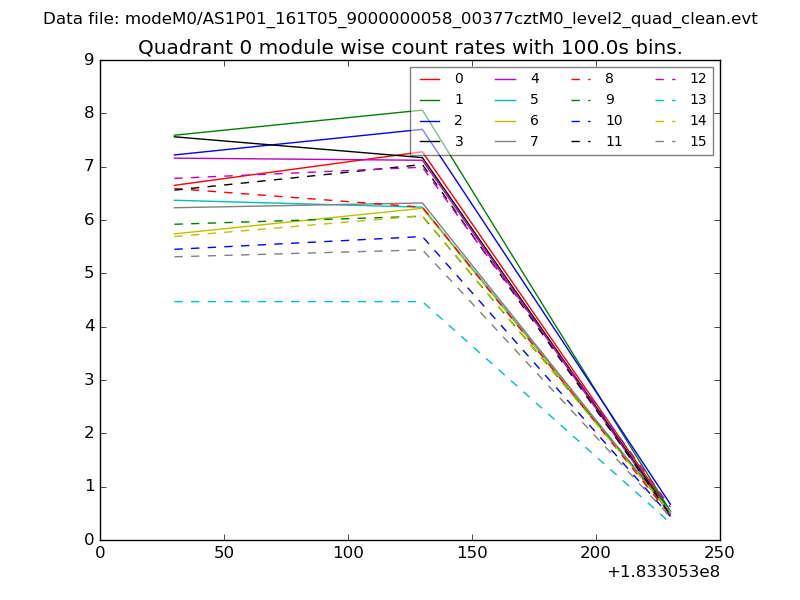 |
 |
| Module-wise count rates for Quadrant B Data is divided into 100 sec bins |
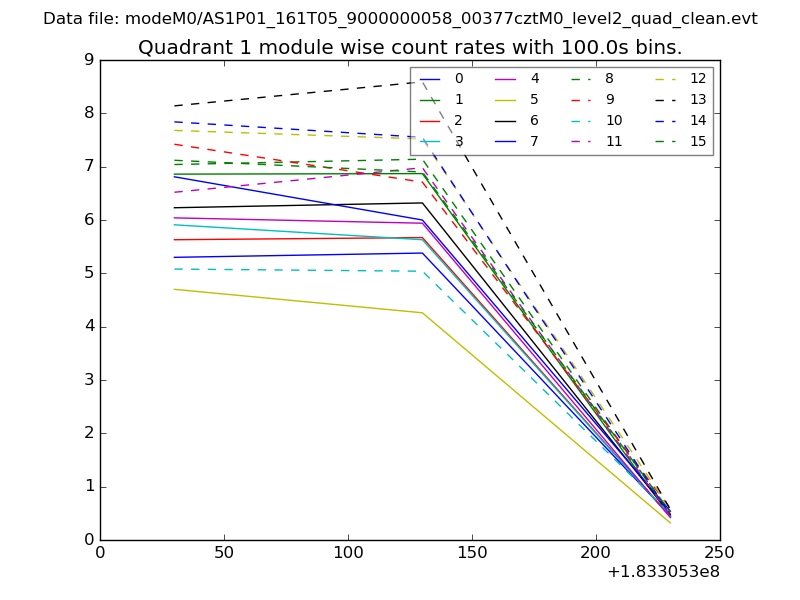 |
 |
| Module-wise count rates for Quadrant C Data is divided into 100 sec bins |
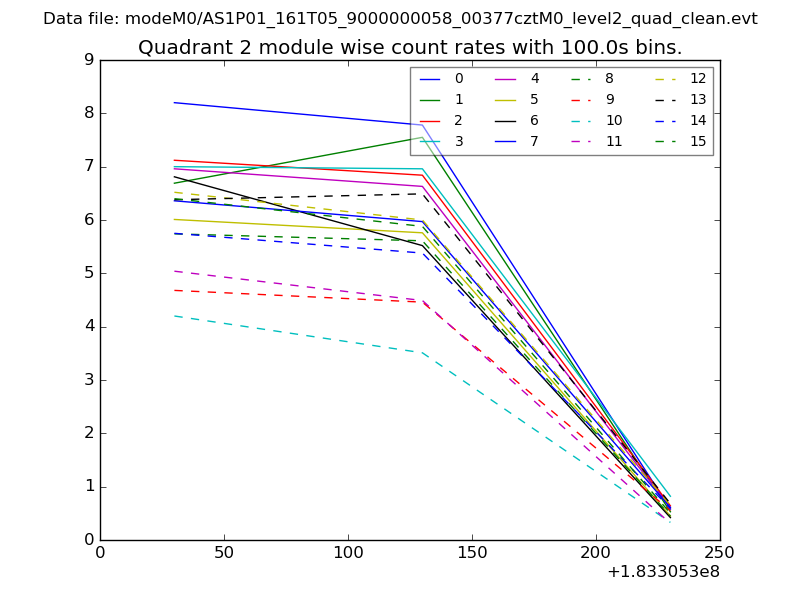 |
 |
| Module-wise count rates for Quadrant D Data is divided into 100 sec bins |
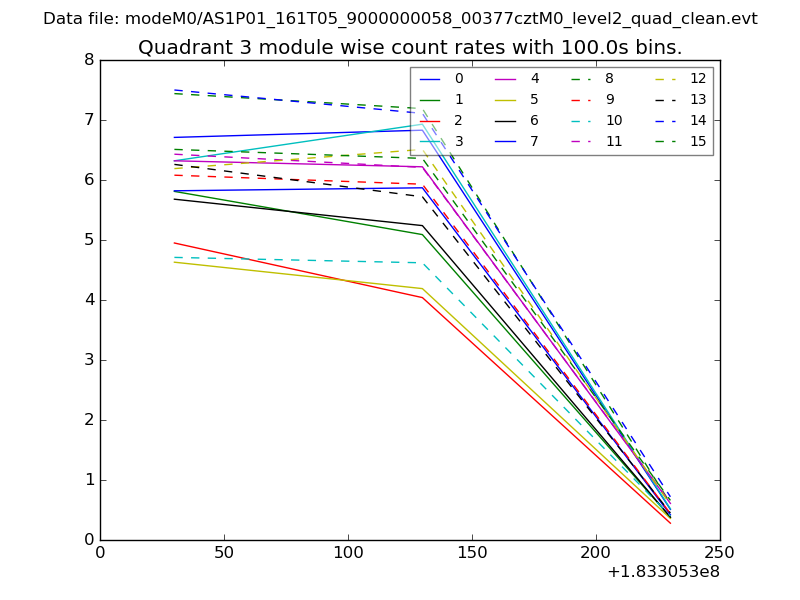 |
 |
| Parameter | Plot |
|---|---|
| CZT HV Monitor | 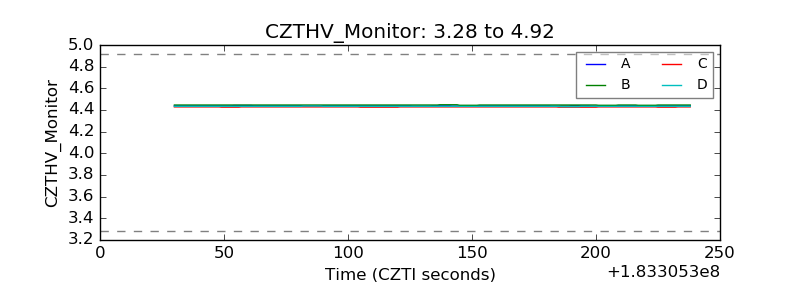 |
| D_VDD | 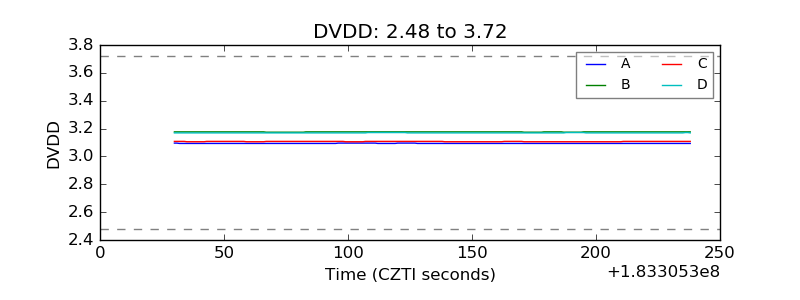 |
| Temperature 1 | 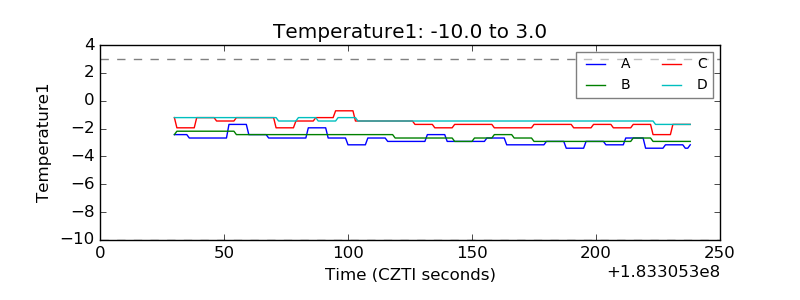 |
| Veto HV Monitor | 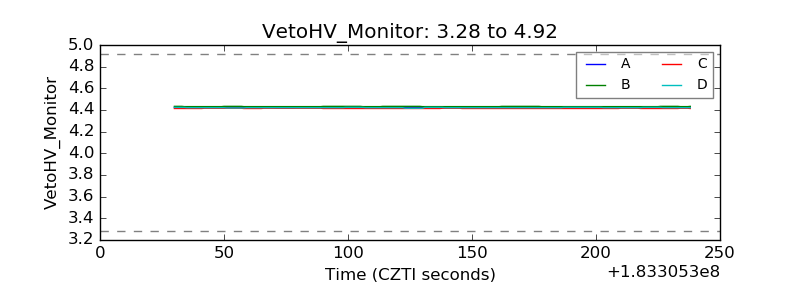 |
| Veto LLD | 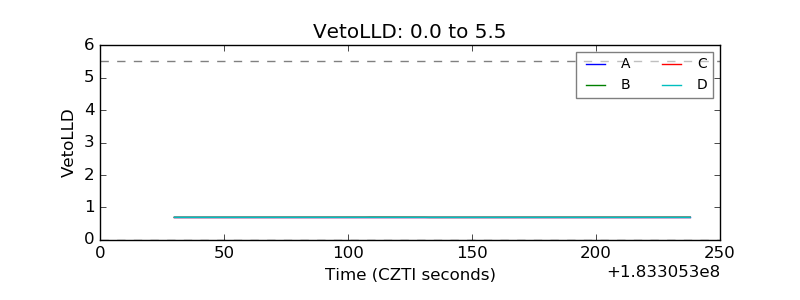 |
| Alpha Counter | 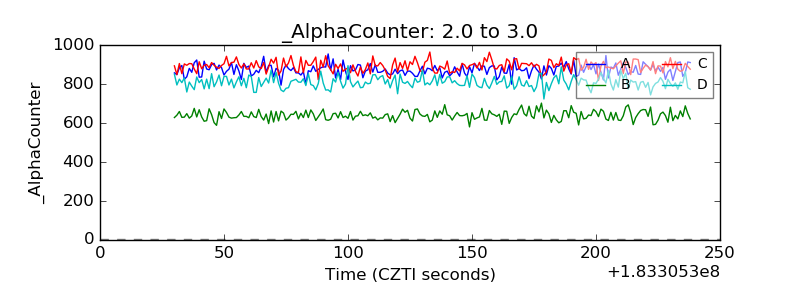 |
| _CPM_Rate | 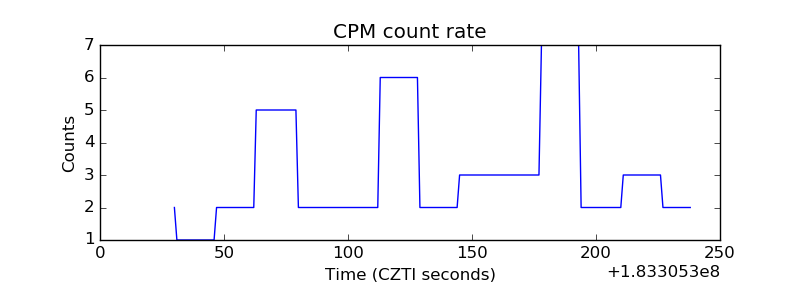 |
| CZT Counter | 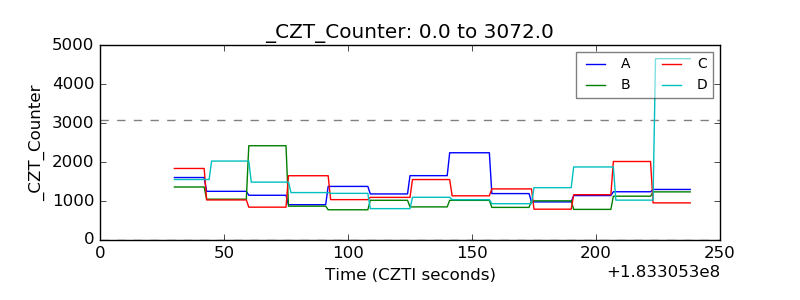 |
| +2.5 Volts monitor |  |
| +5 Volts monitor | 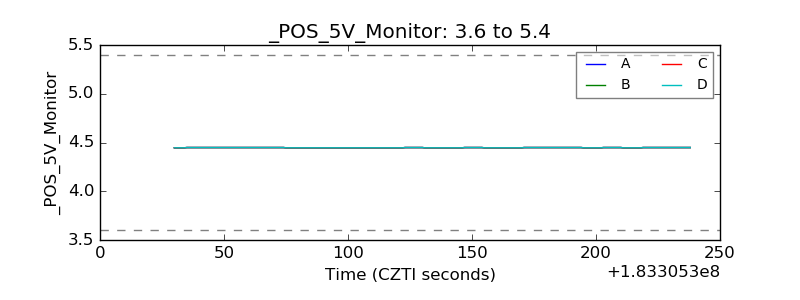 |
| Veto Counter | 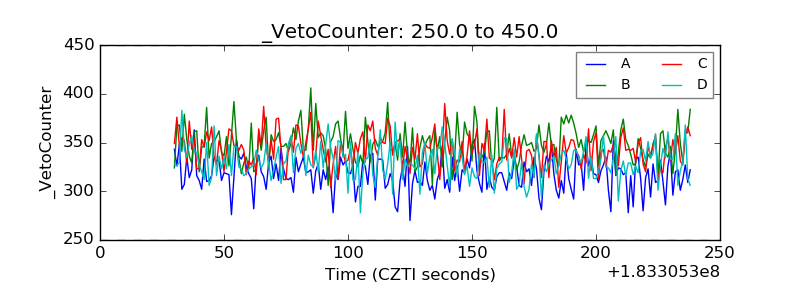 |