| Param | Original file | Final file |
|---|---|---|
| Filename | modeM0/AS1P01_161T05_9000000058_00378cztM0_level2.evt | modeM0/AS1P01_161T05_9000000058_00378cztM0_level2_quad_clean.evt |
| Size (bytes) | 682,678,080 | 43,770,240 |
| Size | 651.1 MB | 41.7 MB |
| Events in quadrant A | 4,845,903 | 274,550 |
| Events in quadrant B | 4,795,975 | 259,907 |
| Events in quadrant C | 5,276,858 | 270,104 |
| Events in quadrant D | 5,476,869 | 224,891 |
| Mode SS | |||
|---|---|---|---|
| Quadrant | BADHDUFLAG | Total packets | Discarded packets |
| A | 0 | 84 | 0 |
| B | 0 | 84 | 0 |
| C | 0 | 84 | 0 |
| D | 0 | 84 | 0 |
| Mode M9 | |||
|---|---|---|---|
| Quadrant | BADHDUFLAG | Total packets | Discarded packets |
| A | 0 | 23 | 0 |
| B | 0 | 23 | 0 |
| C | 0 | 23 | 0 |
| D | 0 | 23 | 0 |
| Mode M0 | |||
|---|---|---|---|
| Quadrant | BADHDUFLAG | Total packets | Discarded packets |
| A | 0 | 17380 | 2 |
| B | 0 | 17207 | 1 |
| C | 0 | 18676 | 1 |
| D | 0 | 19292 | 1 |
| Quadrant | Total seconds | Saturated seconds | Saturation percentage |
|---|---|---|---|
| A | 4201 | 4 | 0.095215% |
| B | 4201 | 2 | 0.047608% |
| C | 4201 | 50 | 1.190193% |
| D | 4201 | 174 | 4.141871% |
Noise dominated data is calculated using 1-second bins in cleaned event files. If a bin has >2000 counts, and if more than 50% of those come from <1% of pixels, then it is considered to be noise-dominated and hence unusable.
| Quadrant | # 1 sec bins | Bins with >0 counts | Bins with >2000 counts | High rate bins dominated by noise | Noise dominated (total time) | Noise dominated (detector-on time) | Marked lightcurve |
|---|---|---|---|---|---|---|---|
| A | 6416 | 4202 | 83 | 83 | 1.29% | 1.98% | 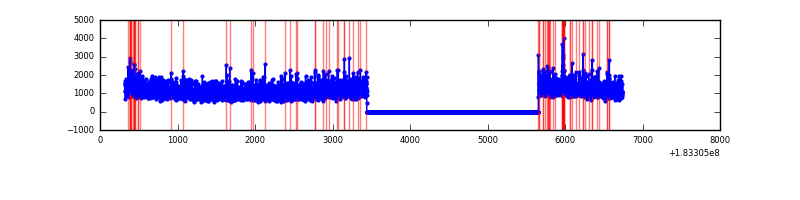 |
| B | 6416 | 4202 | 44 | 44 | 0.69% | 1.05% | 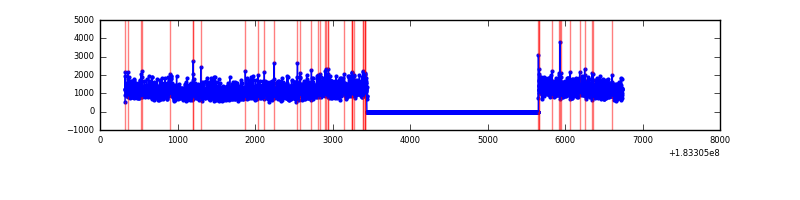 |
| C | 6416 | 4202 | 198 | 198 | 3.09% | 4.71% | 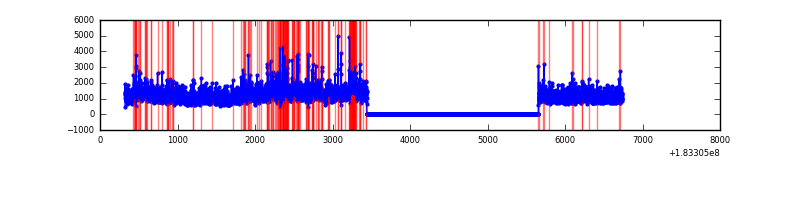 |
| D | 6416 | 4202 | 405 | 405 | 6.31% | 9.64% | 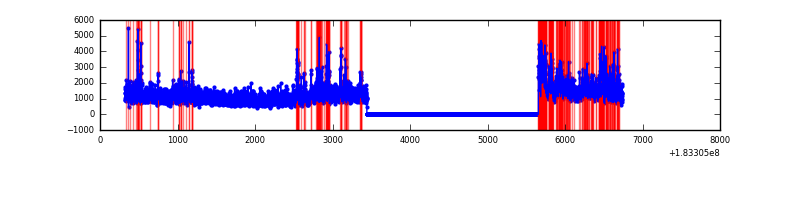 |
Top three noisy pixels from each quadrant. If the there are fewer than three noisy pixels in the level2.evt file, extra rows are filled as -1
| Pixel properties | Quadrant properties | ||||||
|---|---|---|---|---|---|---|---|
| Quadrant | DetID | PixID | Counts | Sigma | Mean | Median | Sigma |
| A | 0 | 69 | 79751 | 298.85 | 1195 | 1181 | 262.9 |
| A | 0 | 238 | 60055 | 223.93 | 1195 | 1181 | 262.9 |
| A | 12 | 243 | 27425 | 99.82 | 1195 | 1181 | 262.9 |
| B | 0 | 230 | 58042 | 201.45 | 1210 | 1213 | 282.1 |
| B | 4 | 235 | 26635 | 90.12 | 1210 | 1213 | 282.1 |
| B | 5 | 46 | 19460 | 64.68 | 1210 | 1213 | 282.1 |
| C | 10 | 107 | 611194 | 1941.2 | 1126 | 1168 | 314.3 |
| C | 5 | 234 | 216604 | 685.55 | 1126 | 1168 | 314.3 |
| C | 1 | 1 | 17133 | 50.8 | 1126 | 1168 | 314.3 |
| D | 13 | 7 | 790512 | 2432.17 | 1064 | 1103 | 324.6 |
| D | 1 | 5 | 138635 | 423.74 | 1064 | 1103 | 324.6 |
| D | 1 | 4 | 122269 | 373.31 | 1064 | 1103 | 324.6 |
Histogram calculated using DETX and DETY for each event in the final _common_clean file
| Quadrant A |  |
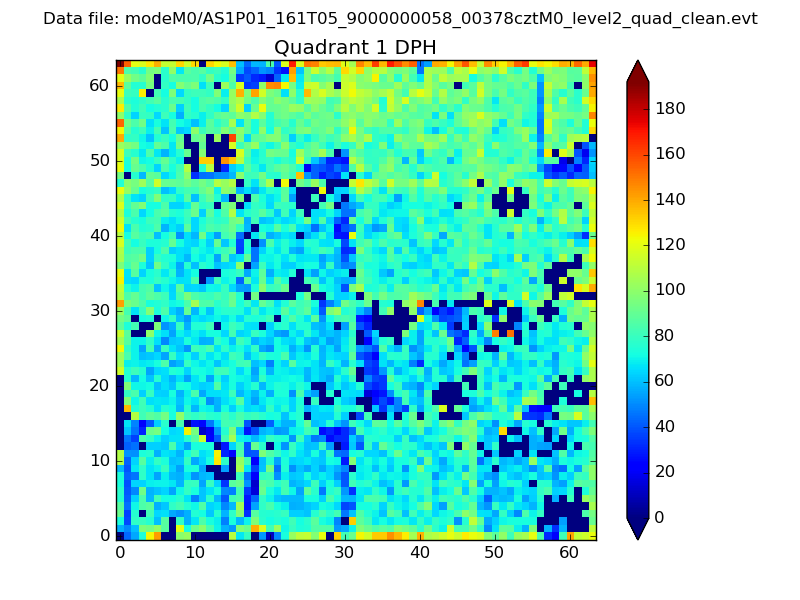 |
Quadrant B |
|---|---|---|---|
| Quadrant D |  |
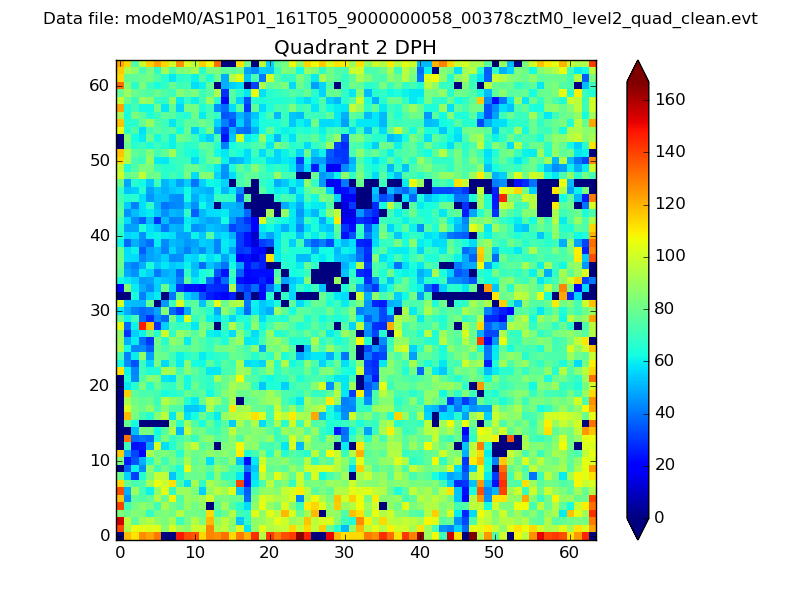 |
Quadrant C |
| Plot type | Count rate plots | Images |
|---|---|---|
| Comparison with Poisson distribution Blue bars denote a histogram of data divided into 1 sec bins. Red curve is a Poisson curve with rate = median count rate of data. |
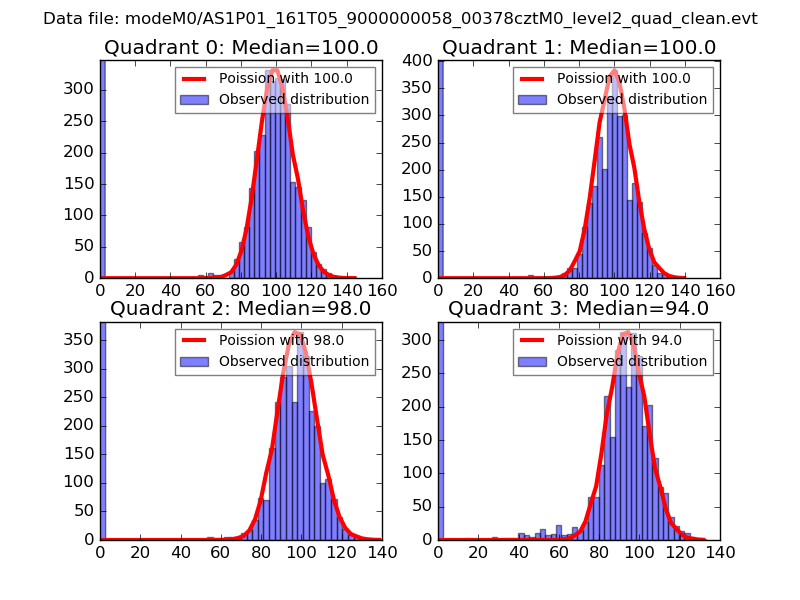 |
 |
| Quadrant-wise count rates Data is divided into 100 sec bins |
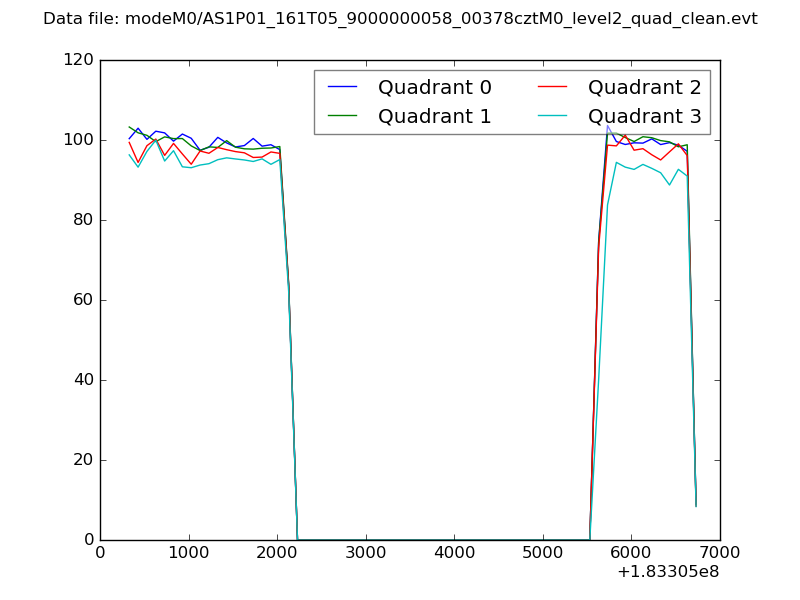 |
|
| Module-wise count rates for Quadrant A Data is divided into 100 sec bins |
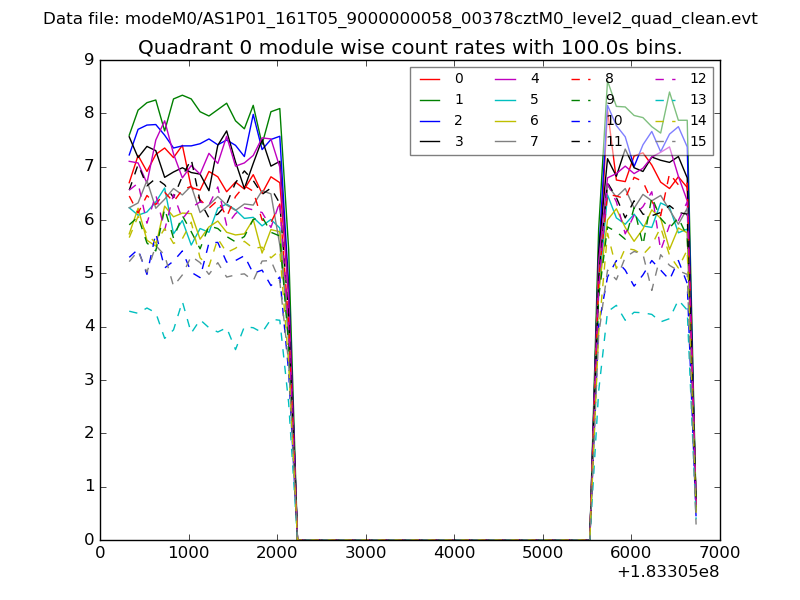 |
 |
| Module-wise count rates for Quadrant B Data is divided into 100 sec bins |
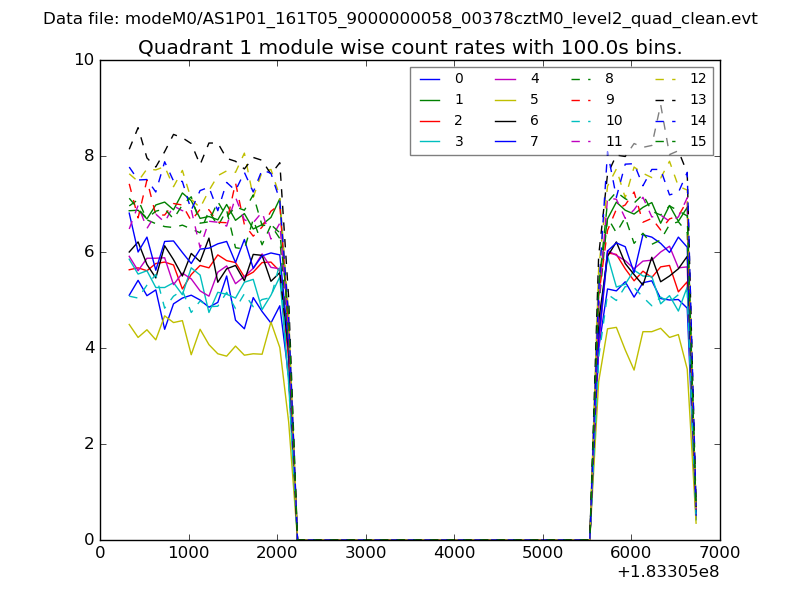 |
 |
| Module-wise count rates for Quadrant C Data is divided into 100 sec bins |
 |
 |
| Module-wise count rates for Quadrant D Data is divided into 100 sec bins |
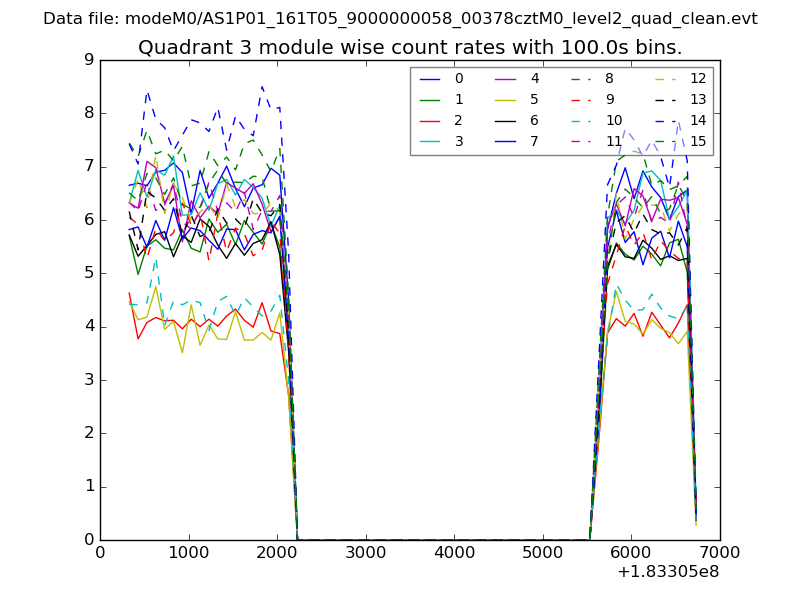 |
 |
| Parameter | Plot |
|---|---|
| CZT HV Monitor | 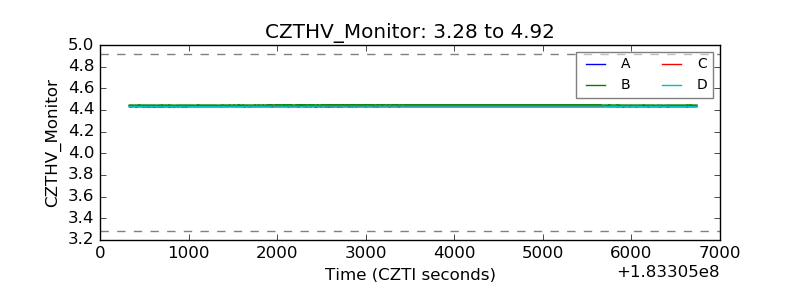 |
| D_VDD | 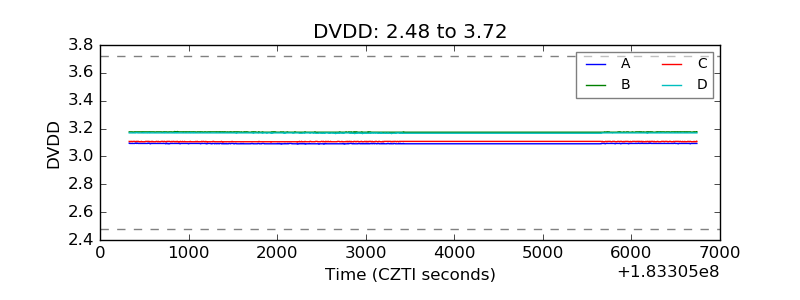 |
| Temperature 1 | 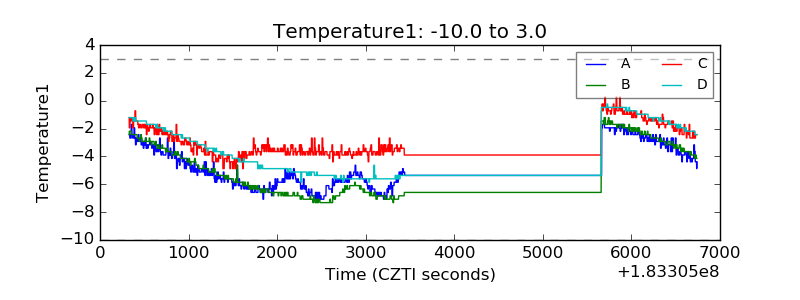 |
| Veto HV Monitor | 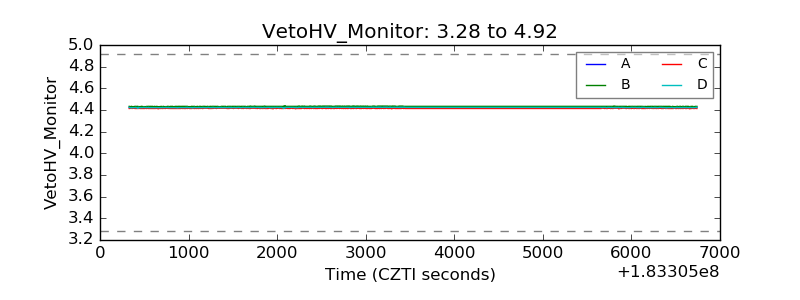 |
| Veto LLD | 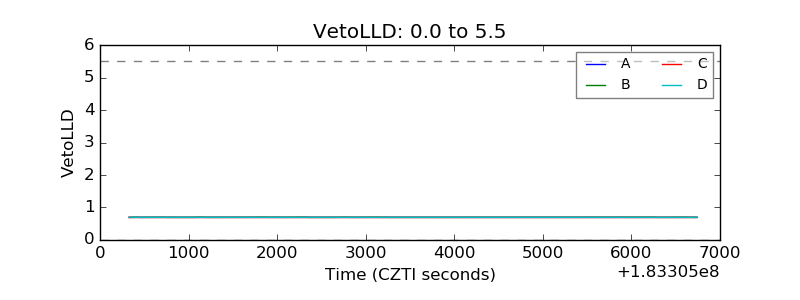 |
| Alpha Counter | 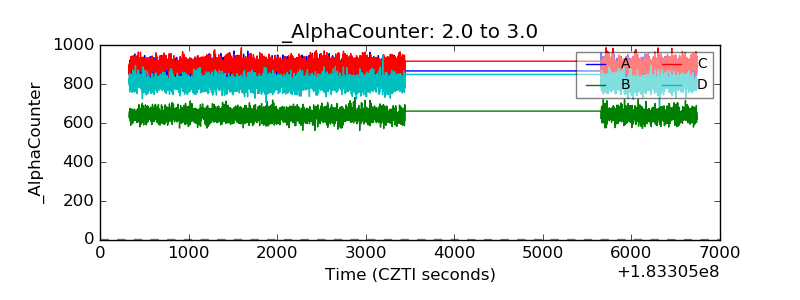 |
| _CPM_Rate | 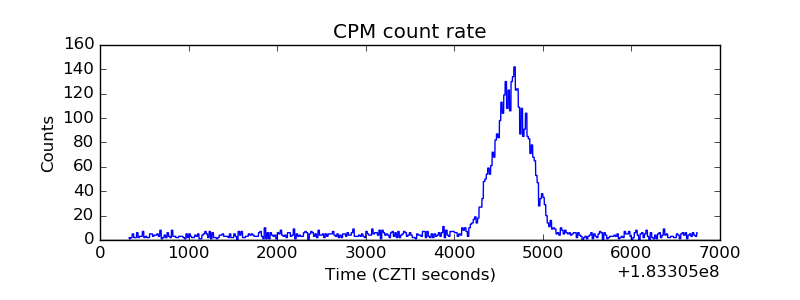 |
| CZT Counter | 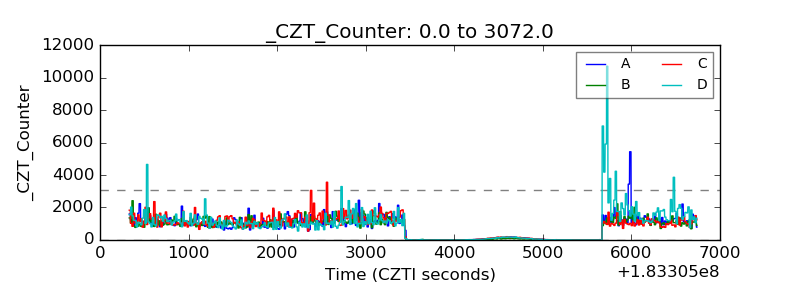 |
| +2.5 Volts monitor |  |
| +5 Volts monitor |  |
| Veto Counter | 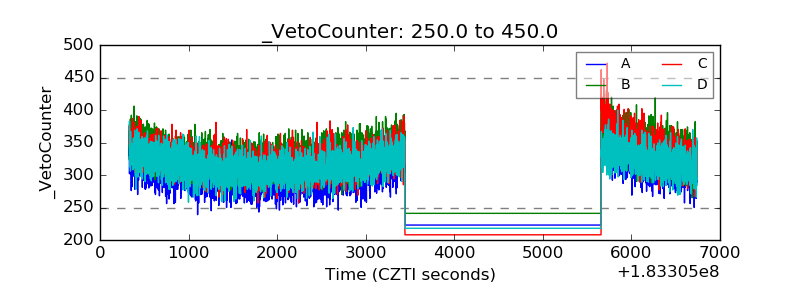 |