| Param | Original file | Final file |
|---|---|---|
| Filename | modeM0/AS1P01_161T05_9000000058_00379cztM0_level2.evt | modeM0/AS1P01_161T05_9000000058_00379cztM0_level2_quad_clean.evt |
| Size (bytes) | 808,064,640 | 48,268,800 |
| Size | 770.6 MB | 46.0 MB |
| Events in quadrant A | 5,879,133 | 293,373 |
| Events in quadrant B | 5,716,596 | 278,532 |
| Events in quadrant C | 6,222,951 | 290,171 |
| Events in quadrant D | 6,326,264 | 253,457 |
| Mode SS | |||
|---|---|---|---|
| Quadrant | BADHDUFLAG | Total packets | Discarded packets |
| A | 0 | 100 | 0 |
| B | 0 | 100 | 0 |
| C | 0 | 100 | 0 |
| D | 0 | 100 | 0 |
| Mode M9 | |||
|---|---|---|---|
| Quadrant | BADHDUFLAG | Total packets | Discarded packets |
| A | 0 | 22 | 0 |
| B | 0 | 22 | 0 |
| C | 0 | 22 | 0 |
| D | 0 | 22 | 0 |
| Mode M0 | |||
|---|---|---|---|
| Quadrant | BADHDUFLAG | Total packets | Discarded packets |
| A | 0 | 20997 | 2 |
| B | 0 | 20468 | 1 |
| C | 0 | 21960 | 1 |
| D | 0 | 22293 | 1 |
| Quadrant | Total seconds | Saturated seconds | Saturation percentage |
|---|---|---|---|
| A | 4928 | 11 | 0.223214% |
| B | 4928 | 6 | 0.121753% |
| C | 4928 | 122 | 2.475649% |
| D | 4928 | 105 | 2.130682% |
Noise dominated data is calculated using 1-second bins in cleaned event files. If a bin has >2000 counts, and if more than 50% of those come from <1% of pixels, then it is considered to be noise-dominated and hence unusable.
| Quadrant | # 1 sec bins | Bins with >0 counts | Bins with >2000 counts | High rate bins dominated by noise | Noise dominated (total time) | Noise dominated (detector-on time) | Marked lightcurve |
|---|---|---|---|---|---|---|---|
| A | 7142 | 4929 | 193 | 193 | 2.70% | 3.92% |  |
| B | 7142 | 4929 | 85 | 85 | 1.19% | 1.72% | 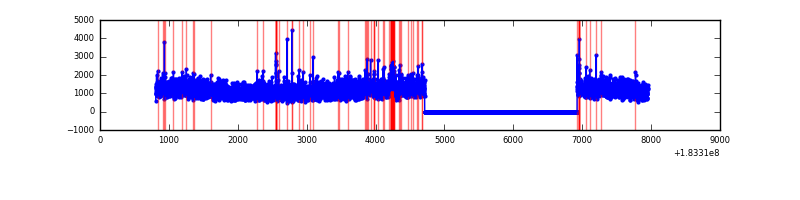 |
| C | 7142 | 4929 | 356 | 356 | 4.98% | 7.22% |  |
| D | 7142 | 4929 | 419 | 419 | 5.87% | 8.50% |  |
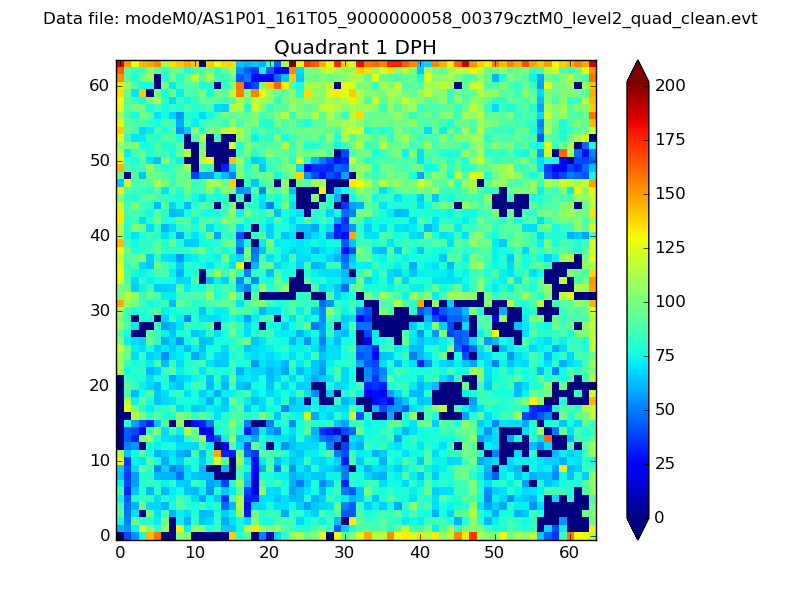
Top three noisy pixels from each quadrant. If the there are fewer than three noisy pixels in the level2.evt file, extra rows are filled as -1
| Pixel properties | Quadrant properties | ||||||
|---|---|---|---|---|---|---|---|
| Quadrant | DetID | PixID | Counts | Sigma | Mean | Median | Sigma |
| A | 0 | 69 | 230158 | 739.27 | 1412 | 1399 | 309.4 |
| A | 0 | 238 | 84969 | 270.07 | 1412 | 1399 | 309.4 |
| A | 12 | 150 | 64287 | 203.23 | 1412 | 1399 | 309.4 |
| B | 0 | 230 | 50998 | 149.14 | 1427 | 1433 | 332.3 |
| B | 0 | 207 | 48562 | 141.81 | 1427 | 1433 | 332.3 |
| B | 0 | 187 | 33147 | 95.43 | 1427 | 1433 | 332.3 |
| C | 10 | 107 | 875821 | 2376.9 | 1318 | 1366 | 367.9 |
| C | 1 | 1 | 101293 | 271.62 | 1318 | 1366 | 367.9 |
| C | 3 | 159 | 28633 | 74.12 | 1318 | 1366 | 367.9 |
| D | 13 | 7 | 966451 | 2445.64 | 1258 | 1305 | 394.6 |
| D | 7 | 85 | 124816 | 312.97 | 1258 | 1305 | 394.6 |
| D | 1 | 5 | 89680 | 223.94 | 1258 | 1305 | 394.6 |
Histogram calculated using DETX and DETY for each event in the final _common_clean file
| Quadrant A | 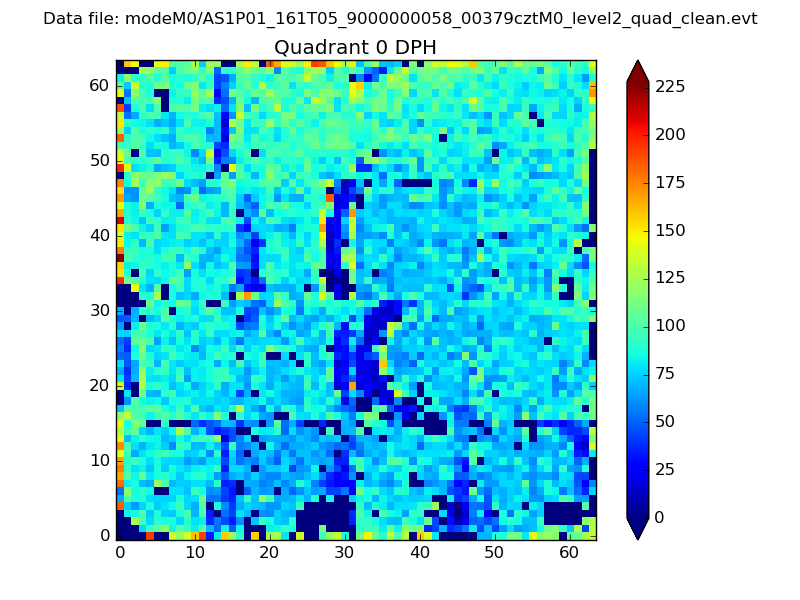 |
 |
Quadrant B |
|---|---|---|---|
| Quadrant D | 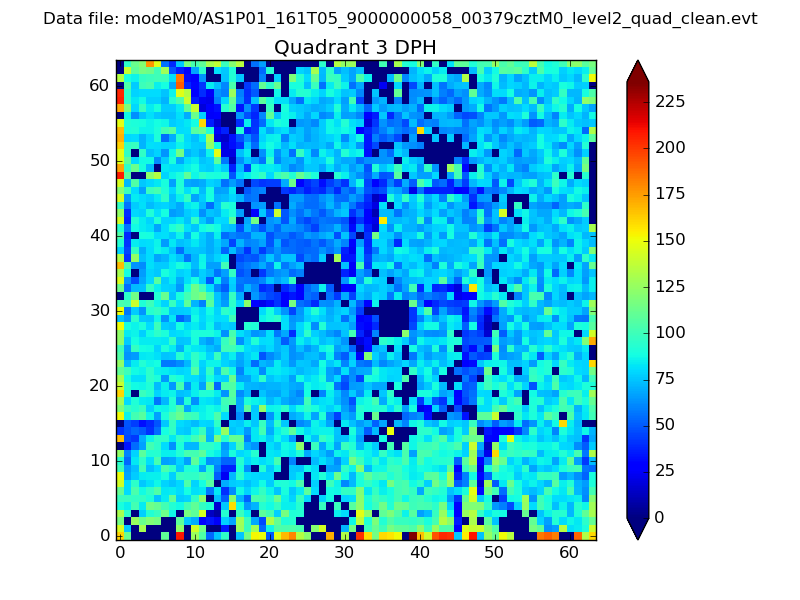 |
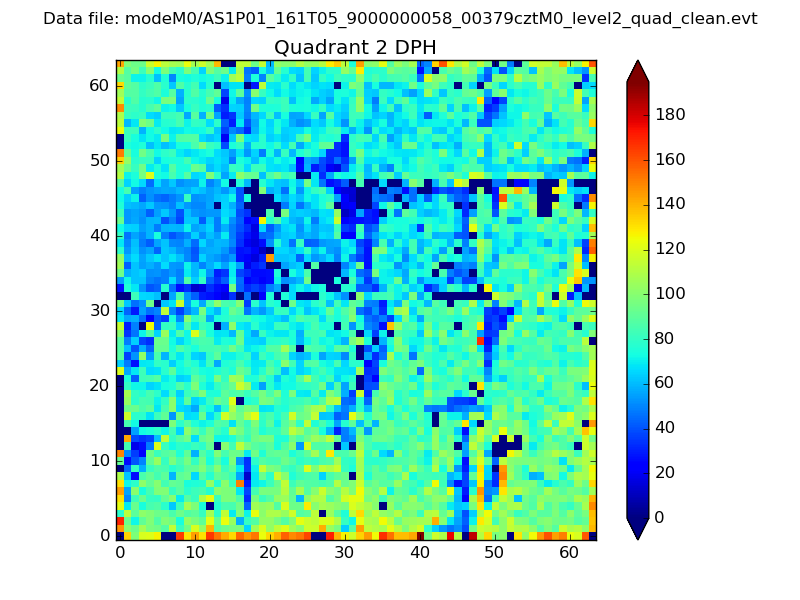 |
Quadrant C |
| Plot type | Count rate plots | Images |
|---|---|---|
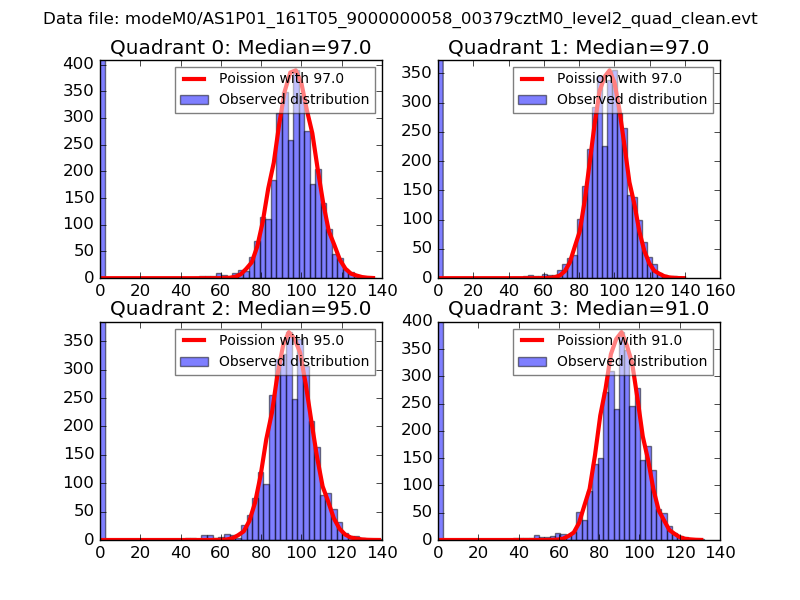
| Comparison with Poisson distribution Blue bars denote a histogram of data divided into 1 sec bins. Red curve is a Poisson curve with rate = median count rate of data. |
 |
 |
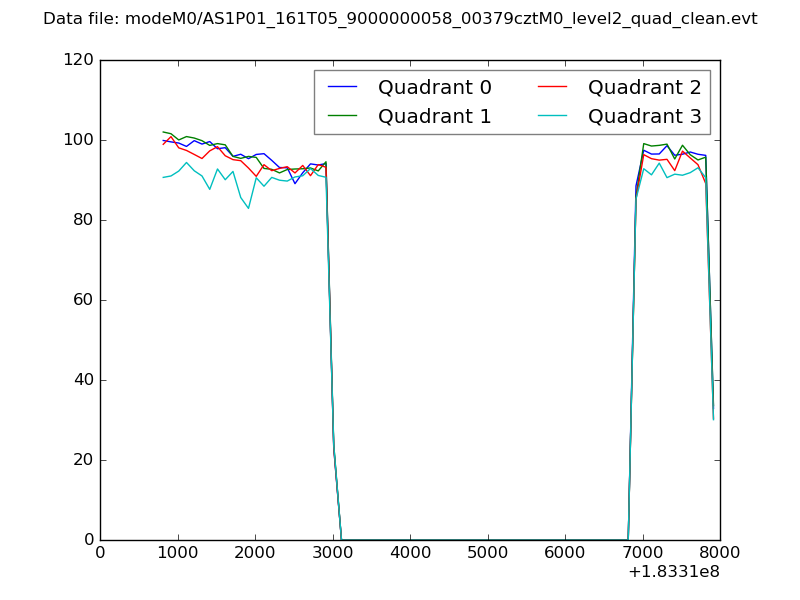
| Quadrant-wise count rates Data is divided into 100 sec bins |
 |
|
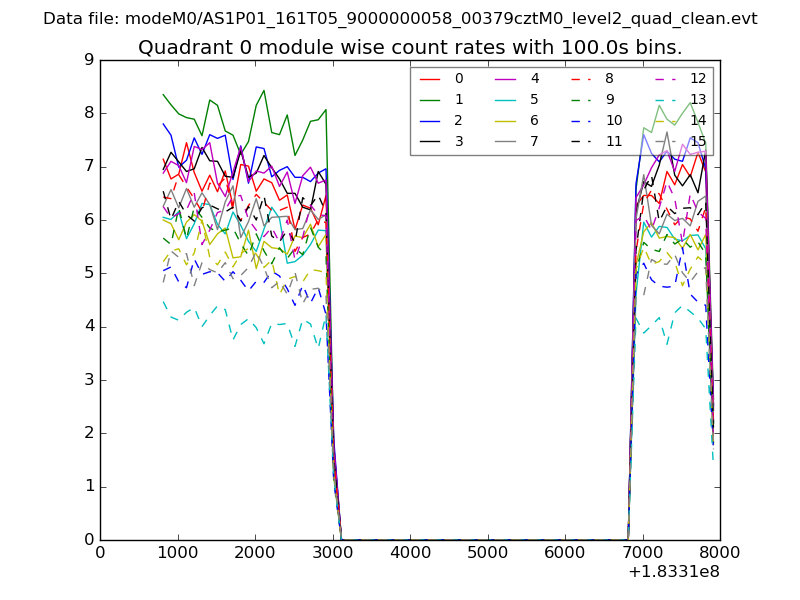
| Module-wise count rates for Quadrant A Data is divided into 100 sec bins |
 |
 |
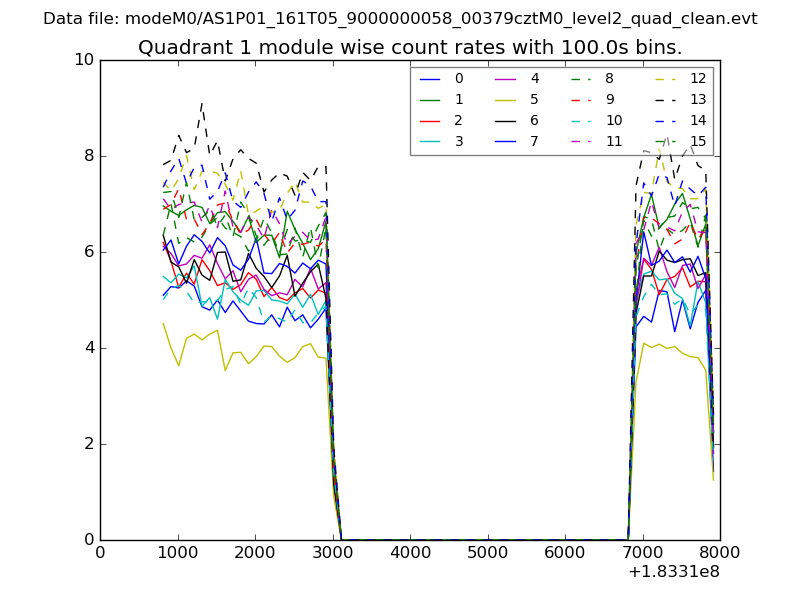
| Module-wise count rates for Quadrant B Data is divided into 100 sec bins |
 |
 |
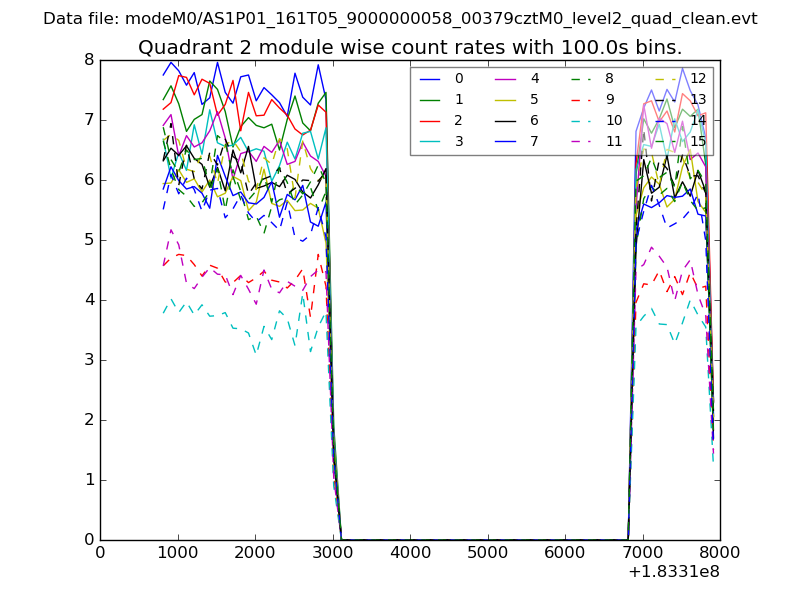
| Module-wise count rates for Quadrant C Data is divided into 100 sec bins |
 |
 |
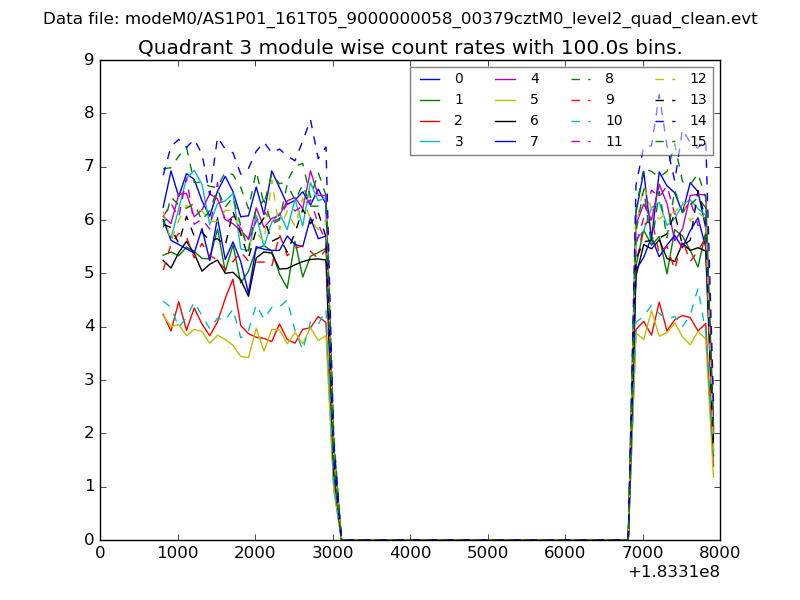
| Module-wise count rates for Quadrant D Data is divided into 100 sec bins |
 |
 |
| Parameter | Plot |
|---|---|
| CZT HV Monitor | 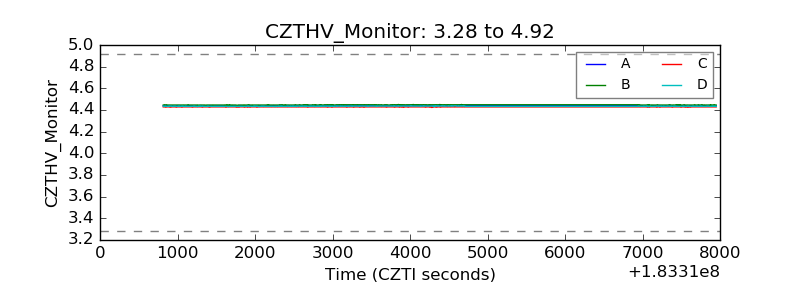 |
| D_VDD | 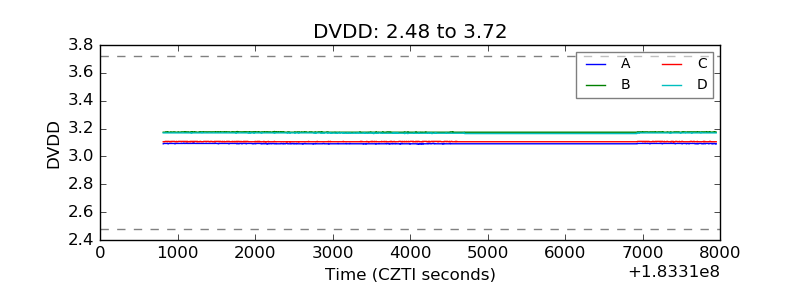 |
| Temperature 1 | 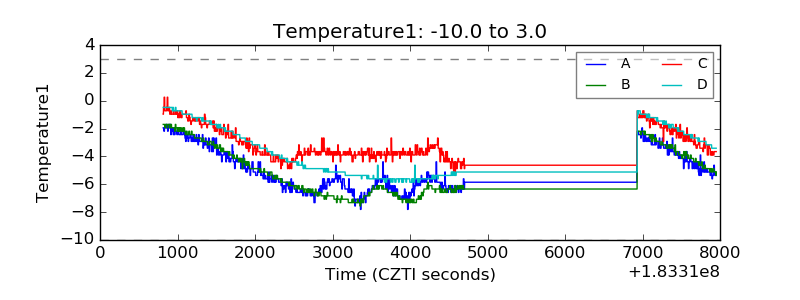 |
| Veto HV Monitor | 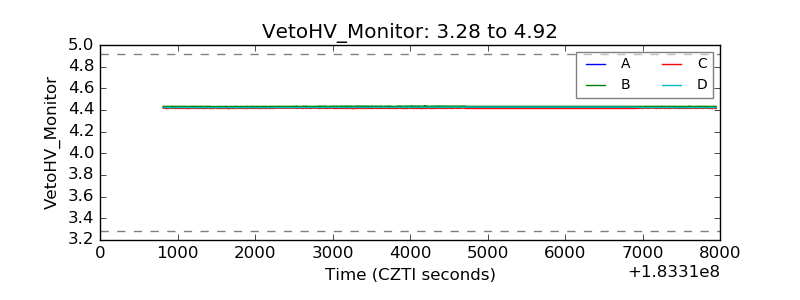 |
| Veto LLD |  |
| Alpha Counter | 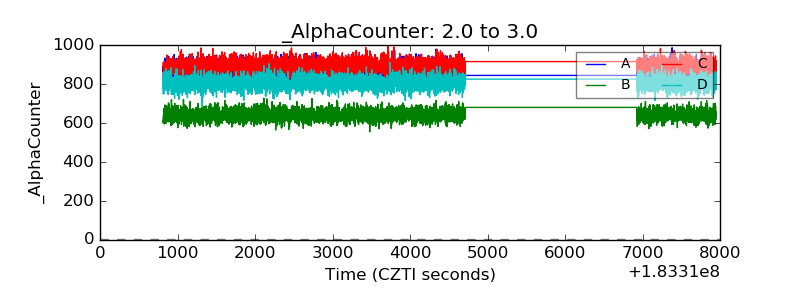 |
| _CPM_Rate | 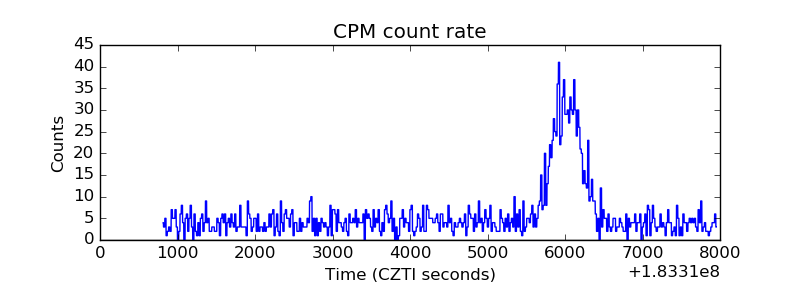 |
| CZT Counter | 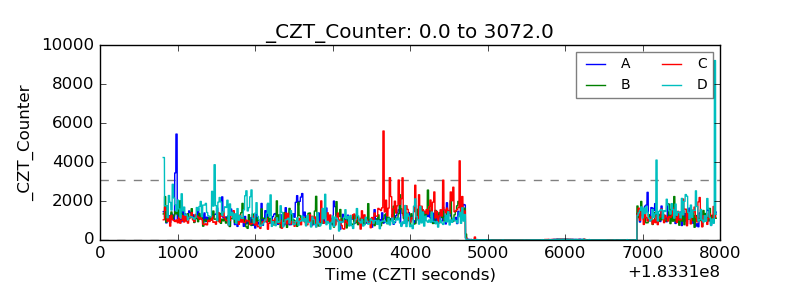 |
| +2.5 Volts monitor |  |
| +5 Volts monitor |  |
| Veto Counter | 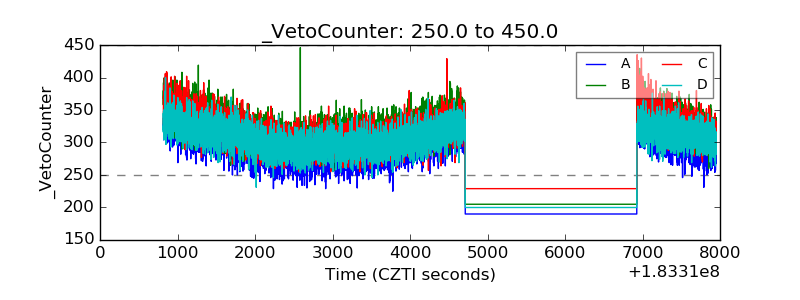 |