| Param | Original file | Final file |
|---|---|---|
| Filename | modeM0/AS1P01_161T05_9000000058_00380cztM0_level2.evt | modeM0/AS1P01_161T05_9000000058_00380cztM0_level2_quad_clean.evt |
| Size (bytes) | 778,936,320 | 43,850,880 |
| Size | 742.9 MB | 41.8 MB |
| Events in quadrant A | 5,685,264 | 255,751 |
| Events in quadrant B | 5,642,889 | 242,009 |
| Events in quadrant C | 5,640,204 | 251,285 |
| Events in quadrant D | 6,291,002 | 229,647 |
| Mode SS | |||
|---|---|---|---|
| Quadrant | BADHDUFLAG | Total packets | Discarded packets |
| A | 0 | 102 | 0 |
| B | 0 | 102 | 0 |
| C | 0 | 102 | 0 |
| D | 0 | 102 | 0 |
| Mode M9 | |||
|---|---|---|---|
| Quadrant | BADHDUFLAG | Total packets | Discarded packets |
| A | 0 | 22 | 0 |
| B | 0 | 22 | 0 |
| C | 0 | 22 | 0 |
| D | 0 | 22 | 0 |
| Mode M0 | |||
|---|---|---|---|
| Quadrant | BADHDUFLAG | Total packets | Discarded packets |
| A | 0 | 20440 | 3 |
| B | 0 | 20293 | 2 |
| C | 0 | 20243 | 2 |
| D | 0 | 22299 | 2 |
| Quadrant | Total seconds | Saturated seconds | Saturation percentage |
|---|---|---|---|
| A | 4965 | 4 | 0.080564% |
| B | 4965 | 5 | 0.100705% |
| C | 4965 | 37 | 0.745217% |
| D | 4965 | 265 | 5.337362% |
Noise dominated data is calculated using 1-second bins in cleaned event files. If a bin has >2000 counts, and if more than 50% of those come from <1% of pixels, then it is considered to be noise-dominated and hence unusable.
| Quadrant | # 1 sec bins | Bins with >0 counts | Bins with >2000 counts | High rate bins dominated by noise | Noise dominated (total time) | Noise dominated (detector-on time) | Marked lightcurve |
|---|---|---|---|---|---|---|---|
| A | 7181 | 4966 | 96 | 96 | 1.34% | 1.93% | 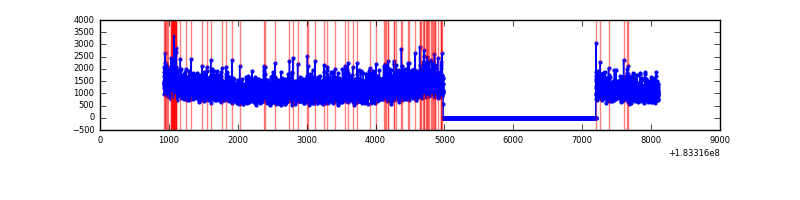 |
| B | 7181 | 4966 | 52 | 52 | 0.72% | 1.05% | 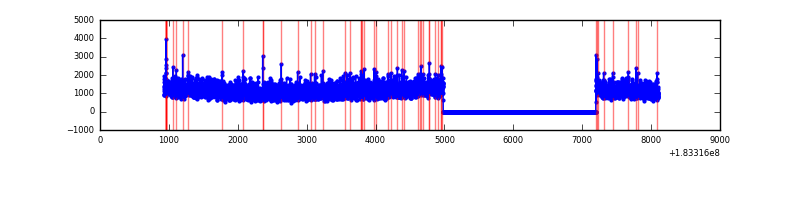 |
| C | 7181 | 4966 | 102 | 102 | 1.42% | 2.05% | 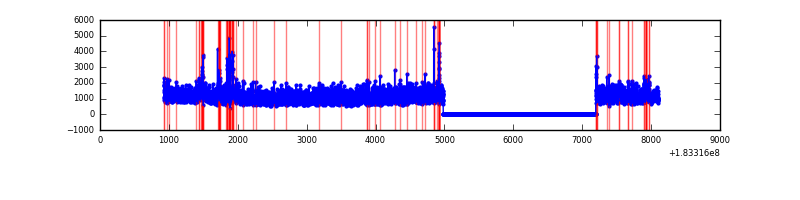 |
| D | 7181 | 4966 | 507 | 507 | 7.06% | 10.21% | 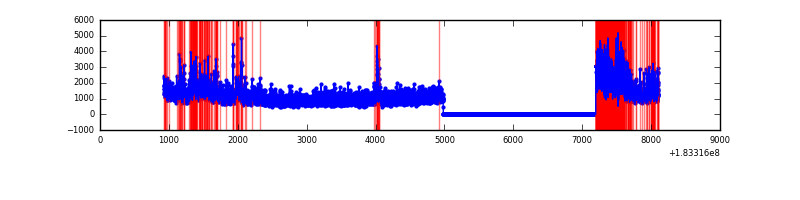 |
Top three noisy pixels from each quadrant. If the there are fewer than three noisy pixels in the level2.evt file, extra rows are filled as -1
| Pixel properties | Quadrant properties | ||||||
|---|---|---|---|---|---|---|---|
| Quadrant | DetID | PixID | Counts | Sigma | Mean | Median | Sigma |
| A | 0 | 238 | 65315 | 204.74 | 1414 | 1401 | 312.2 |
| A | 0 | 69 | 64601 | 202.45 | 1414 | 1401 | 312.2 |
| A | 12 | 150 | 49899 | 155.36 | 1414 | 1401 | 312.2 |
| B | 0 | 230 | 30487 | 86.77 | 1440 | 1444 | 334.7 |
| B | 5 | 46 | 18670 | 51.47 | 1440 | 1444 | 334.7 |
| B | 0 | 207 | 14040 | 37.63 | 1440 | 1444 | 334.7 |
| C | 10 | 107 | 158602 | 418.91 | 1336 | 1383 | 375.3 |
| C | 1 | 1 | 158460 | 418.54 | 1336 | 1383 | 375.3 |
| C | 3 | 159 | 40766 | 104.94 | 1336 | 1383 | 375.3 |
| D | 7 | 85 | 986626 | 2488.93 | 1246 | 1293 | 395.9 |
| D | 13 | 7 | 294371 | 740.31 | 1246 | 1293 | 395.9 |
| D | 12 | 0 | 48078 | 118.18 | 1246 | 1293 | 395.9 |
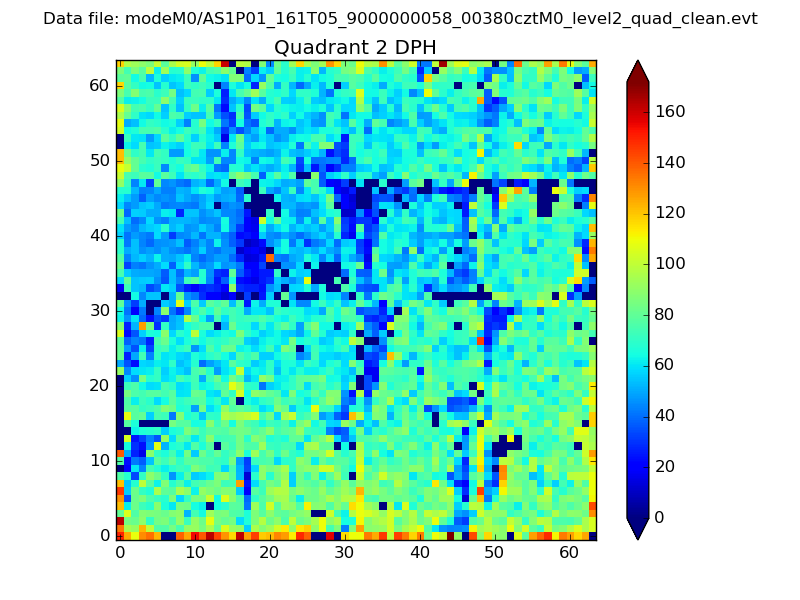
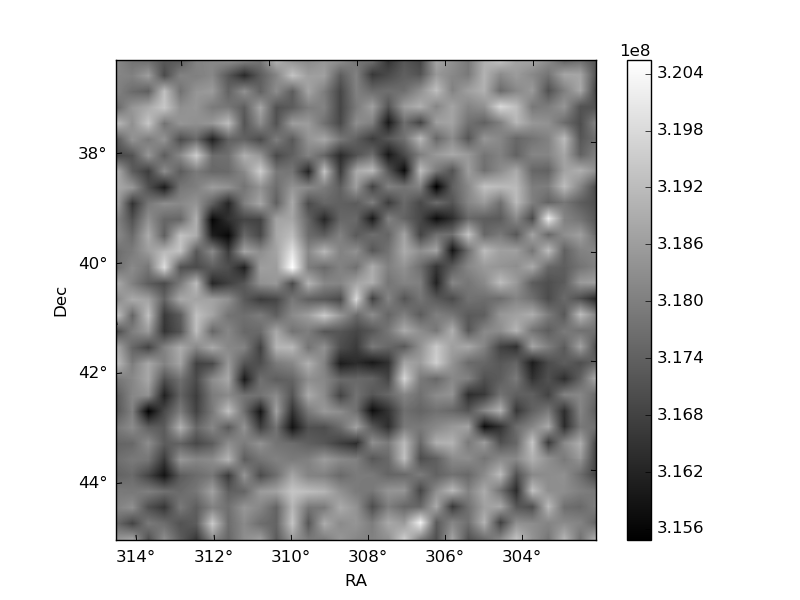
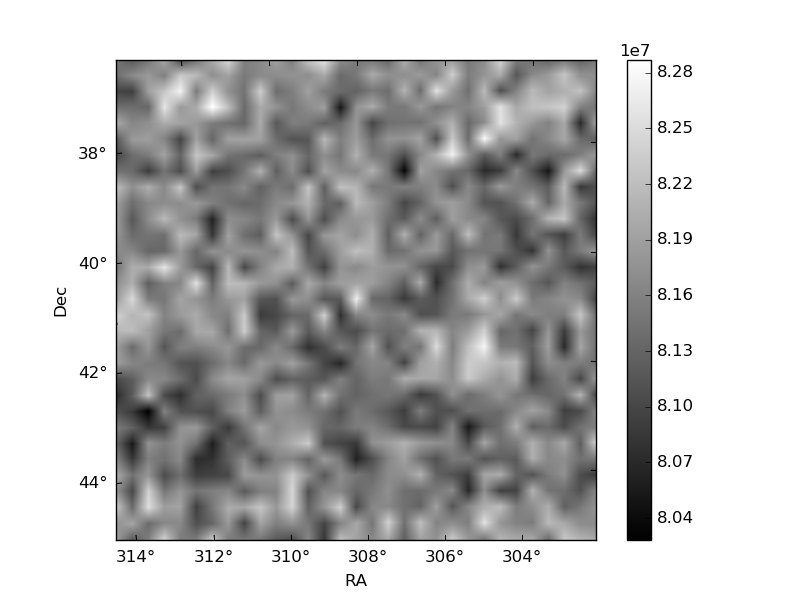
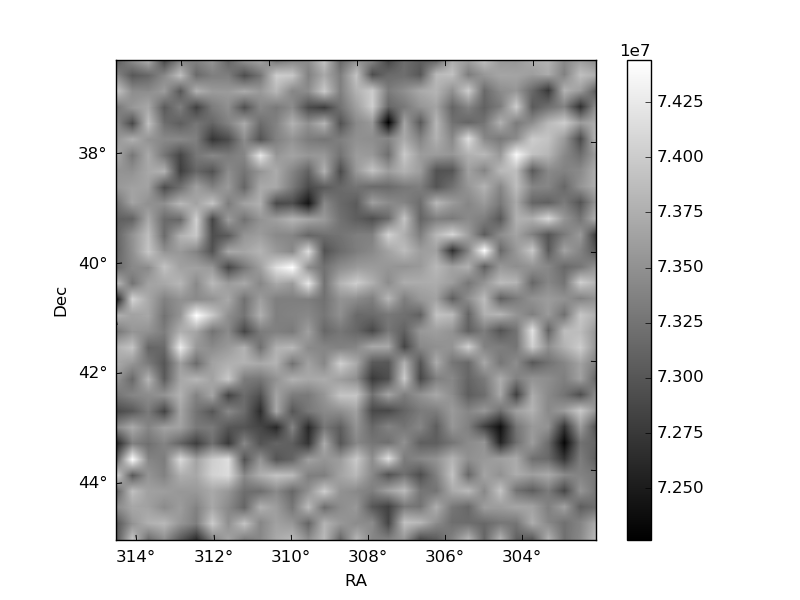
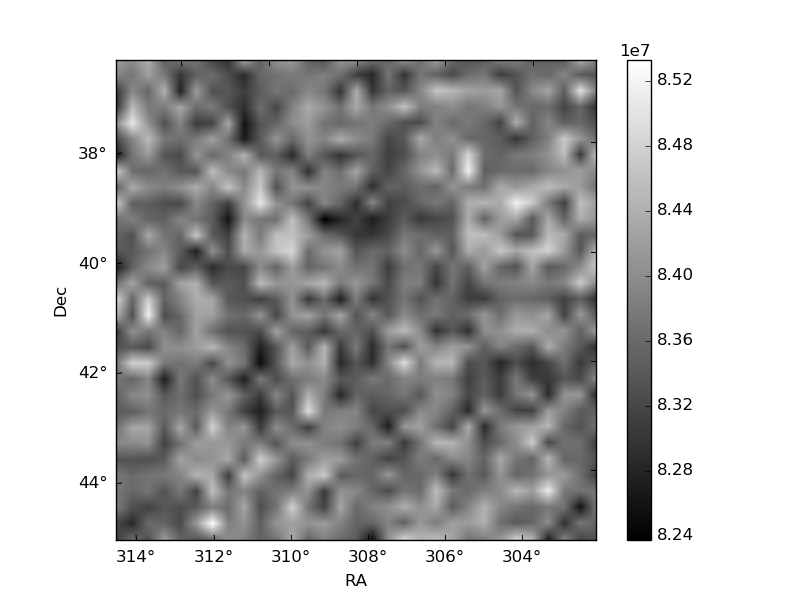
Histogram calculated using DETX and DETY for each event in the final _common_clean file
| Quadrant A | 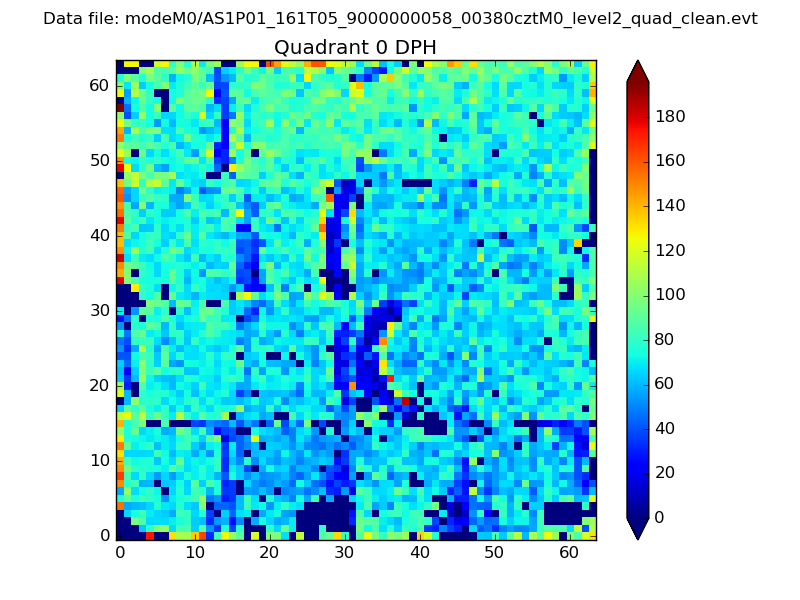 |
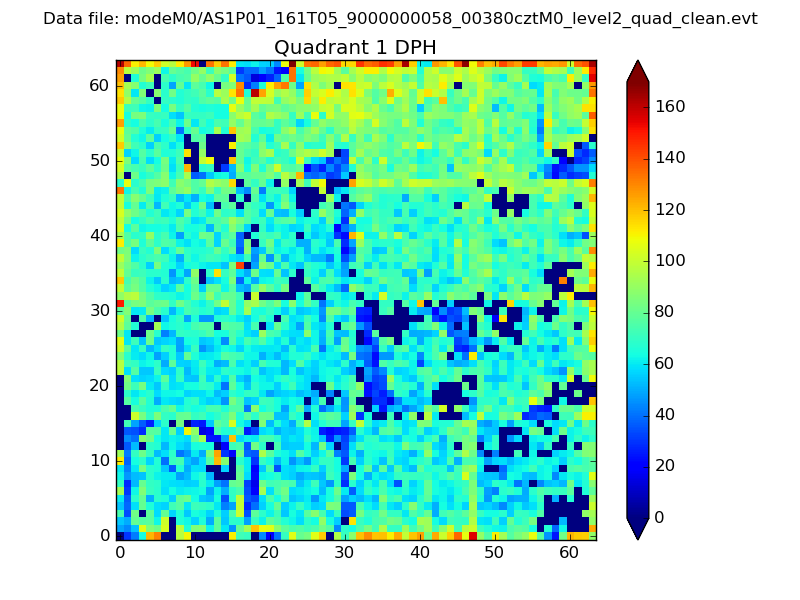 |
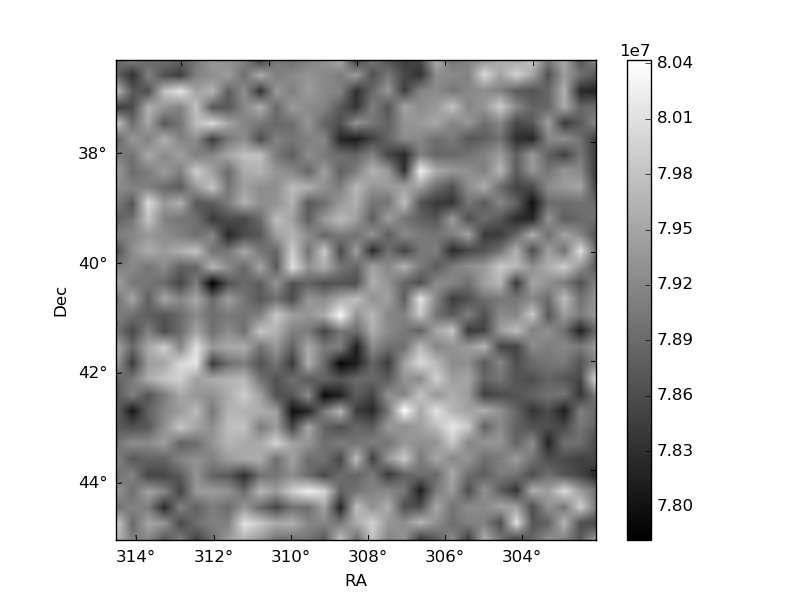
Quadrant B |
|---|---|---|---|
| Quadrant D | 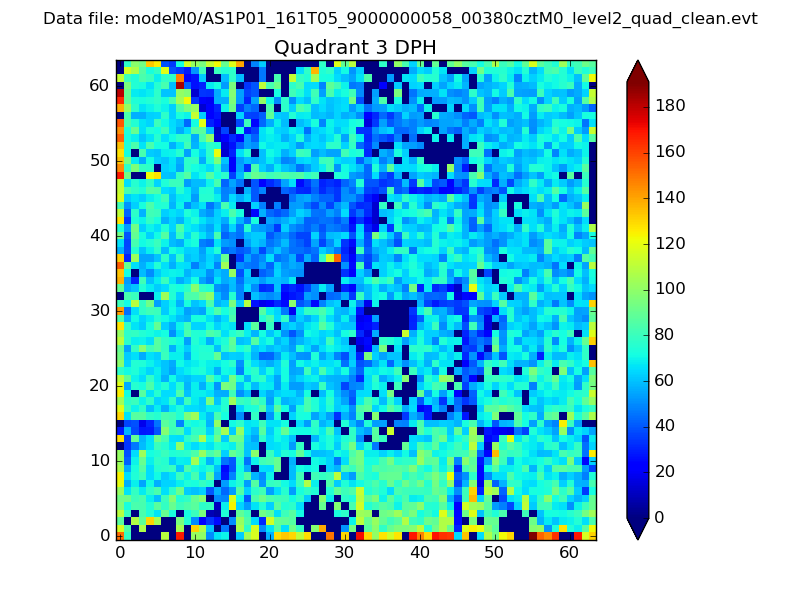 |
 |
Quadrant C |
| Plot type | Count rate plots | Images |
|---|---|---|
| Comparison with Poisson distribution Blue bars denote a histogram of data divided into 1 sec bins. Red curve is a Poisson curve with rate = median count rate of data. |
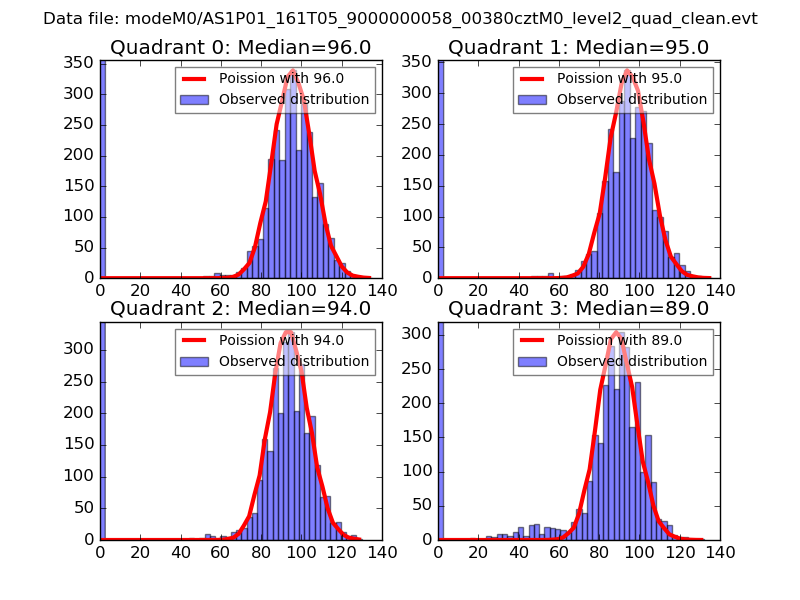 |
 |
| Quadrant-wise count rates Data is divided into 100 sec bins |
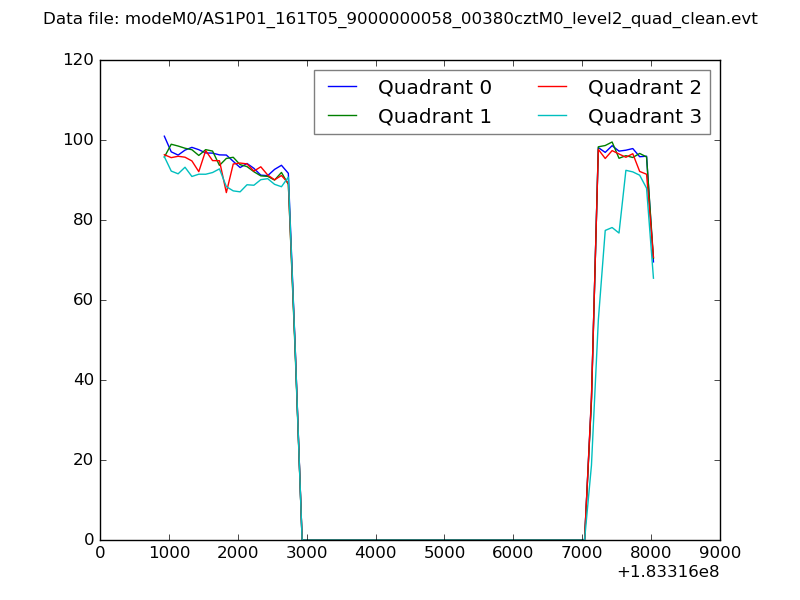 |
|
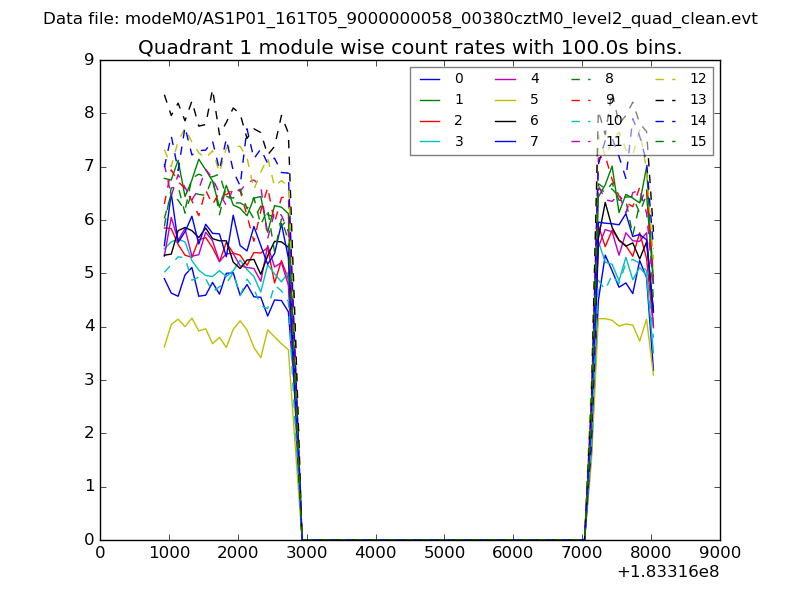
| Module-wise count rates for Quadrant A Data is divided into 100 sec bins |
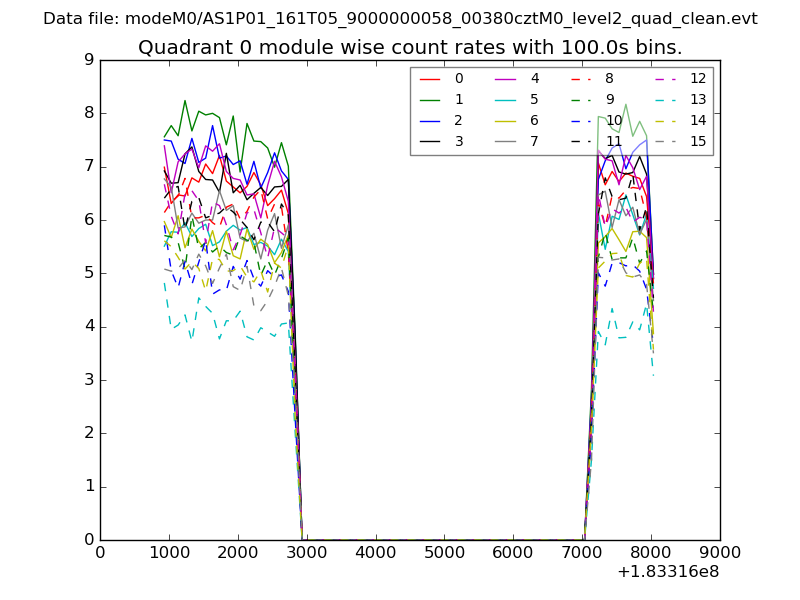 |
 |
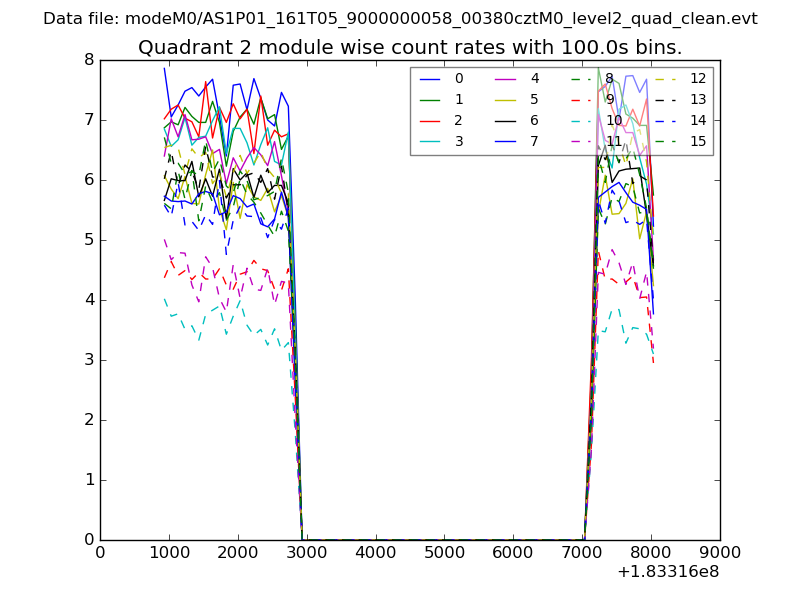
| Module-wise count rates for Quadrant B Data is divided into 100 sec bins |
 |
 |
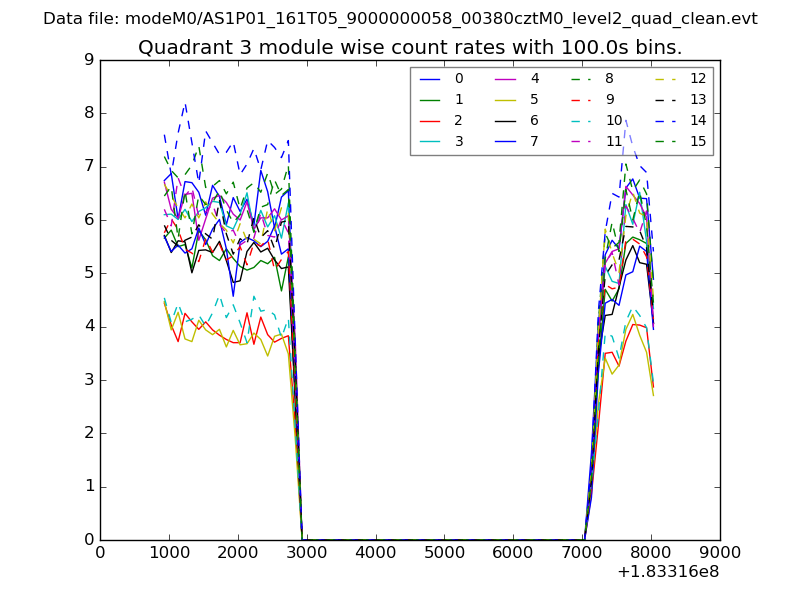
| Module-wise count rates for Quadrant C Data is divided into 100 sec bins |
 |
 |
| Module-wise count rates for Quadrant D Data is divided into 100 sec bins |
 |
 |
| Parameter | Plot |
|---|---|
| CZT HV Monitor |  |
| D_VDD | 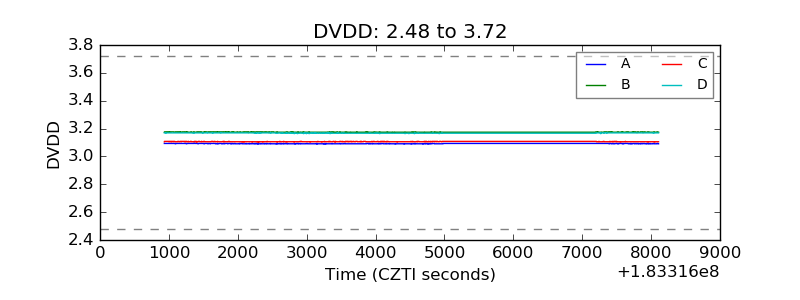 |
| Temperature 1 | 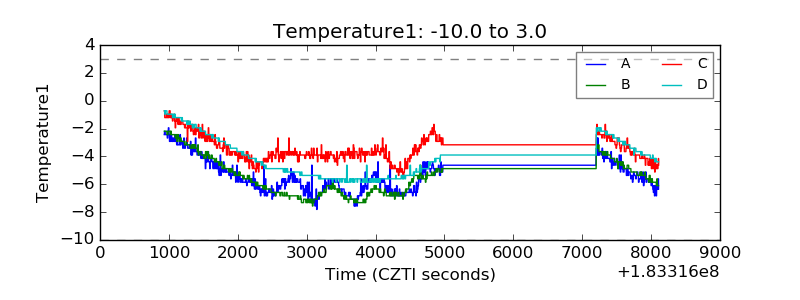 |
| Veto HV Monitor | 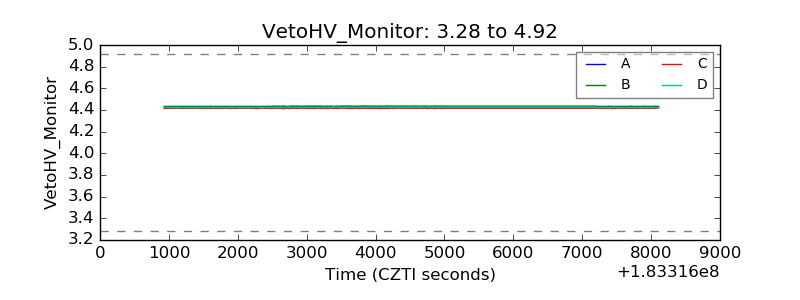 |
| Veto LLD | 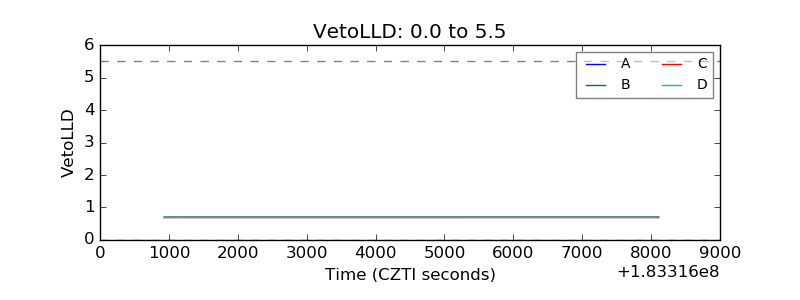 |
| Alpha Counter |  |
| _CPM_Rate | 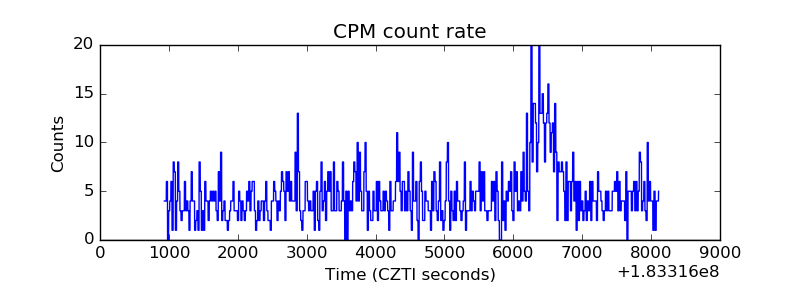 |
| CZT Counter |  |
| +2.5 Volts monitor | 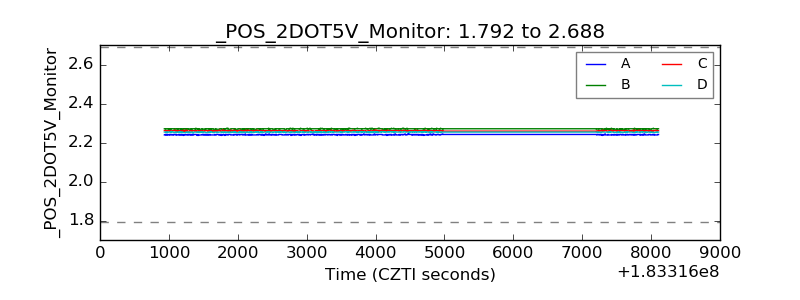 |
| +5 Volts monitor |  |
| _ROLL_ROT | 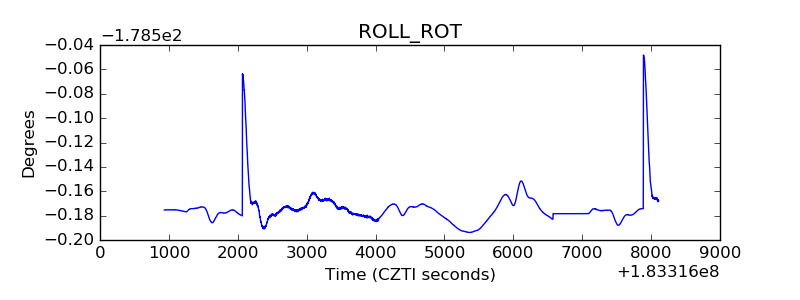 |
| _Roll_DEC | 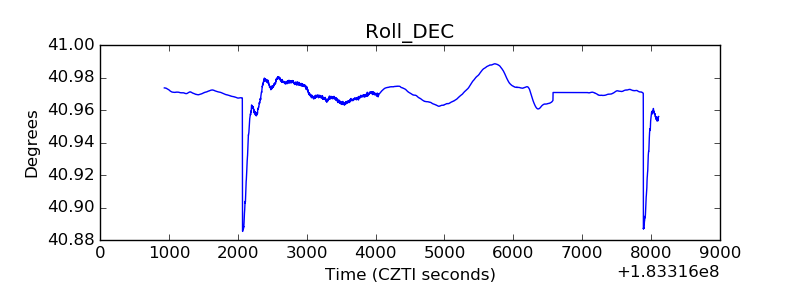 |
| _Roll_RA | 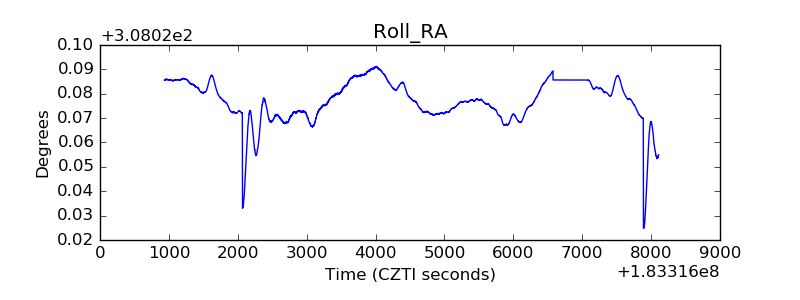 |
| Veto Counter | 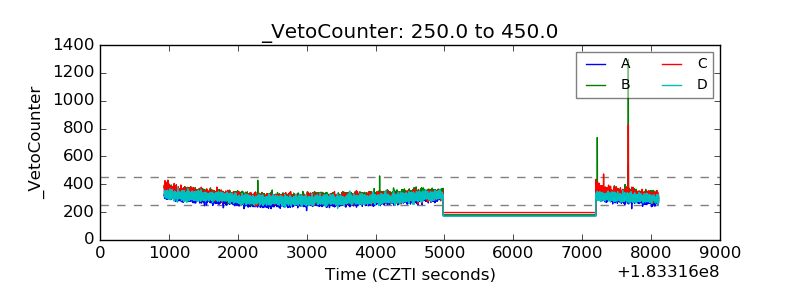 |