| Param | Original file | Final file |
|---|---|---|
| Filename | modeM0/AS1P01_161T05_9000000058_00381cztM0_level2.evt | modeM0/AS1P01_161T05_9000000058_00381cztM0_level2_quad_clean.evt |
| Size (bytes) | 812,191,680 | 43,663,680 |
| Size | 774.6 MB | 41.6 MB |
| Events in quadrant A | 6,009,773 | 252,594 |
| Events in quadrant B | 5,743,732 | 241,177 |
| Events in quadrant C | 5,778,768 | 251,785 |
| Events in quadrant D | 6,731,740 | 224,517 |
| Mode SS | |||
|---|---|---|---|
| Quadrant | BADHDUFLAG | Total packets | Discarded packets |
| A | 0 | 100 | 0 |
| B | 0 | 100 | 0 |
| C | 0 | 100 | 0 |
| D | 0 | 100 | 0 |
| Mode M9 | |||
|---|---|---|---|
| Quadrant | BADHDUFLAG | Total packets | Discarded packets |
| A | 0 | 23 | 0 |
| B | 0 | 23 | 0 |
| C | 0 | 23 | 0 |
| D | 0 | 24 | 0 |
| Mode M0 | |||
|---|---|---|---|
| Quadrant | BADHDUFLAG | Total packets | Discarded packets |
| A | 0 | 21464 | 3 |
| B | 0 | 20635 | 2 |
| C | 0 | 20731 | 2 |
| D | 0 | 23612 | 2 |
| Quadrant | Total seconds | Saturated seconds | Saturation percentage |
|---|---|---|---|
| A | 5016 | 100 | 1.993620% |
| B | 5016 | 8 | 0.159490% |
| C | 5016 | 19 | 0.378788% |
| D | 5016 | 383 | 7.635566% |
Noise dominated data is calculated using 1-second bins in cleaned event files. If a bin has >2000 counts, and if more than 50% of those come from <1% of pixels, then it is considered to be noise-dominated and hence unusable.
| Quadrant | # 1 sec bins | Bins with >0 counts | Bins with >2000 counts | High rate bins dominated by noise | Noise dominated (total time) | Noise dominated (detector-on time) | Marked lightcurve |
|---|---|---|---|---|---|---|---|
| A | 7231 | 5017 | 244 | 244 | 3.37% | 4.86% | 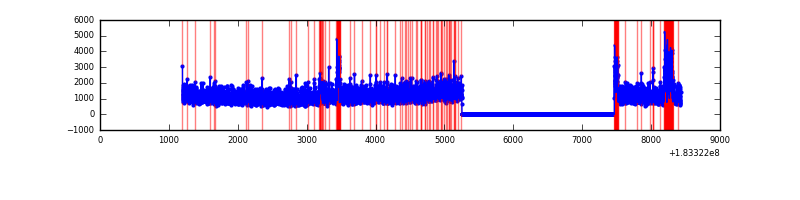 |
| B | 7231 | 5017 | 64 | 64 | 0.89% | 1.28% | 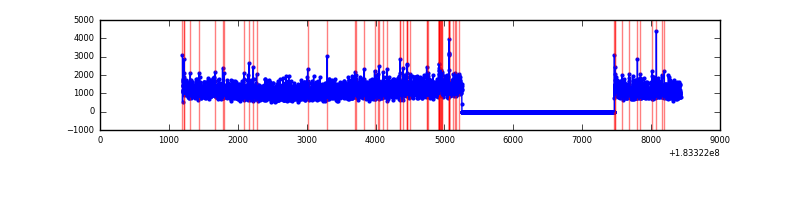 |
| C | 7231 | 5017 | 106 | 106 | 1.47% | 2.11% | 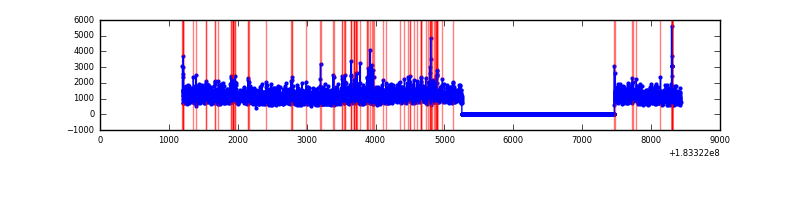 |
| D | 7231 | 5017 | 663 | 663 | 9.17% | 13.22% | 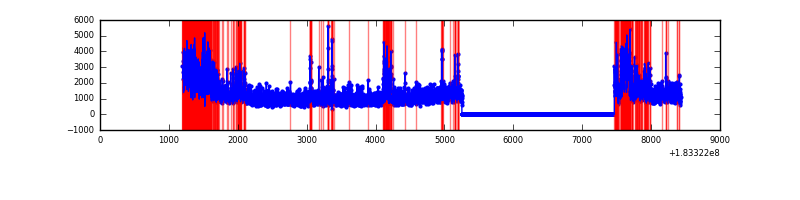 |
Top three noisy pixels from each quadrant. If the there are fewer than three noisy pixels in the level2.evt file, extra rows are filled as -1
| Pixel properties | Quadrant properties | ||||||
|---|---|---|---|---|---|---|---|
| Quadrant | DetID | PixID | Counts | Sigma | Mean | Median | Sigma |
| A | 0 | 69 | 391736 | 1213.93 | 1429 | 1411 | 321.5 |
| A | 0 | 238 | 68649 | 209.11 | 1429 | 1411 | 321.5 |
| A | 12 | 150 | 11720 | 32.06 | 1429 | 1411 | 321.5 |
| B | 0 | 207 | 36184 | 100.38 | 1474 | 1480 | 345.7 |
| B | 0 | 182 | 22992 | 62.22 | 1474 | 1480 | 345.7 |
| B | 5 | 46 | 10273 | 25.43 | 1474 | 1480 | 345.7 |
| C | 10 | 107 | 222264 | 586.45 | 1350 | 1401 | 376.6 |
| C | 1 | 1 | 95512 | 249.89 | 1350 | 1401 | 376.6 |
| C | 3 | 159 | 82269 | 214.73 | 1350 | 1401 | 376.6 |
| D | 7 | 85 | 1010466 | 2561.41 | 1239 | 1284 | 394.0 |
| D | 13 | 7 | 466411 | 1180.54 | 1239 | 1284 | 394.0 |
| D | 13 | 155 | 147831 | 371.95 | 1239 | 1284 | 394.0 |
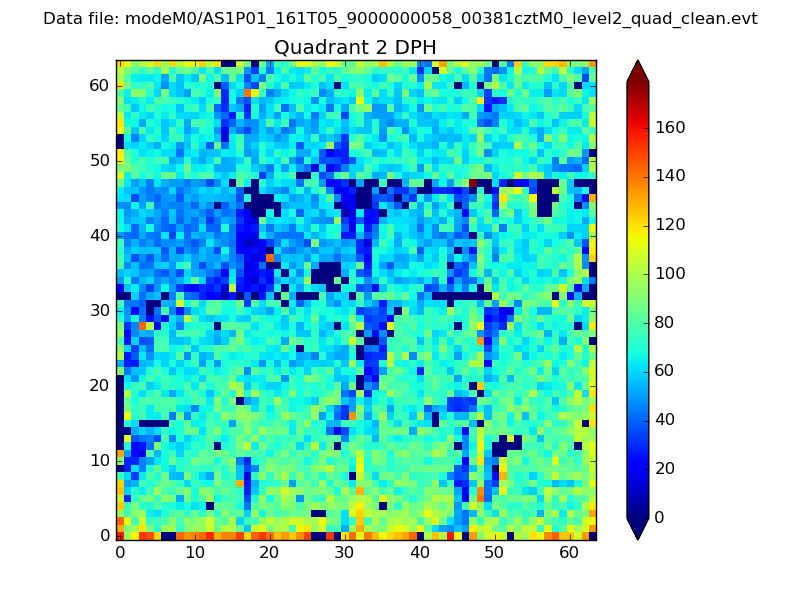
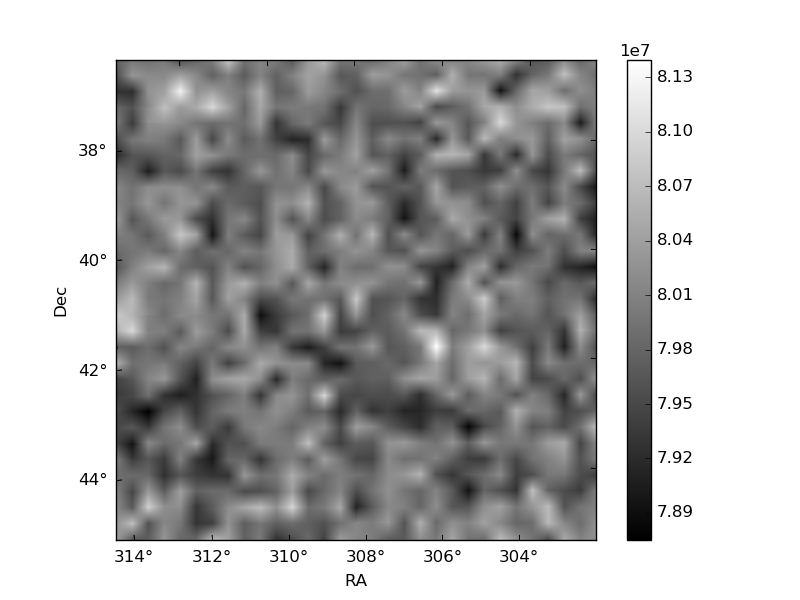
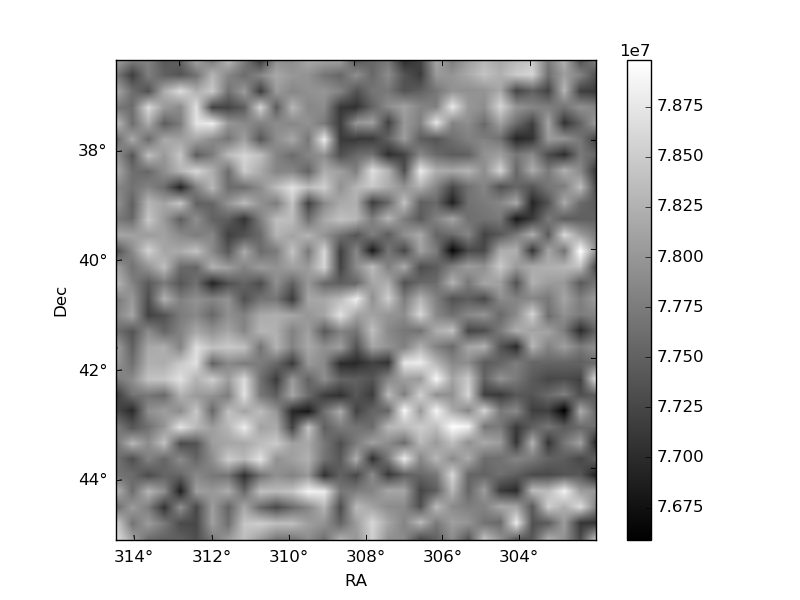
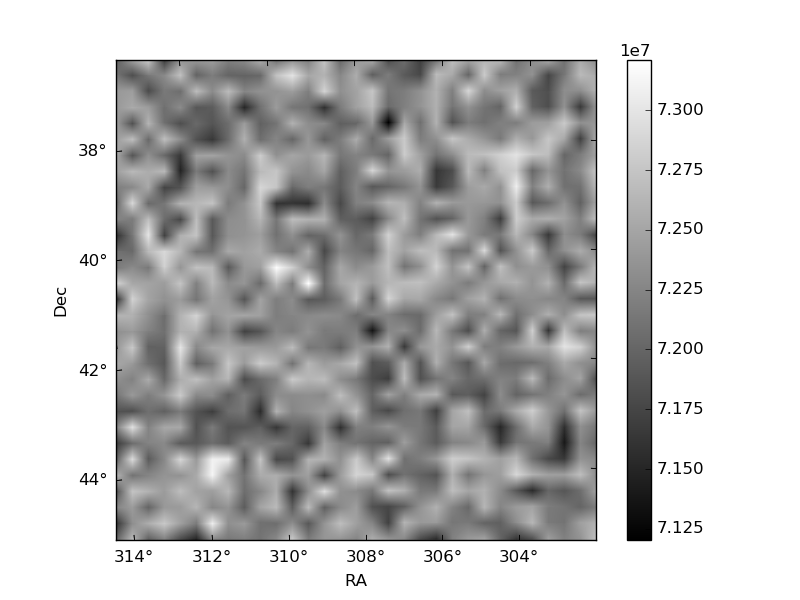
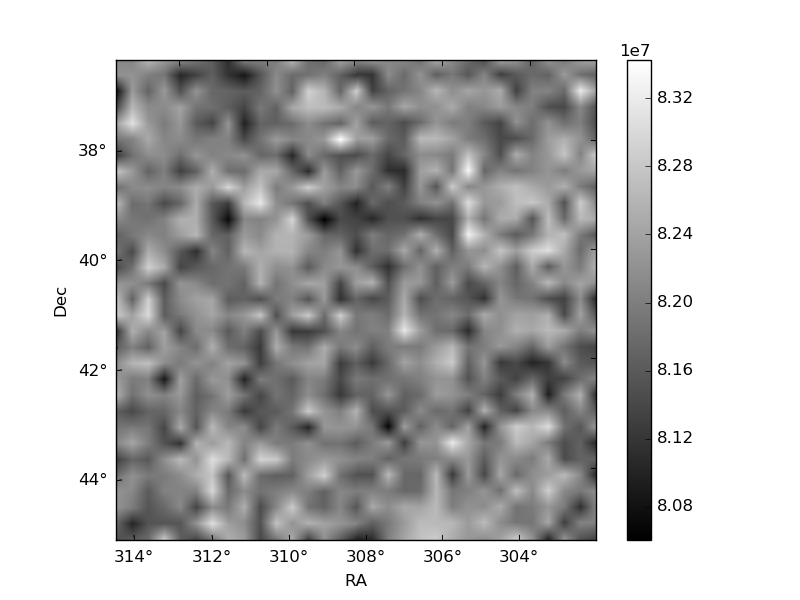
Histogram calculated using DETX and DETY for each event in the final _common_clean file
| Quadrant A | 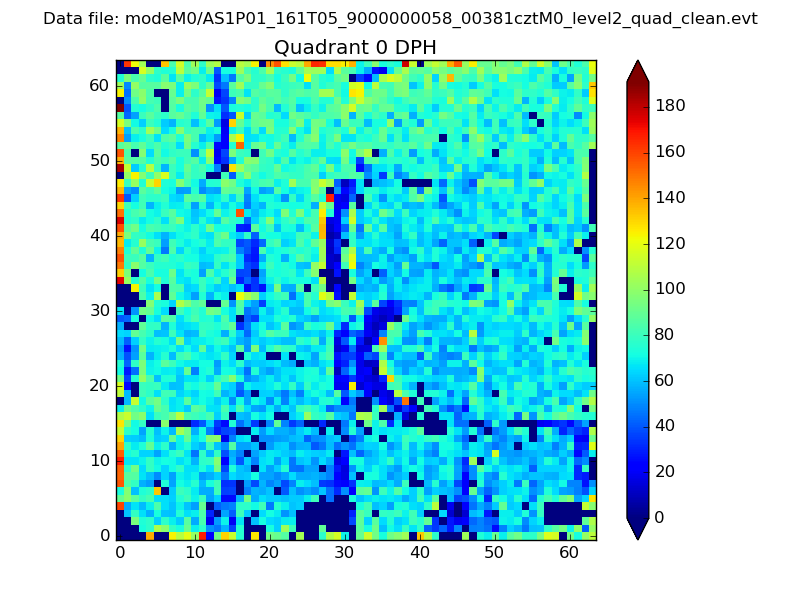 |
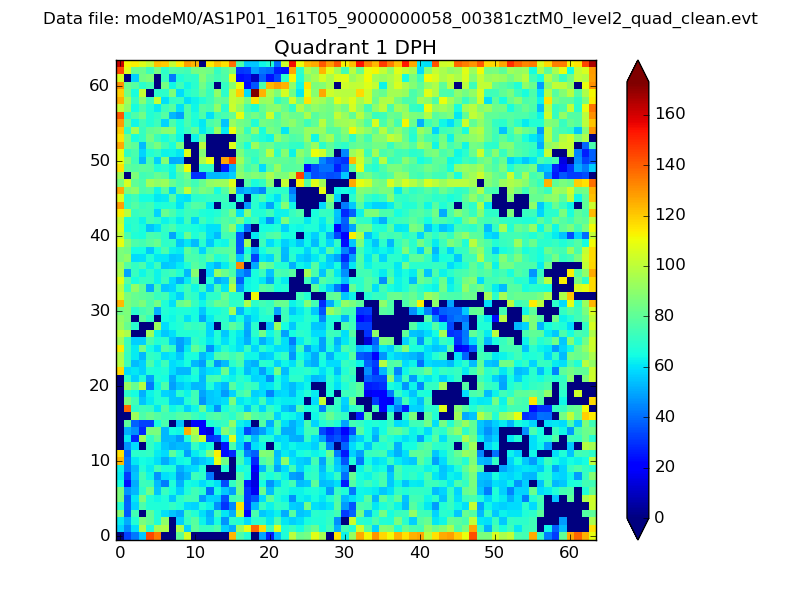 |
Quadrant B |
|---|---|---|---|
| Quadrant D | 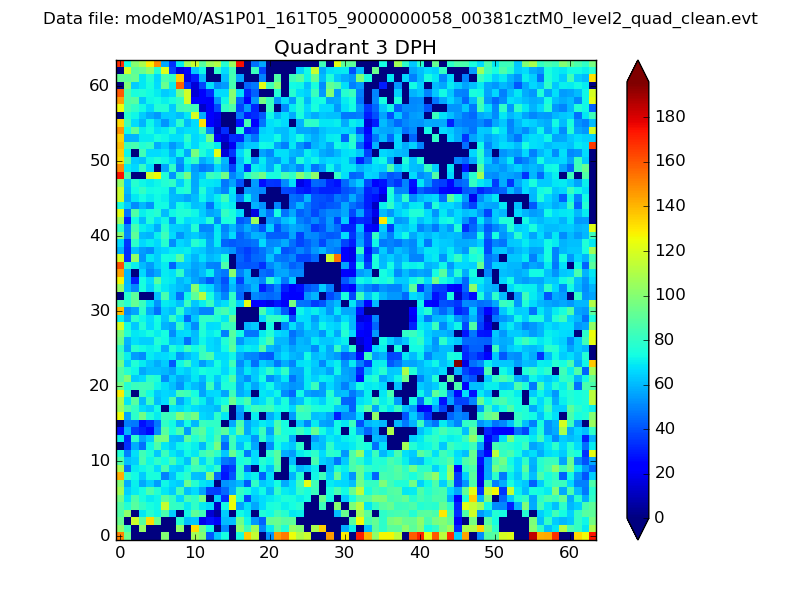 |
 |
Quadrant C |
| Plot type | Count rate plots | Images |
|---|---|---|
| Comparison with Poisson distribution Blue bars denote a histogram of data divided into 1 sec bins. Red curve is a Poisson curve with rate = median count rate of data. |
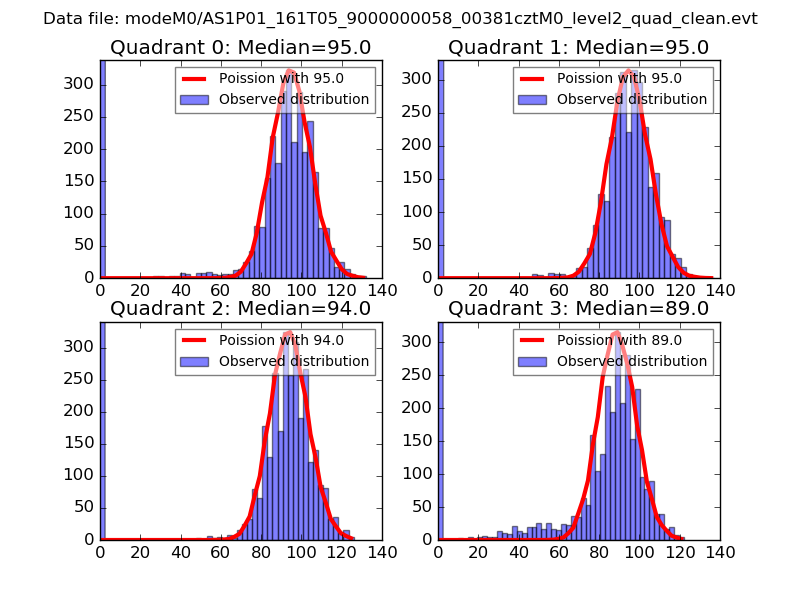 |
 |
| Quadrant-wise count rates Data is divided into 100 sec bins |
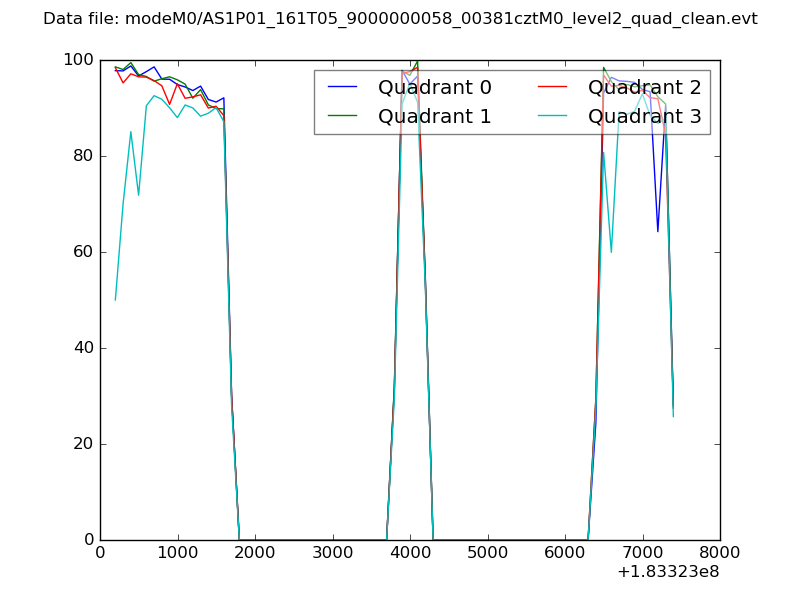 |
|
| Module-wise count rates for Quadrant A Data is divided into 100 sec bins |
 |
 |
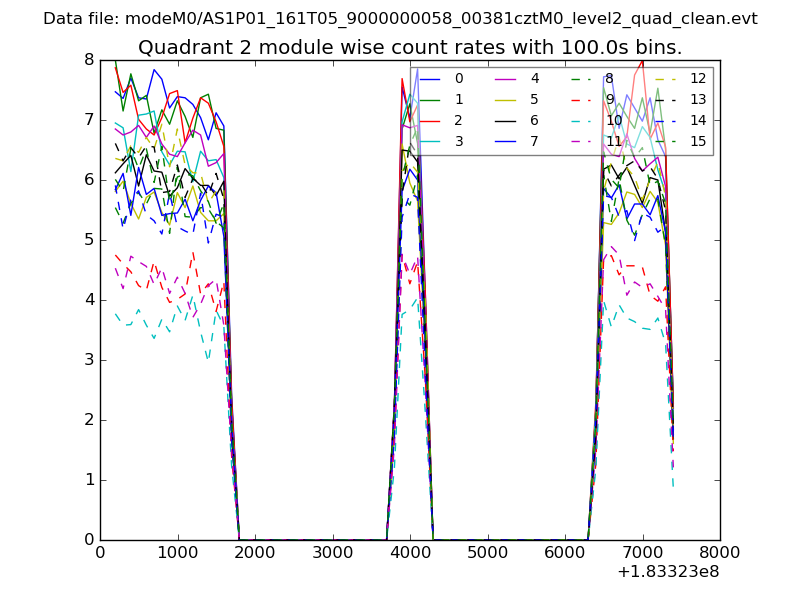
| Module-wise count rates for Quadrant B Data is divided into 100 sec bins |
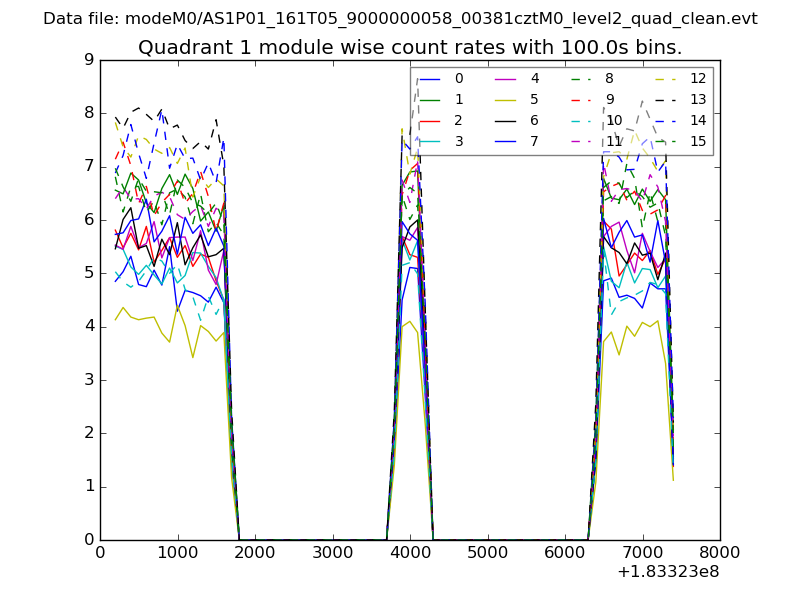 |
 |
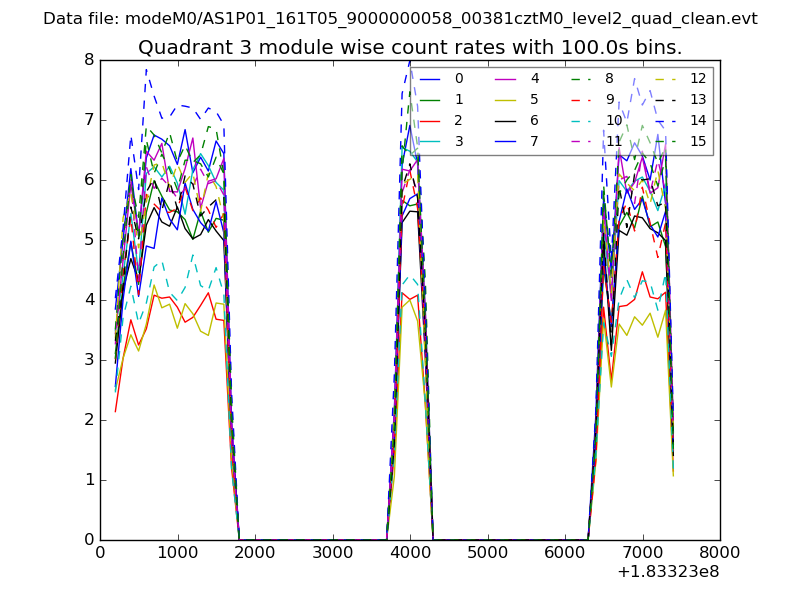
| Module-wise count rates for Quadrant C Data is divided into 100 sec bins |
 |
 |
| Module-wise count rates for Quadrant D Data is divided into 100 sec bins |
 |
 |
| Parameter | Plot |
|---|---|
| CZT HV Monitor |  |
| D_VDD | 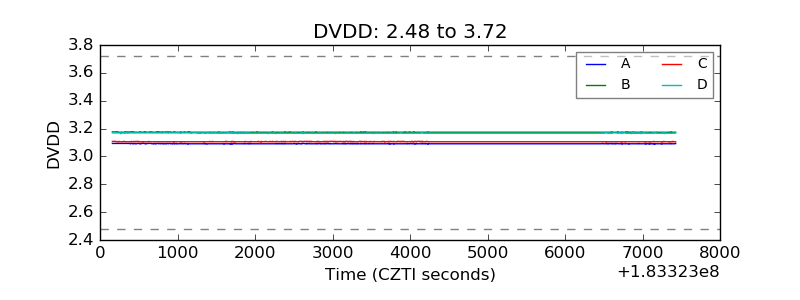 |
| Temperature 1 | 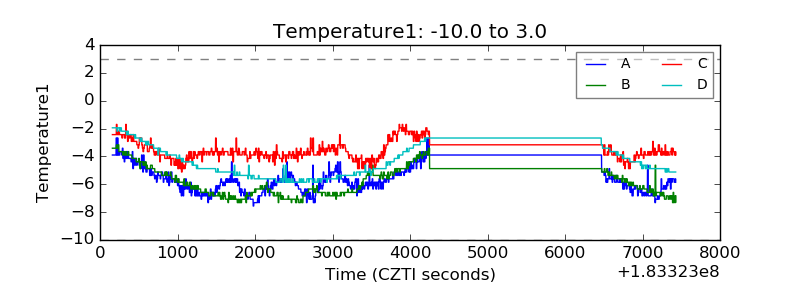 |
| Veto HV Monitor | 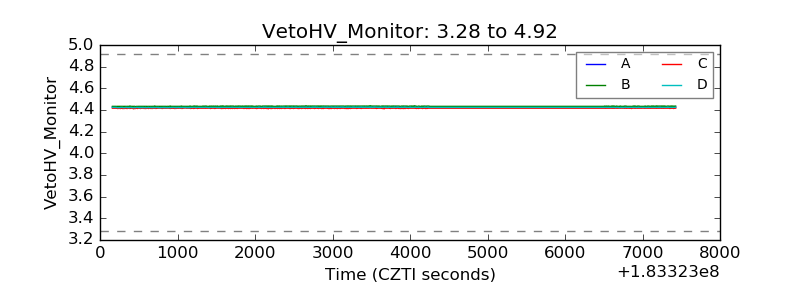 |
| Veto LLD | 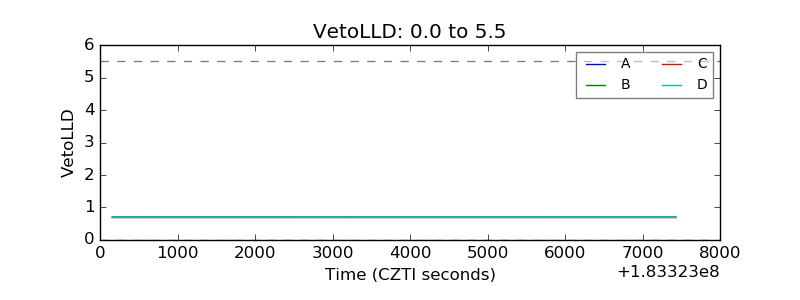 |
| Alpha Counter | 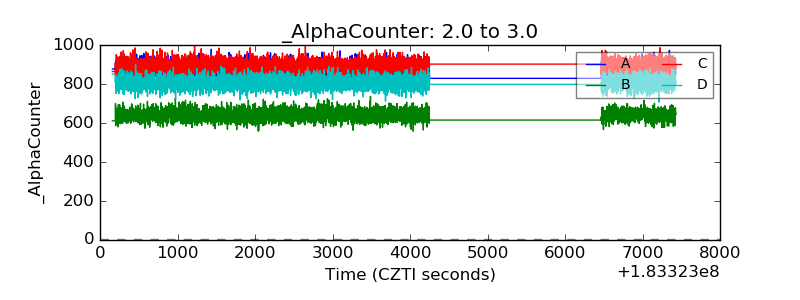 |
| _CPM_Rate | 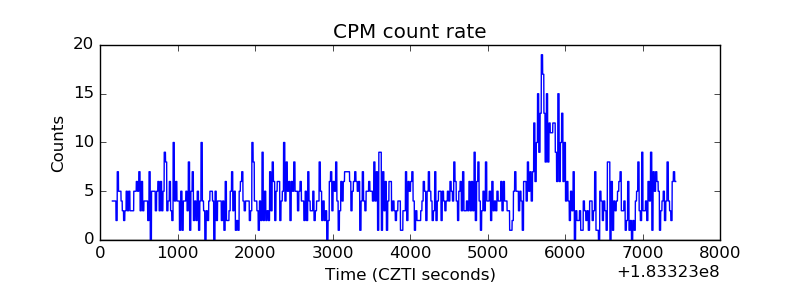 |
| CZT Counter | 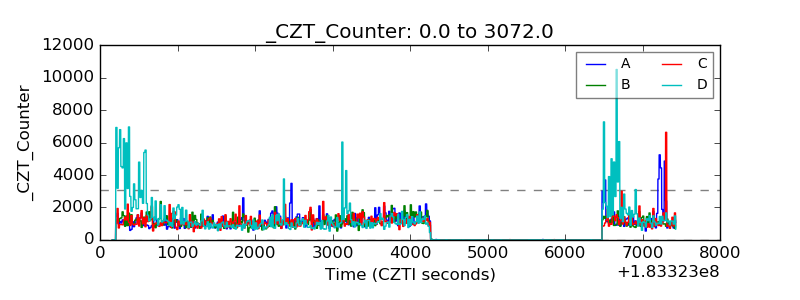 |
| +2.5 Volts monitor |  |
| +5 Volts monitor |  |
| _ROLL_ROT | 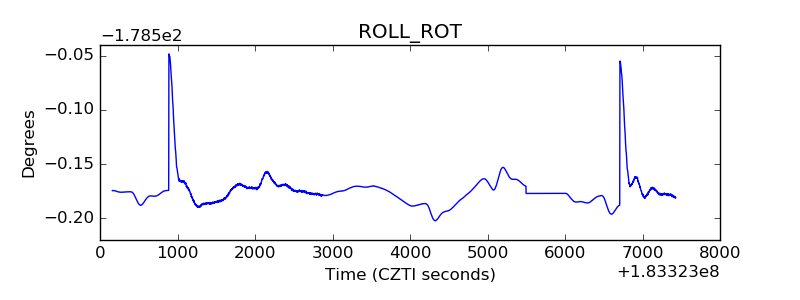 |
| _Roll_DEC | 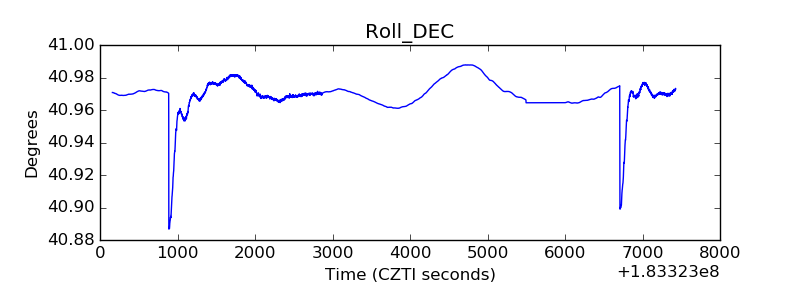 |
| _Roll_RA | 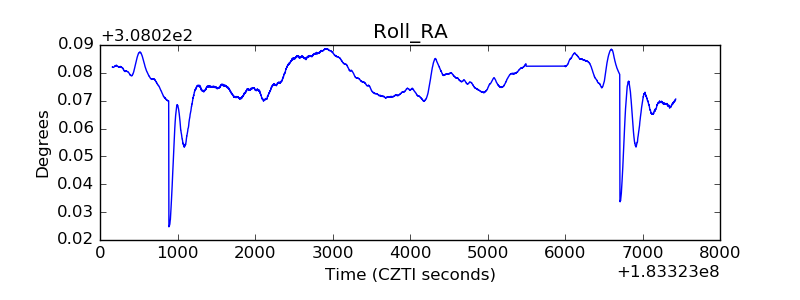 |
| Veto Counter | 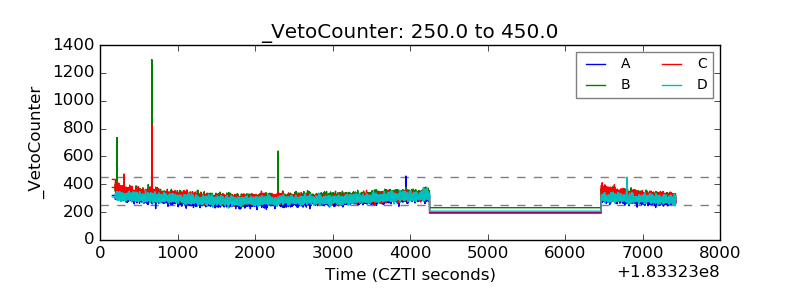 |