| Param | Original file | Final file |
|---|---|---|
| Filename | modeM0/AS1P01_161T05_9000000058_00382cztM0_level2.evt | modeM0/AS1P01_161T05_9000000058_00382cztM0_level2_quad_clean.evt |
| Size (bytes) | 885,778,560 | 40,078,080 |
| Size | 844.7 MB | 38.2 MB |
| Events in quadrant A | 6,702,712 | 222,252 |
| Events in quadrant B | 5,783,992 | 219,471 |
| Events in quadrant C | 5,869,235 | 226,713 |
| Events in quadrant D | 8,134,879 | 190,020 |
| Mode SS | |||
|---|---|---|---|
| Quadrant | BADHDUFLAG | Total packets | Discarded packets |
| A | 0 | 102 | 0 |
| B | 0 | 102 | 0 |
| C | 0 | 102 | 0 |
| D | 0 | 102 | 0 |
| Mode M9 | |||
|---|---|---|---|
| Quadrant | BADHDUFLAG | Total packets | Discarded packets |
| A | 0 | 26 | 0 |
| B | 0 | 26 | 0 |
| C | 0 | 26 | 0 |
| D | 0 | 27 | 0 |
| Mode M0 | |||
|---|---|---|---|
| Quadrant | BADHDUFLAG | Total packets | Discarded packets |
| A | 0 | 23541 | 3 |
| B | 0 | 20770 | 2 |
| C | 0 | 21047 | 2 |
| D | 0 | 27830 | 2 |
| Quadrant | Total seconds | Saturated seconds | Saturation percentage |
|---|---|---|---|
| A | 5054 | 202 | 3.996834% |
| B | 5054 | 3 | 0.059359% |
| C | 5054 | 30 | 0.593589% |
| D | 5054 | 668 | 13.217254% |
Noise dominated data is calculated using 1-second bins in cleaned event files. If a bin has >2000 counts, and if more than 50% of those come from <1% of pixels, then it is considered to be noise-dominated and hence unusable.
| Quadrant | # 1 sec bins | Bins with >0 counts | Bins with >2000 counts | High rate bins dominated by noise | Noise dominated (total time) | Noise dominated (detector-on time) | Marked lightcurve |
|---|---|---|---|---|---|---|---|
| A | 7268 | 5055 | 466 | 466 | 6.41% | 9.22% | 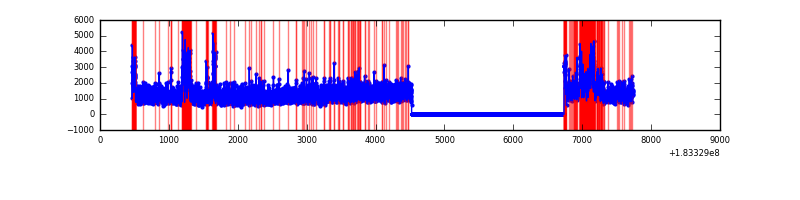 |
| B | 7268 | 5055 | 40 | 40 | 0.55% | 0.79% | 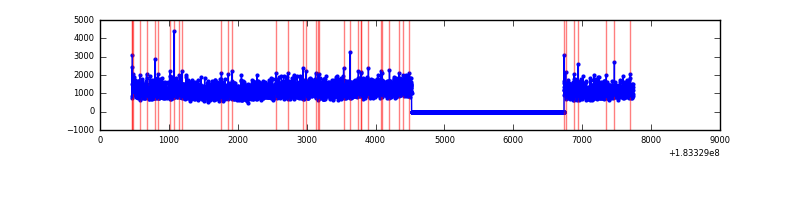 |
| C | 7268 | 5055 | 145 | 145 | 2.00% | 2.87% | 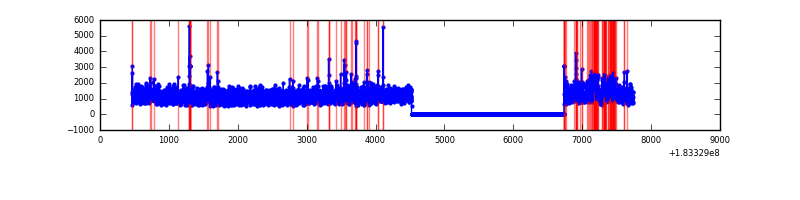 |
| D | 7268 | 5055 | 1187 | 1187 | 16.33% | 23.48% | 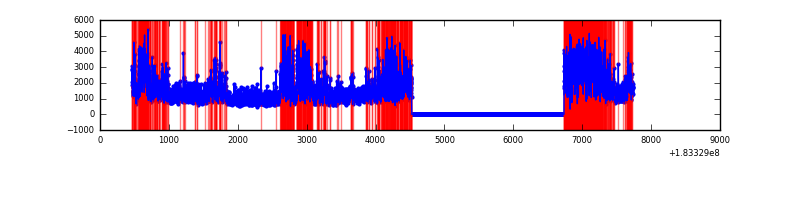 |
Top three noisy pixels from each quadrant. If the there are fewer than three noisy pixels in the level2.evt file, extra rows are filled as -1
| Pixel properties | Quadrant properties | ||||||
|---|---|---|---|---|---|---|---|
| Quadrant | DetID | PixID | Counts | Sigma | Mean | Median | Sigma |
| A | 0 | 69 | 955148 | 2918.8 | 1458 | 1444 | 326.7 |
| A | 0 | 238 | 53043 | 157.92 | 1458 | 1444 | 326.7 |
| A | 12 | 243 | 23655 | 67.98 | 1458 | 1444 | 326.7 |
| B | 15 | 82 | 14910 | 37.94 | 1495 | 1504 | 353.3 |
| B | 7 | 221 | 12362 | 30.73 | 1495 | 1504 | 353.3 |
| B | 0 | 182 | 12050 | 29.85 | 1495 | 1504 | 353.3 |
| C | 1 | 1 | 290266 | 761.66 | 1356 | 1403 | 379.3 |
| C | 3 | 159 | 170501 | 445.87 | 1356 | 1403 | 379.3 |
| C | 5 | 234 | 43810 | 111.82 | 1356 | 1403 | 379.3 |
| D | 13 | 7 | 2929875 | 7623.54 | 1222 | 1267 | 384.2 |
| D | 12 | 237 | 168612 | 435.62 | 1222 | 1267 | 384.2 |
| D | 1 | 5 | 102002 | 262.22 | 1222 | 1267 | 384.2 |
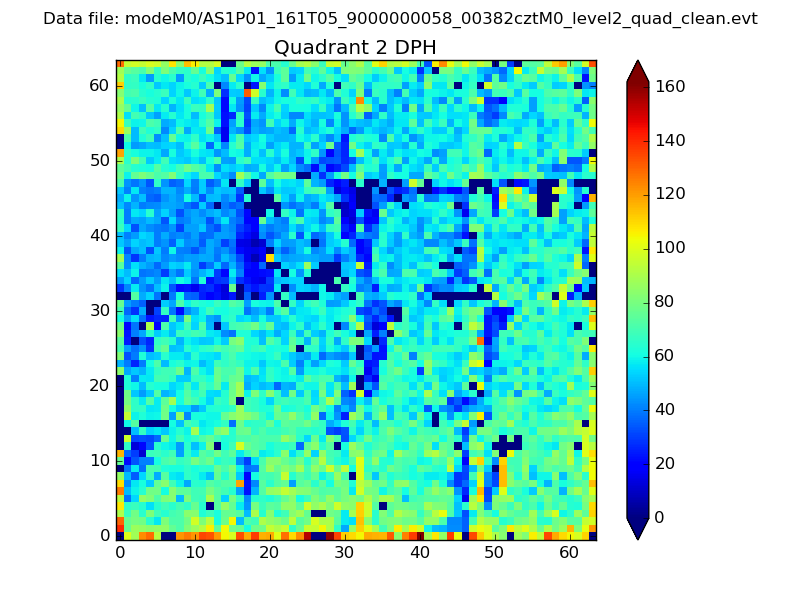
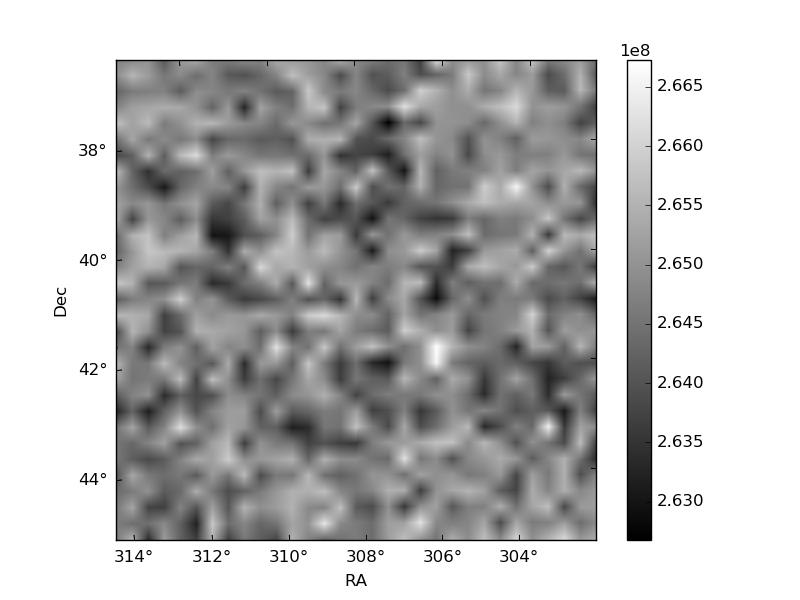
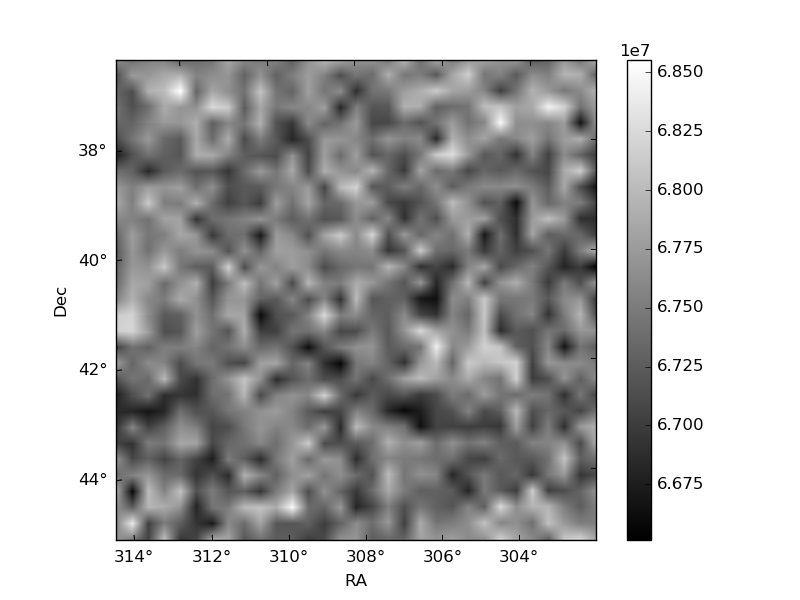
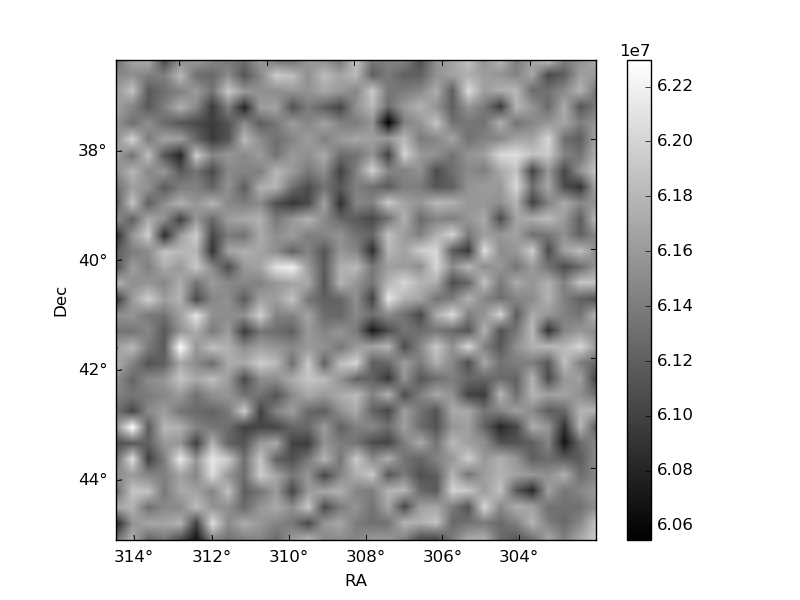
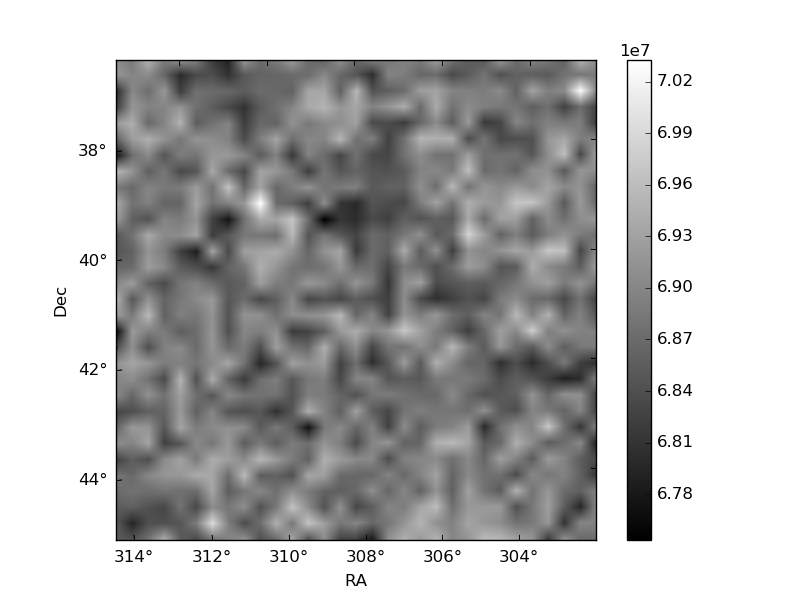
Histogram calculated using DETX and DETY for each event in the final _common_clean file
| Quadrant A | 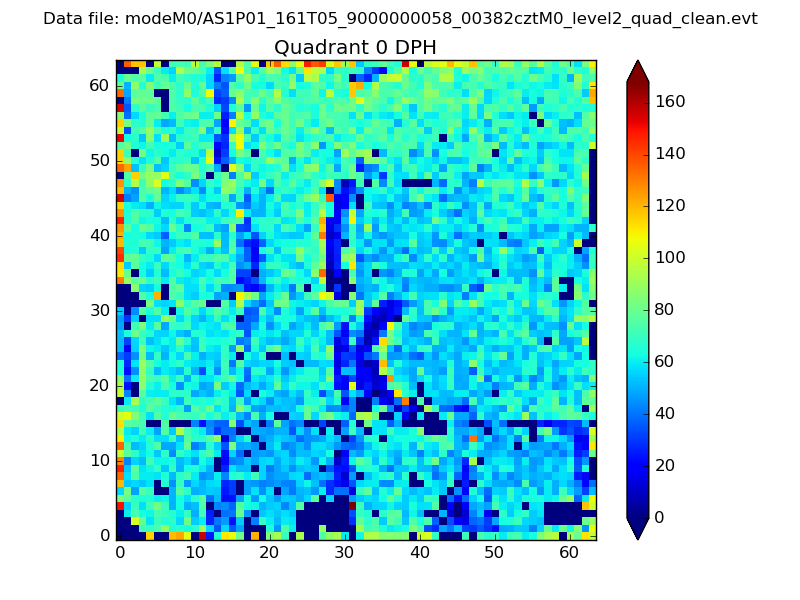 |
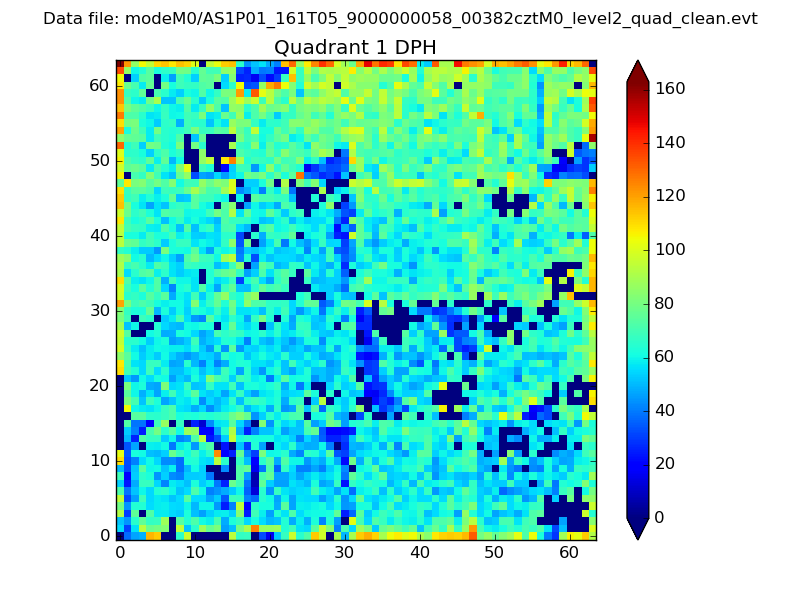 |
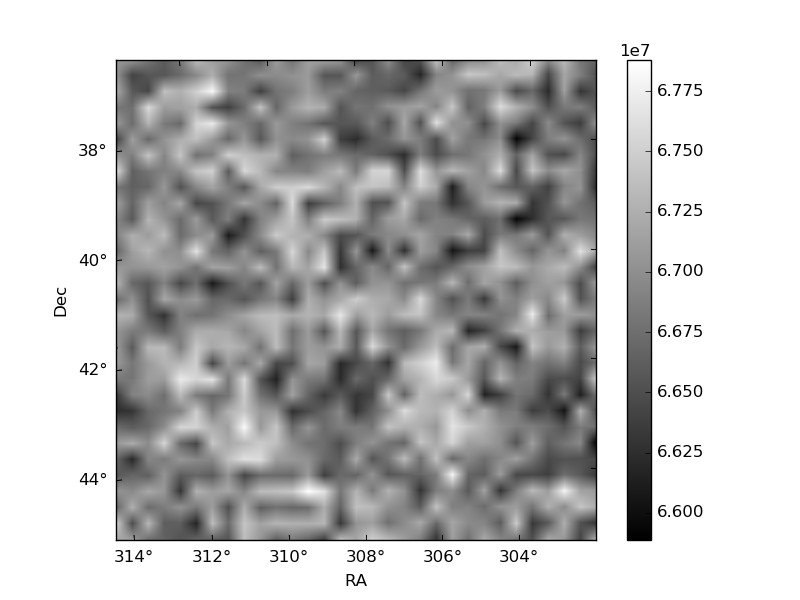
Quadrant B |
|---|---|---|---|
| Quadrant D | 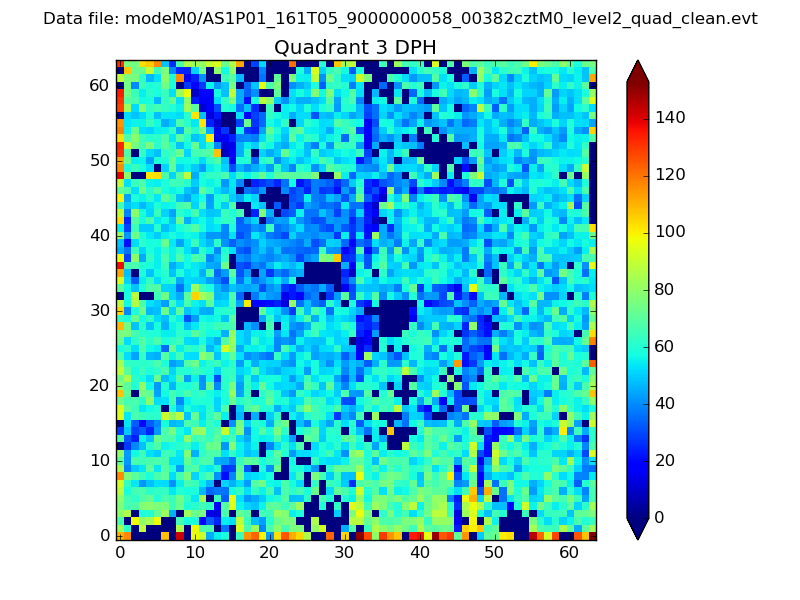 |
 |
Quadrant C |
| Plot type | Count rate plots | Images |
|---|---|---|
| Comparison with Poisson distribution Blue bars denote a histogram of data divided into 1 sec bins. Red curve is a Poisson curve with rate = median count rate of data. |
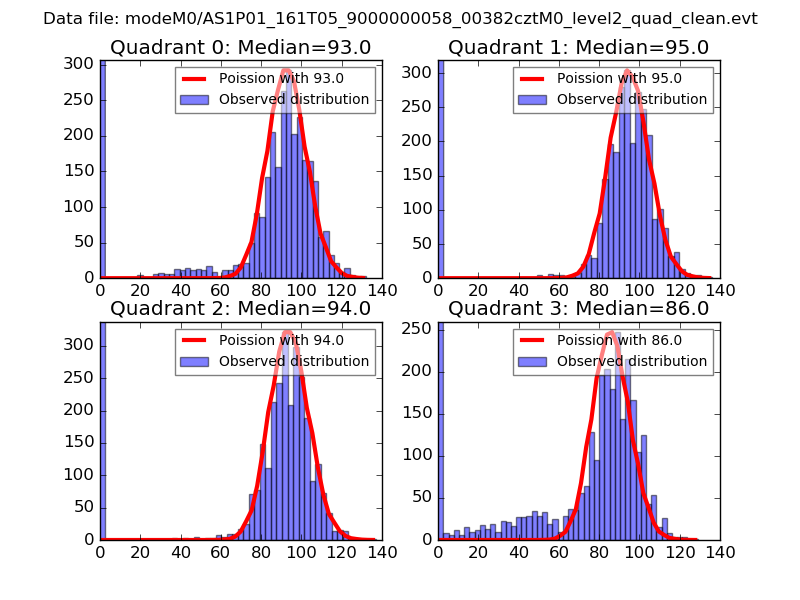 |
 |
| Quadrant-wise count rates Data is divided into 100 sec bins |
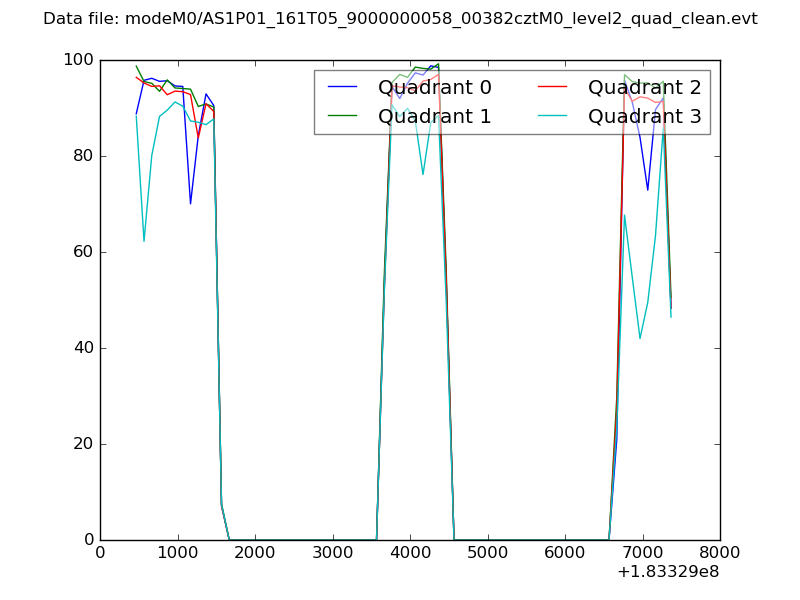 |
|
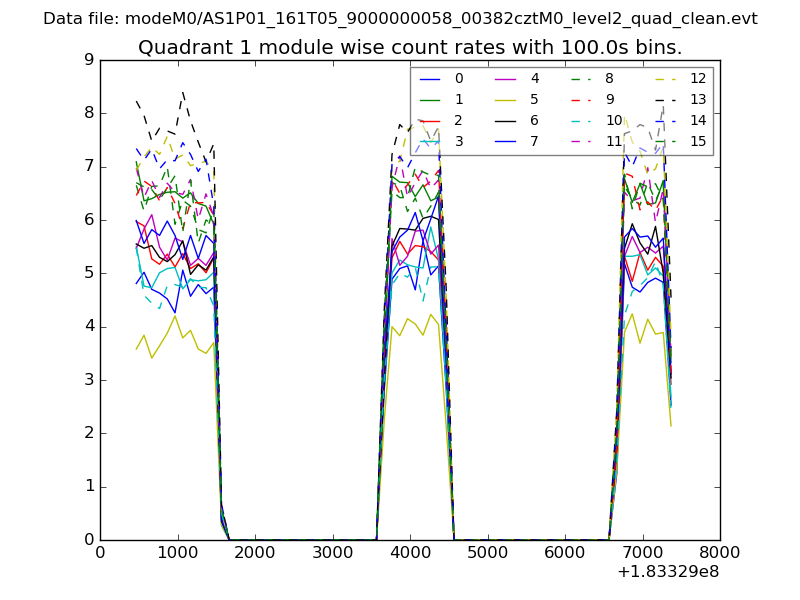
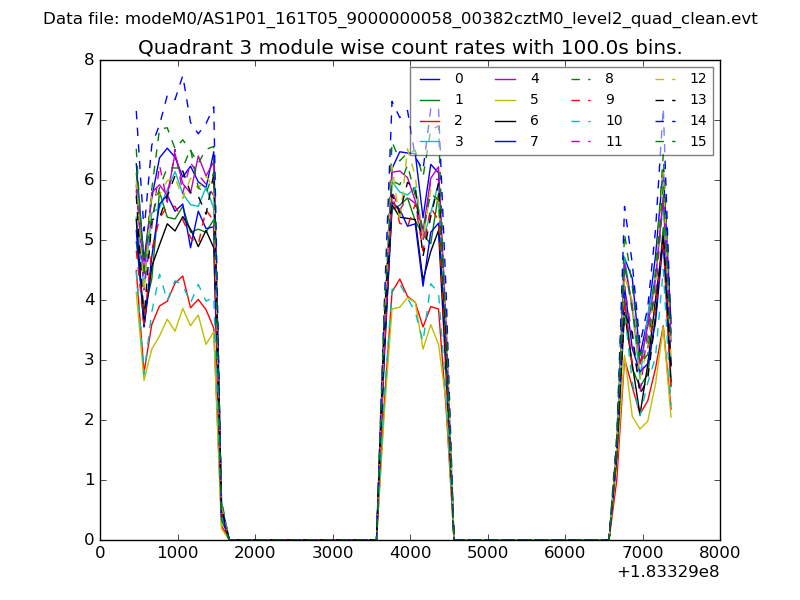
| Module-wise count rates for Quadrant A Data is divided into 100 sec bins |
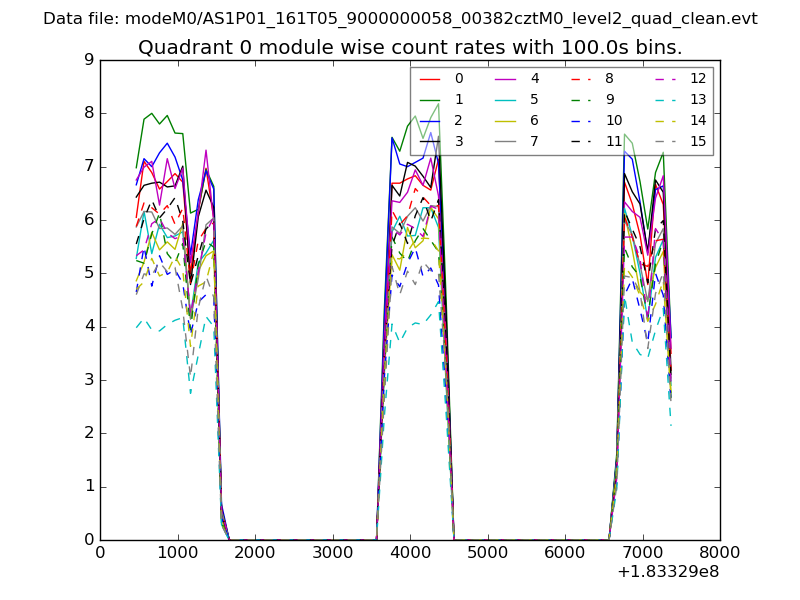 |
 |
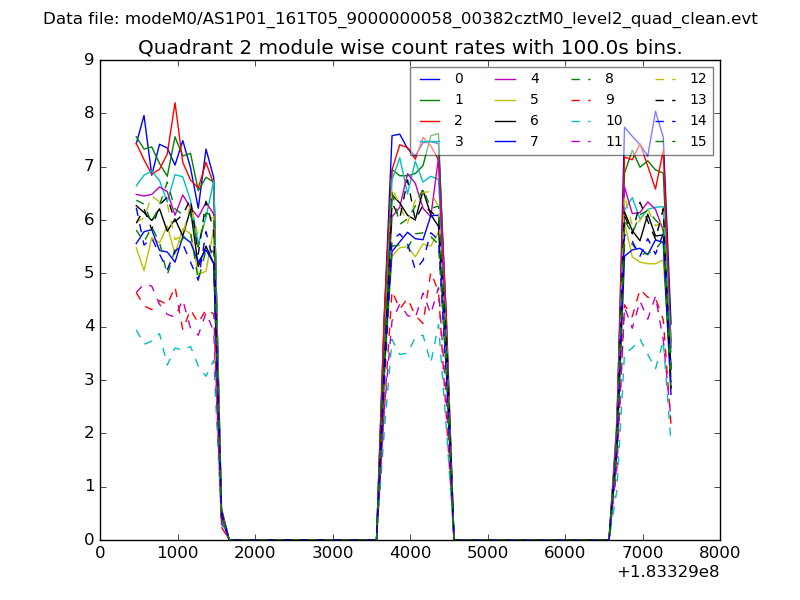
| Module-wise count rates for Quadrant B Data is divided into 100 sec bins |
 |
 |
| Module-wise count rates for Quadrant C Data is divided into 100 sec bins |
 |
 |
| Module-wise count rates for Quadrant D Data is divided into 100 sec bins |
 |
 |
| Parameter | Plot |
|---|---|
| CZT HV Monitor | 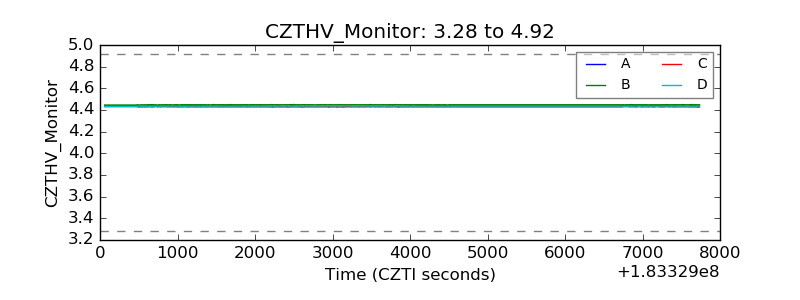 |
| D_VDD | 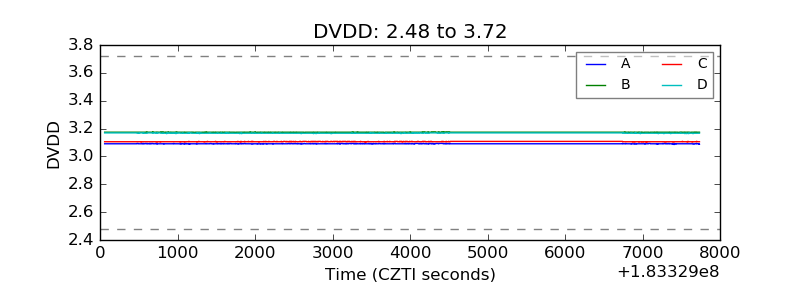 |
| Temperature 1 |  |
| Veto HV Monitor | 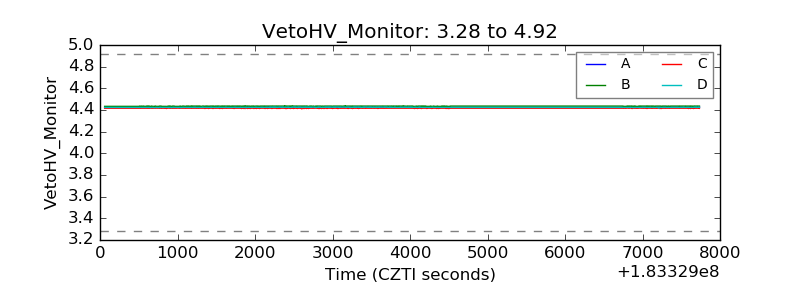 |
| Veto LLD | 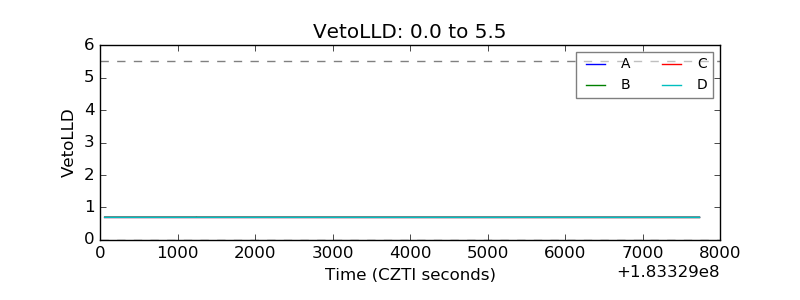 |
| Alpha Counter | 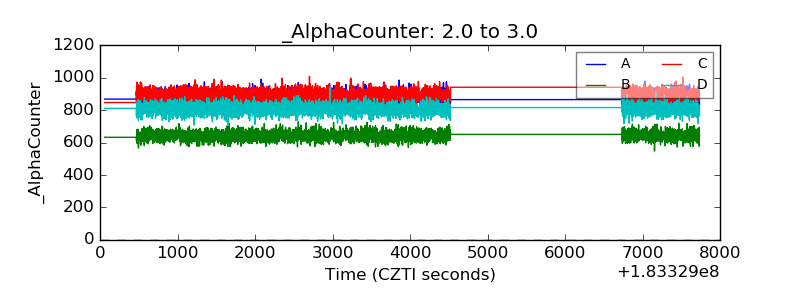 |
| _CPM_Rate | 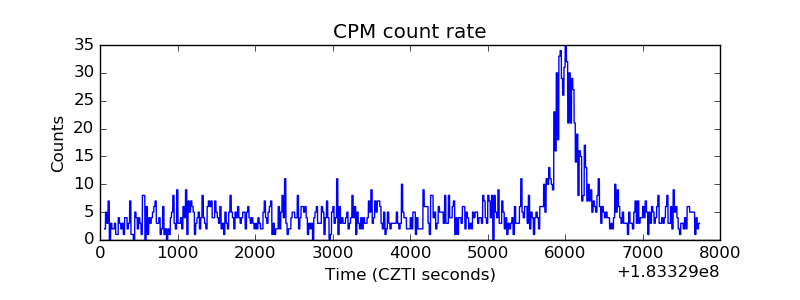 |
| CZT Counter | 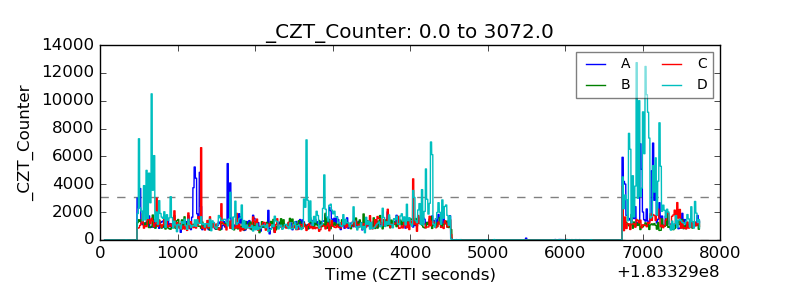 |
| +2.5 Volts monitor |  |
| +5 Volts monitor |  |
| _ROLL_ROT | 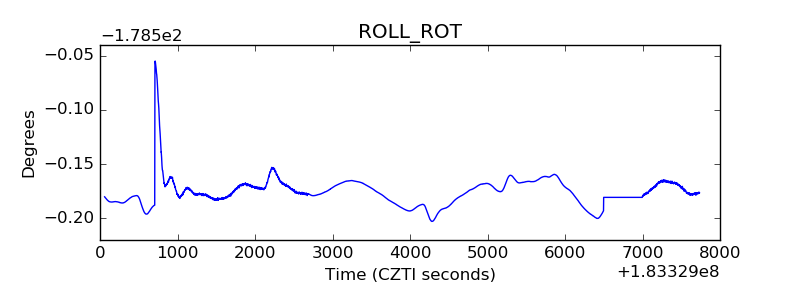 |
| _Roll_DEC | 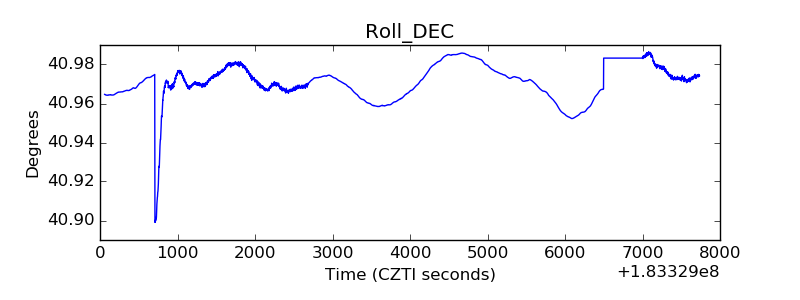 |
| _Roll_RA | 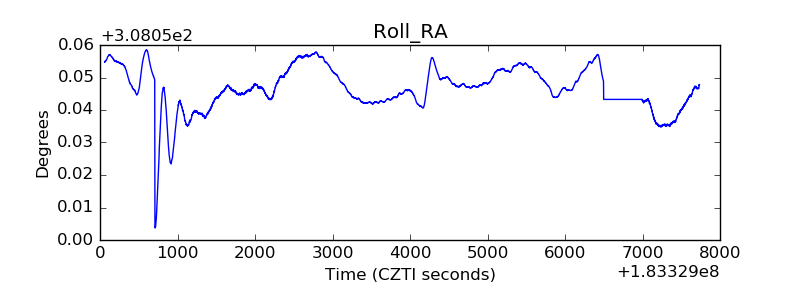 |
| Veto Counter | 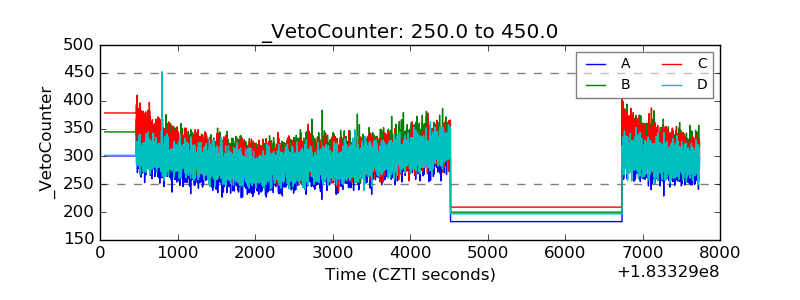 |