| Param | Original file | Final file |
|---|---|---|
| Filename | modeM0/AS1P01_161T05_9000000058_00384cztM0_level2.evt | modeM0/AS1P01_161T05_9000000058_00384cztM0_level2_quad_clean.evt |
| Size (bytes) | 963,472,320 | 34,084,800 |
| Size | 918.8 MB | 32.5 MB |
| Events in quadrant A | 6,727,133 | 176,547 |
| Events in quadrant B | 6,527,845 | 172,792 |
| Events in quadrant C | 7,483,820 | 180,271 |
| Events in quadrant D | 8,088,015 | 128,978 |
| Mode SS | |||
|---|---|---|---|
| Quadrant | BADHDUFLAG | Total packets | Discarded packets |
| A | 0 | 108 | 0 |
| B | 0 | 108 | 0 |
| C | 0 | 108 | 0 |
| D | 0 | 108 | 0 |
| Mode M9 | |||
|---|---|---|---|
| Quadrant | BADHDUFLAG | Total packets | Discarded packets |
| A | 0 | 21 | 0 |
| B | 0 | 21 | 0 |
| C | 0 | 21 | 0 |
| D | 0 | 22 | 0 |
| Mode M0 | |||
|---|---|---|---|
| Quadrant | BADHDUFLAG | Total packets | Discarded packets |
| A | 0 | 23767 | 3 |
| B | 0 | 23171 | 2 |
| C | 0 | 25965 | 2 |
| D | 0 | 27893 | 2 |
| Quadrant | Total seconds | Saturated seconds | Saturation percentage |
|---|---|---|---|
| A | 5323 | 77 | 1.446553% |
| B | 5323 | 10 | 0.187864% |
| C | 5323 | 65 | 1.221116% |
| D | 5323 | 486 | 9.130190% |
Noise dominated data is calculated using 1-second bins in cleaned event files. If a bin has >2000 counts, and if more than 50% of those come from <1% of pixels, then it is considered to be noise-dominated and hence unusable.
| Quadrant | # 1 sec bins | Bins with >0 counts | Bins with >2000 counts | High rate bins dominated by noise | Noise dominated (total time) | Noise dominated (detector-on time) | Marked lightcurve |
|---|---|---|---|---|---|---|---|
| A | 7387 | 5324 | 240 | 240 | 3.25% | 4.51% |  |
| B | 7387 | 5324 | 96 | 96 | 1.30% | 1.80% |  |
| C | 7387 | 5324 | 837 | 837 | 11.33% | 15.72% | 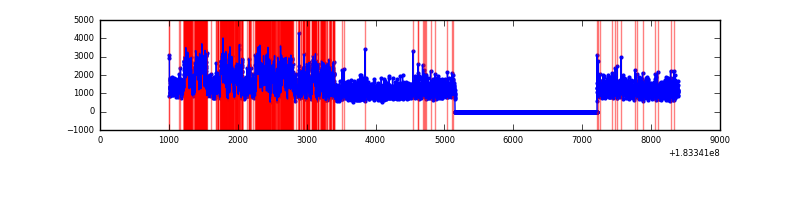 |
| D | 7387 | 5324 | 998 | 998 | 13.51% | 18.75% | 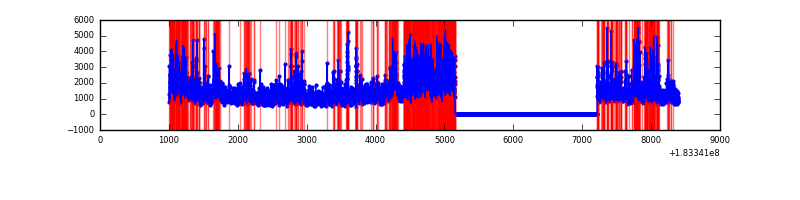 |
Top three noisy pixels from each quadrant. If the there are fewer than three noisy pixels in the level2.evt file, extra rows are filled as -1
| Pixel properties | Quadrant properties | ||||||
|---|---|---|---|---|---|---|---|
| Quadrant | DetID | PixID | Counts | Sigma | Mean | Median | Sigma |
| A | 0 | 69 | 267384 | 726.39 | 1629 | 1615 | 365.9 |
| A | 0 | 238 | 69664 | 185.99 | 1629 | 1615 | 365.9 |
| A | 12 | 243 | 37498 | 98.07 | 1629 | 1615 | 365.9 |
| B | 15 | 82 | 42428 | 103.76 | 1641 | 1652 | 393.0 |
| B | 0 | 23 | 41746 | 102.02 | 1641 | 1652 | 393.0 |
| B | 4 | 170 | 35066 | 85.03 | 1641 | 1652 | 393.0 |
| C | 1 | 1 | 1515805 | 3664.57 | 1472 | 1523 | 413.2 |
| C | 3 | 159 | 173741 | 416.77 | 1472 | 1523 | 413.2 |
| C | 9 | 98 | 7155 | 13.63 | 1472 | 1523 | 413.2 |
| D | 13 | 7 | 2055544 | 4995.56 | 1380 | 1414 | 411.2 |
| D | 10 | 102 | 291804 | 706.22 | 1380 | 1414 | 411.2 |
| D | 1 | 5 | 117950 | 283.41 | 1380 | 1414 | 411.2 |
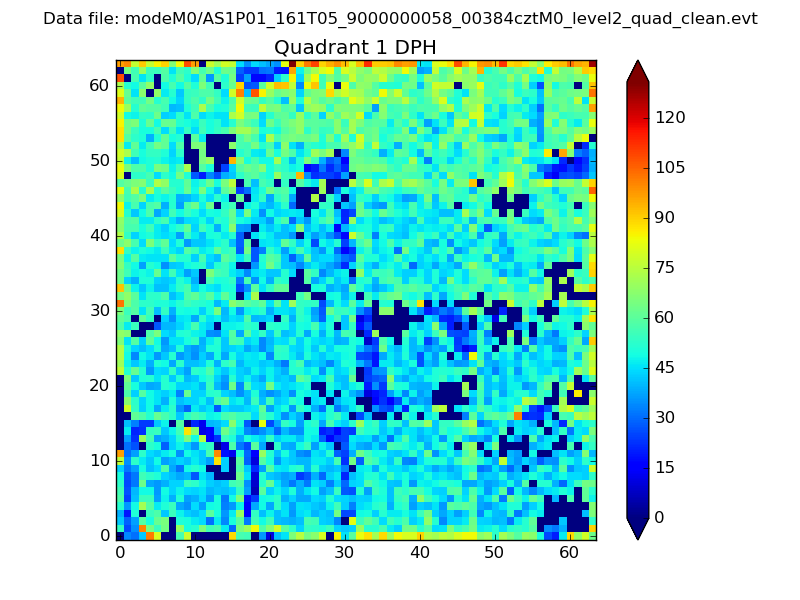
Histogram calculated using DETX and DETY for each event in the final _common_clean file
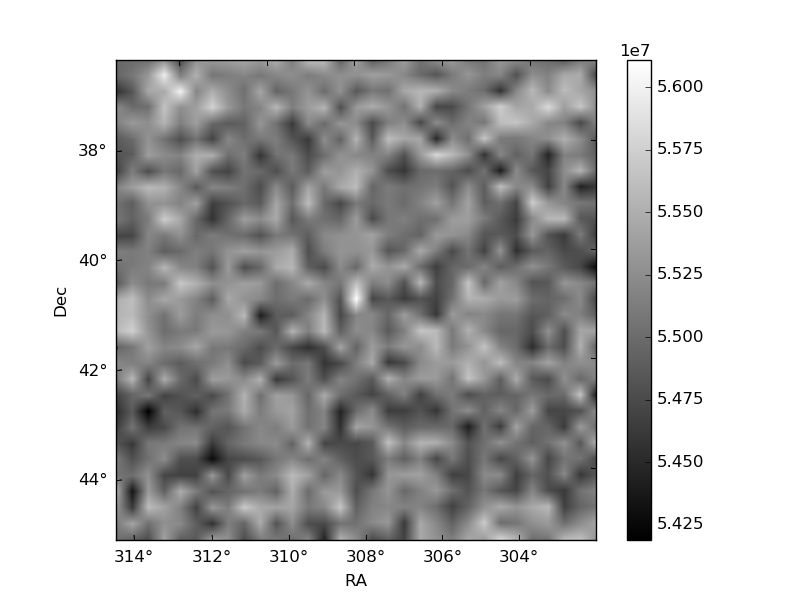
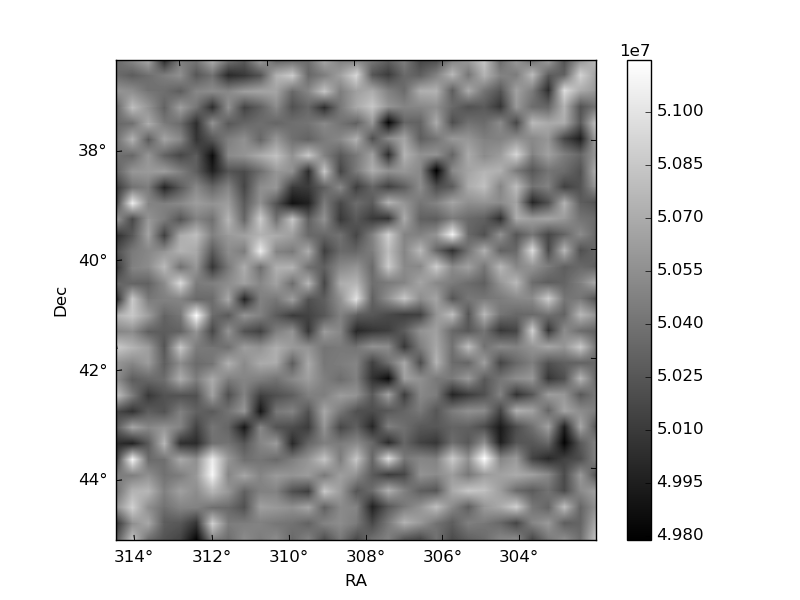
| Quadrant A |  |
 |
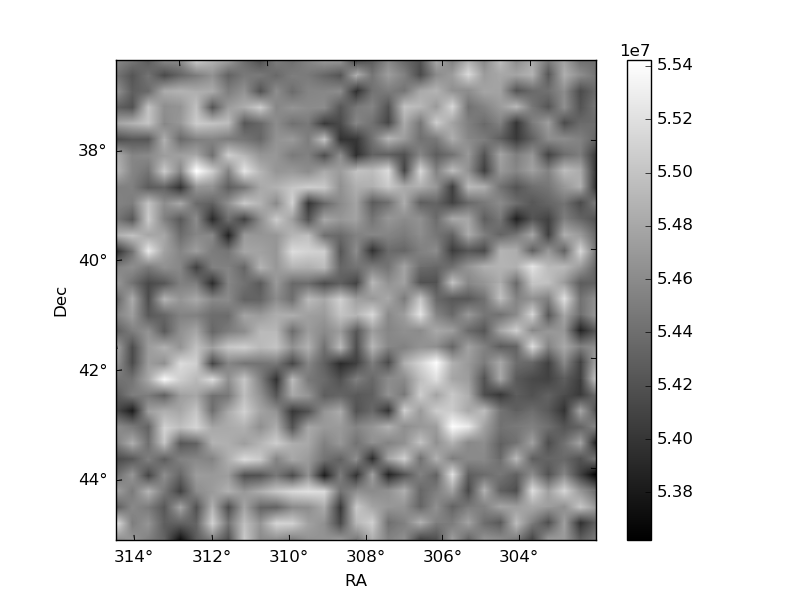
Quadrant B |
|---|---|---|---|
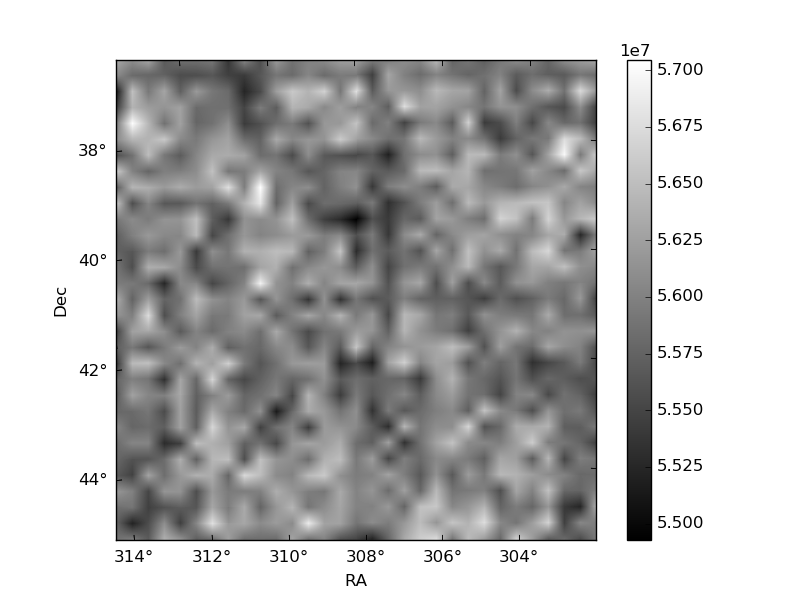
| Quadrant D | 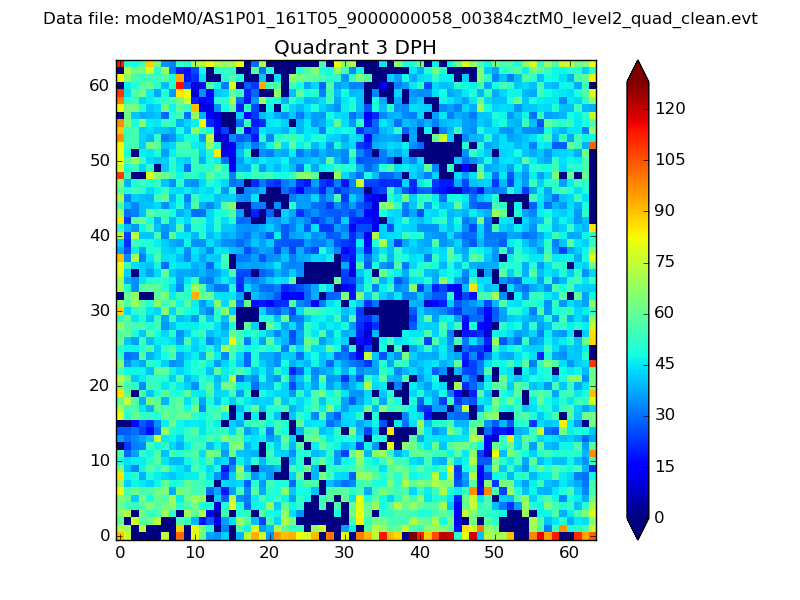 |
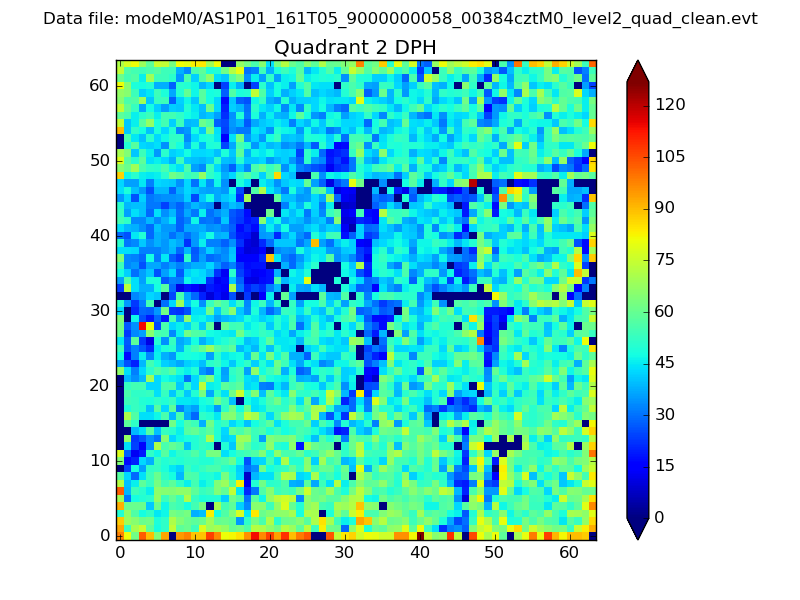 |
Quadrant C |
| Plot type | Count rate plots | Images |
|---|---|---|
| Comparison with Poisson distribution Blue bars denote a histogram of data divided into 1 sec bins. Red curve is a Poisson curve with rate = median count rate of data. |
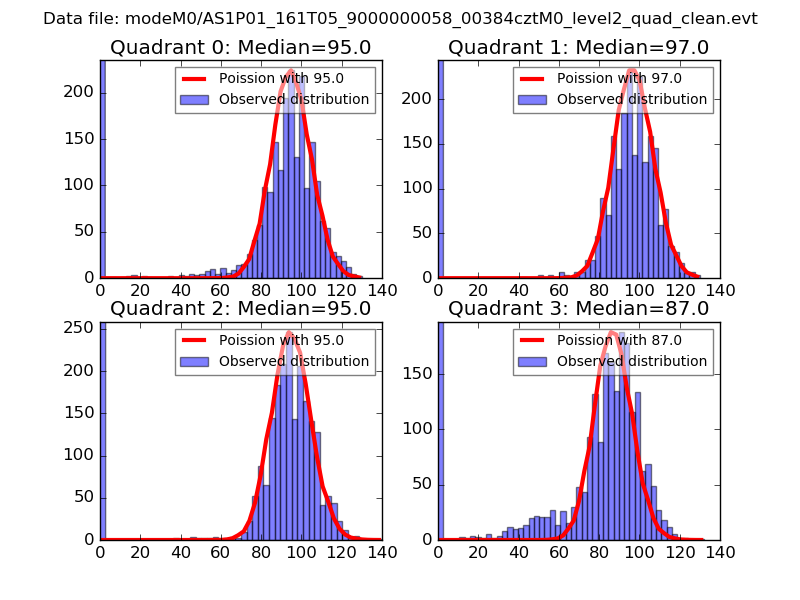 |
 |
| Quadrant-wise count rates Data is divided into 100 sec bins |
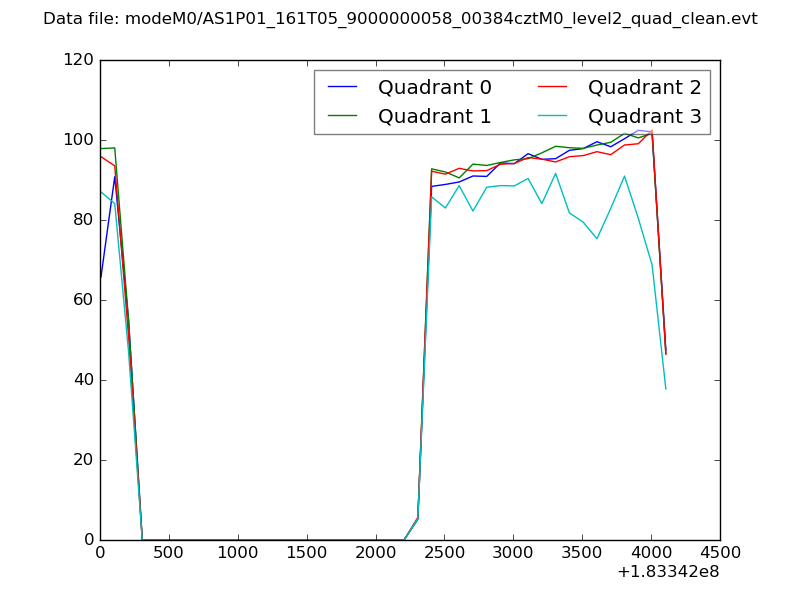 |
|
| Module-wise count rates for Quadrant A Data is divided into 100 sec bins |
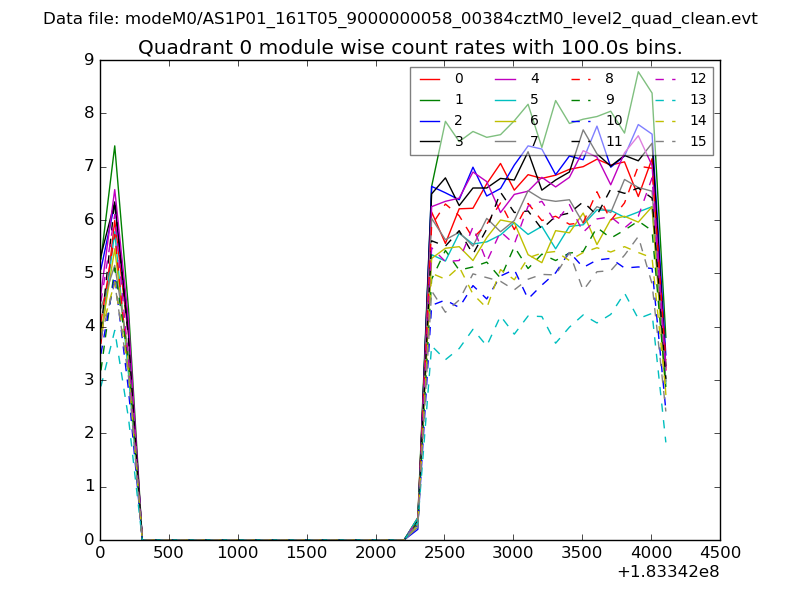 |
 |
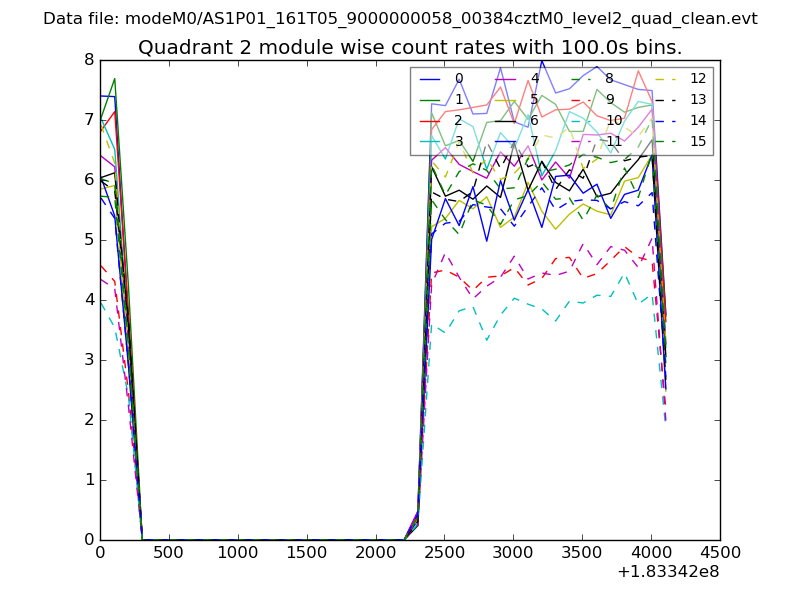
| Module-wise count rates for Quadrant B Data is divided into 100 sec bins |
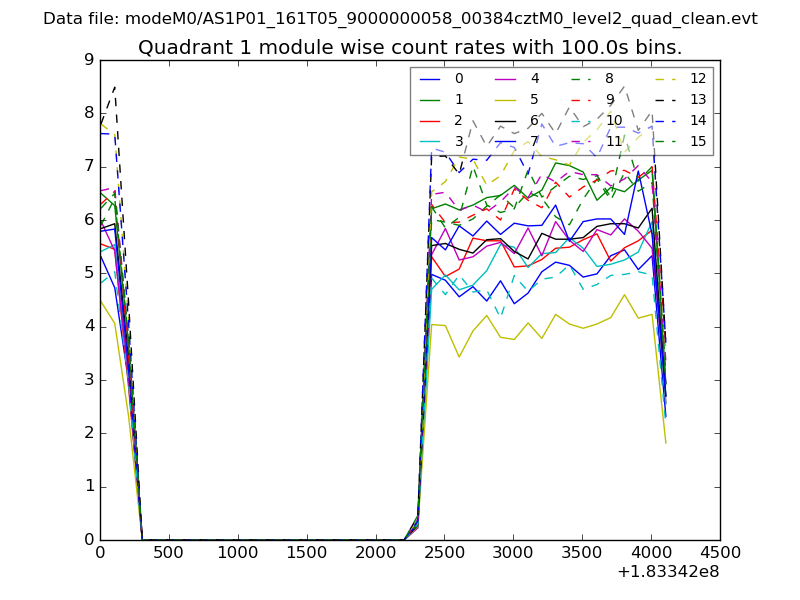 |
 |
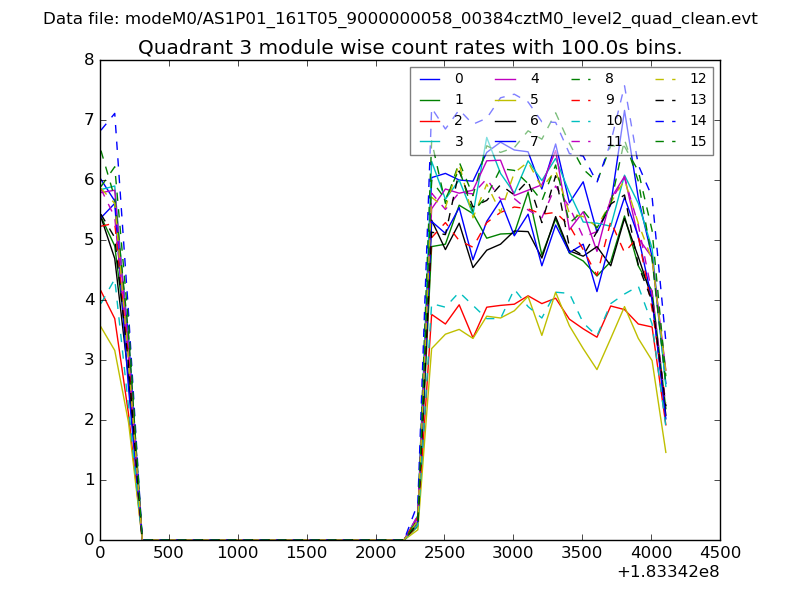
| Module-wise count rates for Quadrant C Data is divided into 100 sec bins |
 |
 |
| Module-wise count rates for Quadrant D Data is divided into 100 sec bins |
 |
 |
| Parameter | Plot |
|---|---|
| CZT HV Monitor | 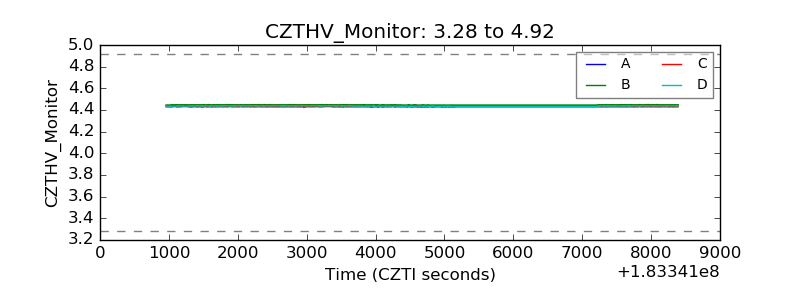 |
| D_VDD | 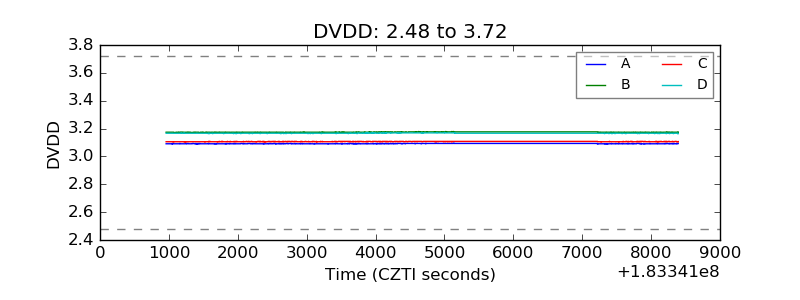 |
| Temperature 1 | 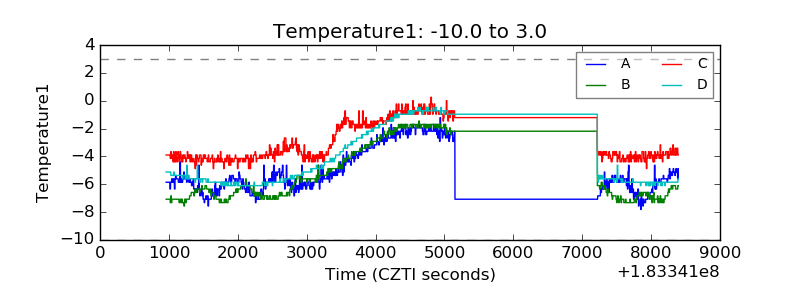 |
| Veto HV Monitor | 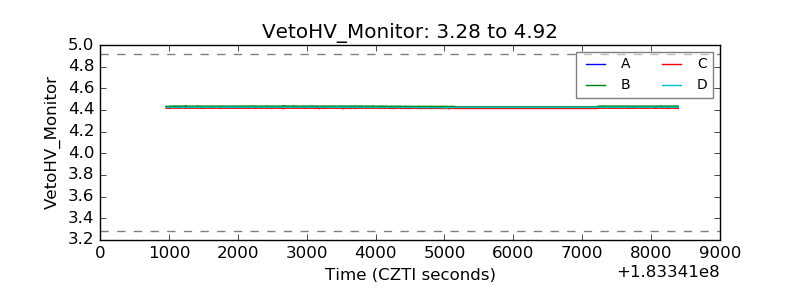 |
| Veto LLD |  |
| Alpha Counter | 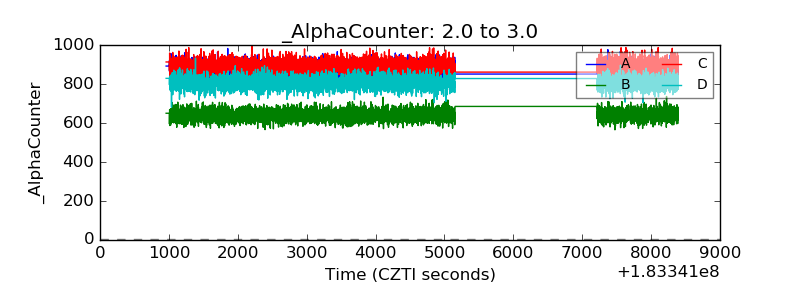 |
| _CPM_Rate | 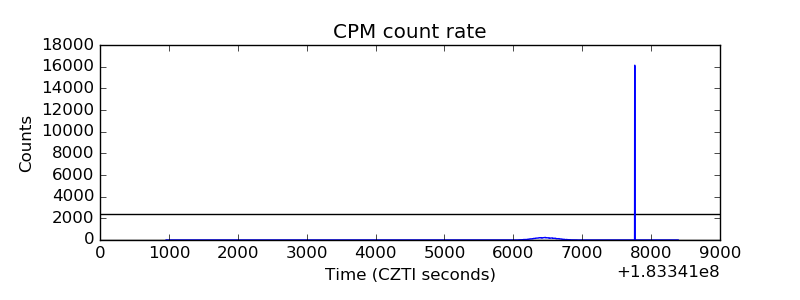 |
| CZT Counter | 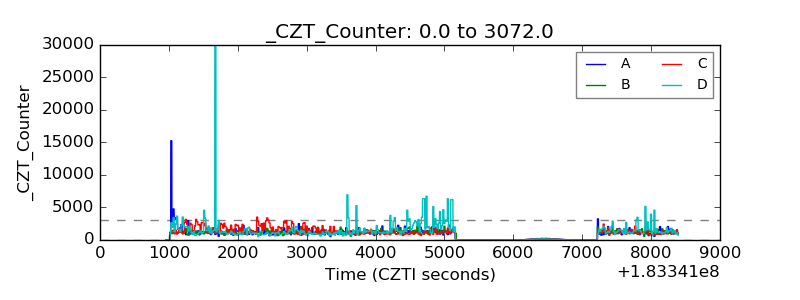 |
| +2.5 Volts monitor |  |
| +5 Volts monitor |  |
| _ROLL_ROT | 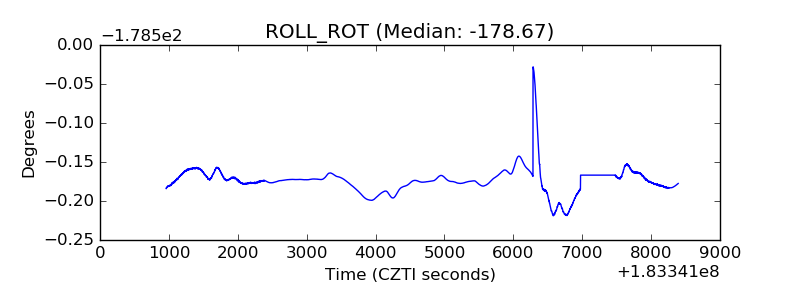 |
| _Roll_DEC | 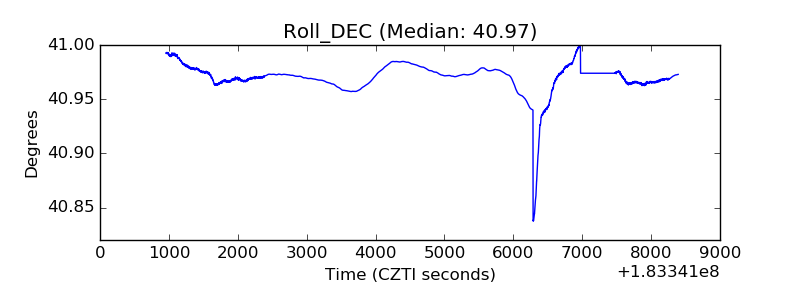 |
| _Roll_RA | 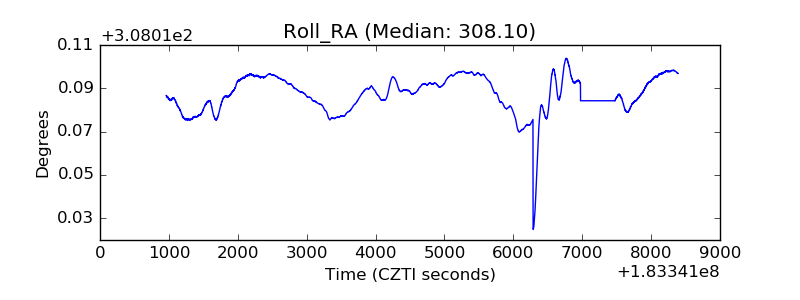 |
| Veto Counter | 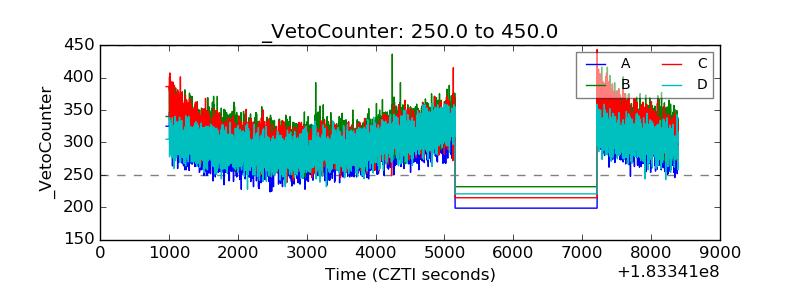 |