| Param | Original file | Final file |
|---|---|---|
| Filename | modeM0/AS1P01_161T05_9000000058_00386cztM0_level2.evt | modeM0/AS1P01_161T05_9000000058_00386cztM0_level2_quad_clean.evt |
| Size (bytes) | 938,577,600 | 38,232,000 |
| Size | 895.1 MB | 36.5 MB |
| Events in quadrant A | 7,020,048 | 192,791 |
| Events in quadrant B | 6,794,212 | 185,700 |
| Events in quadrant C | 6,026,991 | 192,998 |
| Events in quadrant D | 8,223,826 | 205,319 |
| Mode SS | |||
|---|---|---|---|
| Quadrant | BADHDUFLAG | Total packets | Discarded packets |
| A | 0 | 110 | 0 |
| B | 0 | 110 | 0 |
| C | 0 | 110 | 0 |
| D | 0 | 110 | 0 |
| Mode M9 | |||
|---|---|---|---|
| Quadrant | BADHDUFLAG | Total packets | Discarded packets |
| A | 0 | 21 | 0 |
| B | 0 | 21 | 0 |
| C | 0 | 21 | 0 |
| D | 0 | 21 | 0 |
| Mode M0 | |||
|---|---|---|---|
| Quadrant | BADHDUFLAG | Total packets | Discarded packets |
| A | 0 | 24708 | 1 |
| B | 0 | 24053 | 1 |
| C | 0 | 21768 | 1 |
| D | 0 | 28341 | 1 |
| Quadrant | Total seconds | Saturated seconds | Saturation percentage |
|---|---|---|---|
| A | 5430 | 41 | 0.755064% |
| B | 5430 | 16 | 0.294659% |
| C | 5430 | 4 | 0.073665% |
| D | 5430 | 400 | 7.366483% |
Noise dominated data is calculated using 1-second bins in cleaned event files. If a bin has >2000 counts, and if more than 50% of those come from <1% of pixels, then it is considered to be noise-dominated and hence unusable.
| Quadrant | # 1 sec bins | Bins with >0 counts | Bins with >2000 counts | High rate bins dominated by noise | Noise dominated (total time) | Noise dominated (detector-on time) | Marked lightcurve |
|---|---|---|---|---|---|---|---|
| A | 7495 | 5431 | 237 | 237 | 3.16% | 4.36% | 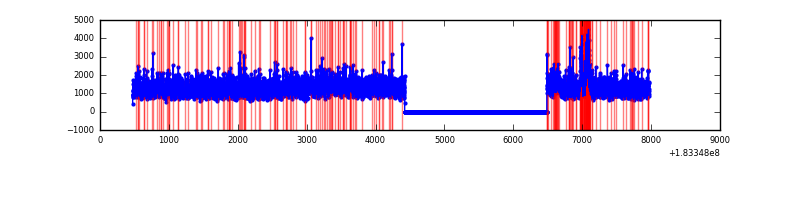 |
| B | 7495 | 5431 | 109 | 109 | 1.45% | 2.01% | 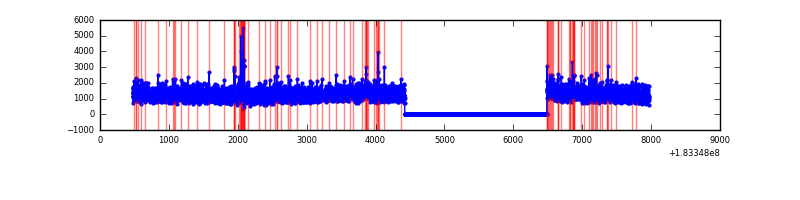 |
| C | 7495 | 5431 | 35 | 35 | 0.47% | 0.64% | 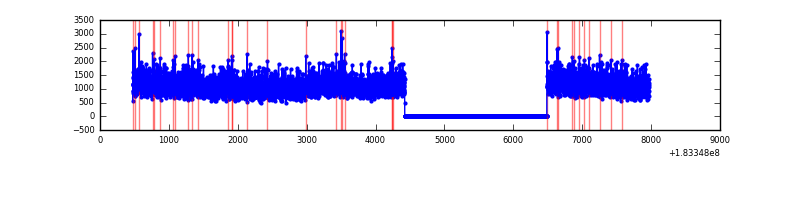 |
| D | 7495 | 5431 | 950 | 950 | 12.68% | 17.49% | 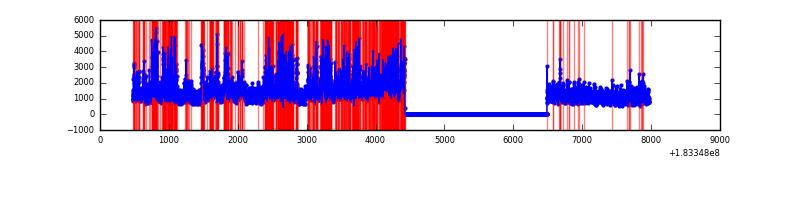 |
Top three noisy pixels from each quadrant. If the there are fewer than three noisy pixels in the level2.evt file, extra rows are filled as -1
| Pixel properties | Quadrant properties | ||||||
|---|---|---|---|---|---|---|---|
| Quadrant | DetID | PixID | Counts | Sigma | Mean | Median | Sigma |
| A | 12 | 243 | 211181 | 550.0 | 1705 | 1690 | 380.9 |
| A | 0 | 238 | 83812 | 215.6 | 1705 | 1690 | 380.9 |
| A | 15 | 17 | 29808 | 73.82 | 1705 | 1690 | 380.9 |
| B | 0 | 182 | 74691 | 180.53 | 1701 | 1714 | 404.2 |
| B | 5 | 176 | 40004 | 94.72 | 1701 | 1714 | 404.2 |
| B | 0 | 230 | 26587 | 61.53 | 1701 | 1714 | 404.2 |
| C | 3 | 159 | 79371 | 183.81 | 1508 | 1560 | 423.3 |
| C | 3 | 9 | 10761 | 21.74 | 1508 | 1560 | 423.3 |
| C | 1 | 1 | 6268 | 11.12 | 1508 | 1560 | 423.3 |
| D | 13 | 7 | 1242966 | 2772.36 | 1432 | 1482 | 447.8 |
| D | 10 | 102 | 421947 | 938.94 | 1432 | 1482 | 447.8 |
| D | 2 | 90 | 376513 | 837.48 | 1432 | 1482 | 447.8 |
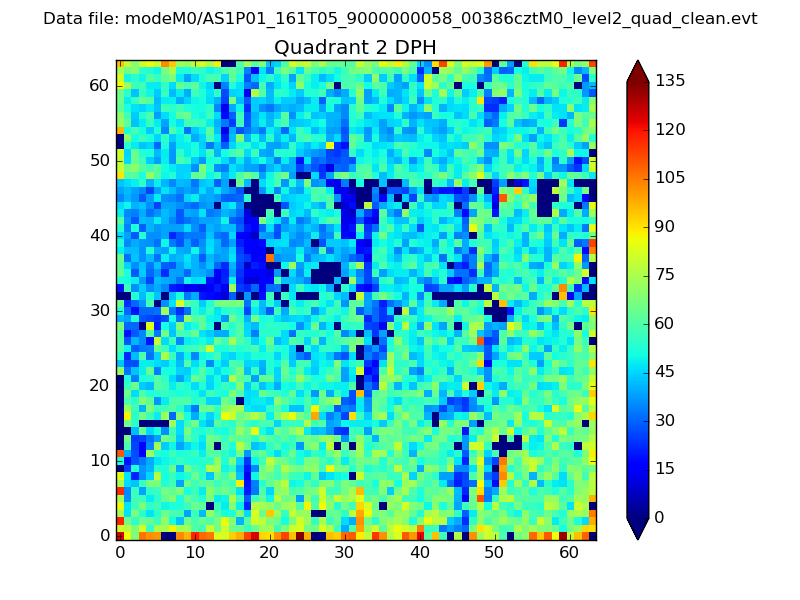
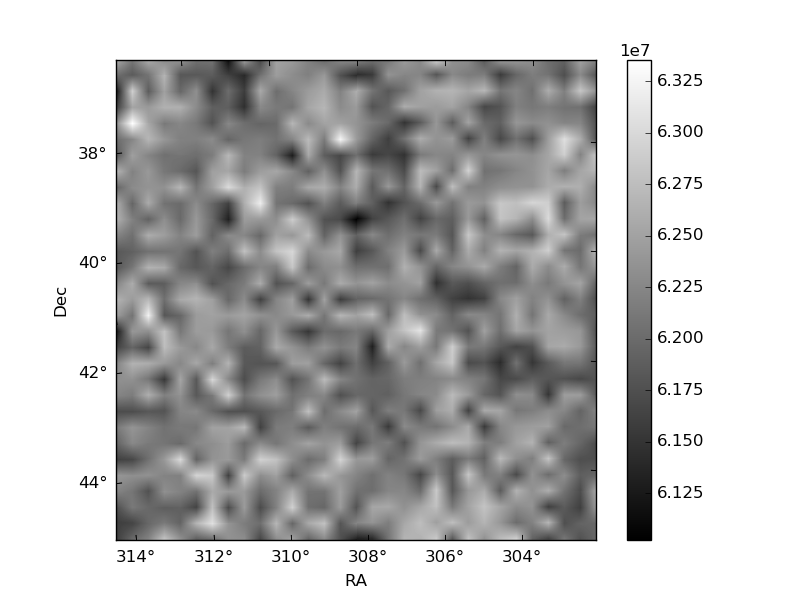
Histogram calculated using DETX and DETY for each event in the final _common_clean file
| Quadrant A | 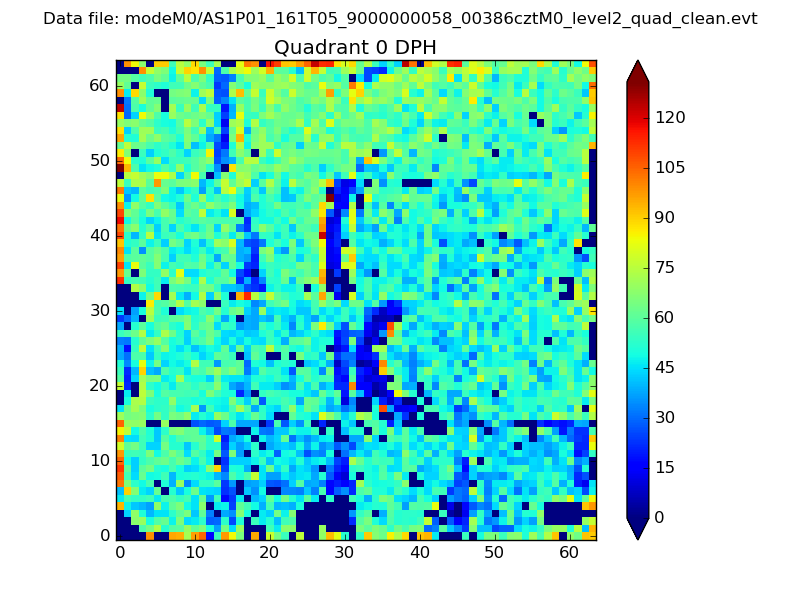 |
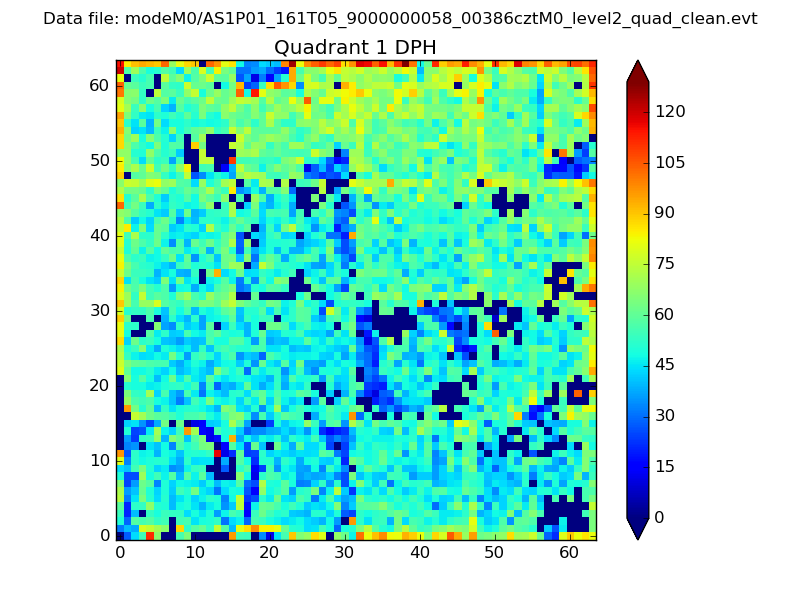 |
Quadrant B |
|---|---|---|---|
| Quadrant D | 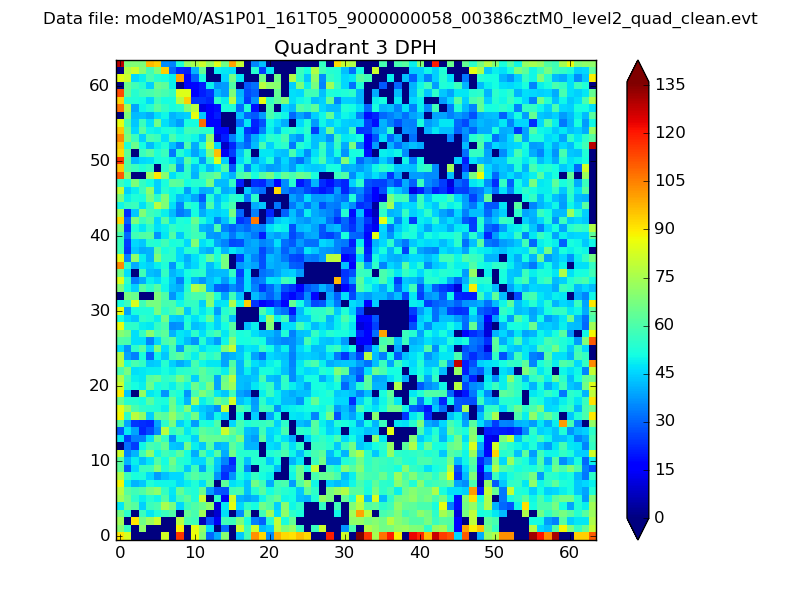 |
 |
Quadrant C |
| Plot type | Count rate plots | Images |
|---|---|---|
| Comparison with Poisson distribution Blue bars denote a histogram of data divided into 1 sec bins. Red curve is a Poisson curve with rate = median count rate of data. |
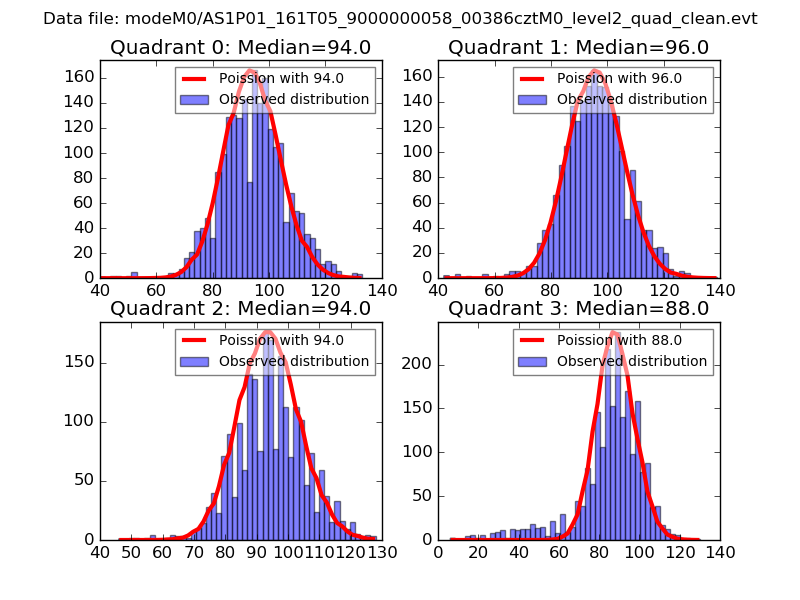 |
 |
| Quadrant-wise count rates Data is divided into 100 sec bins |
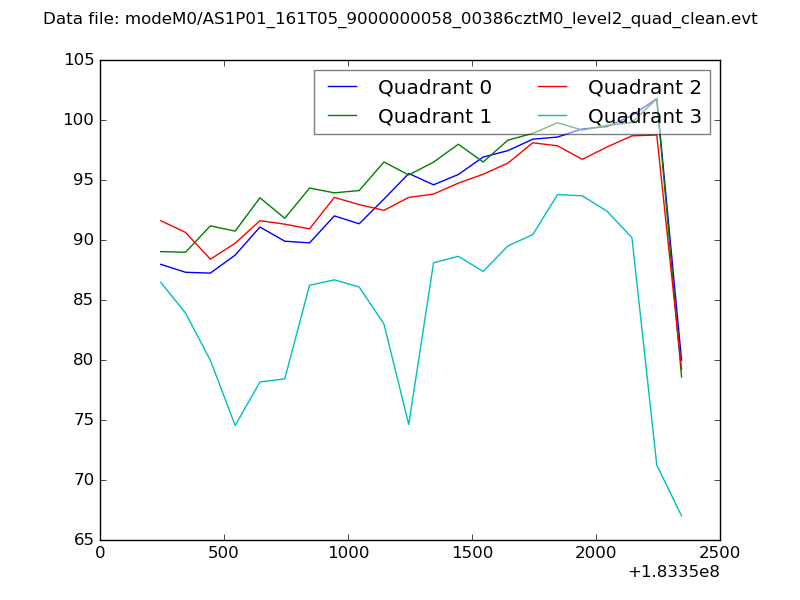 |
|
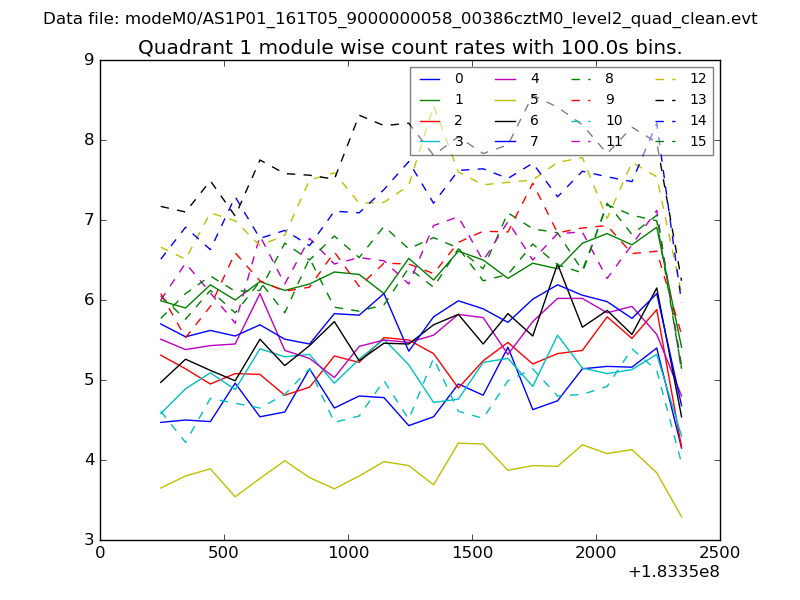
| Module-wise count rates for Quadrant A Data is divided into 100 sec bins |
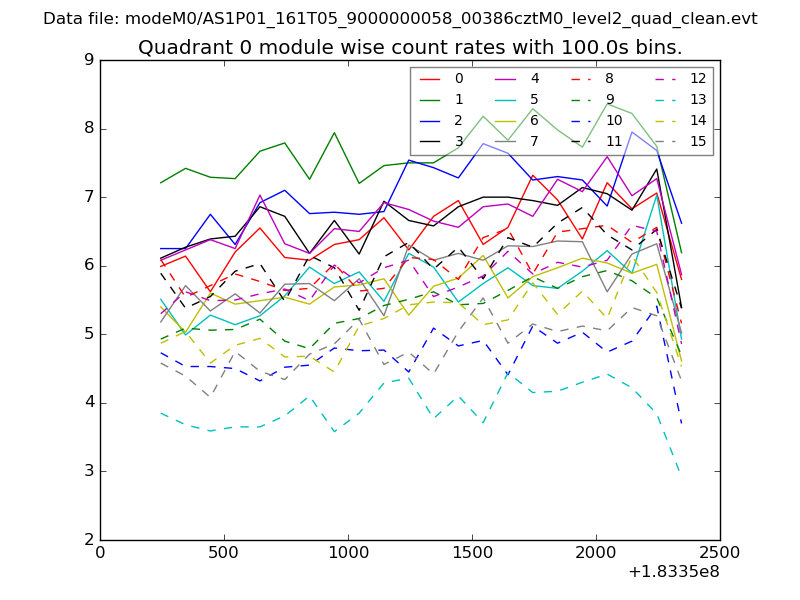 |
 |
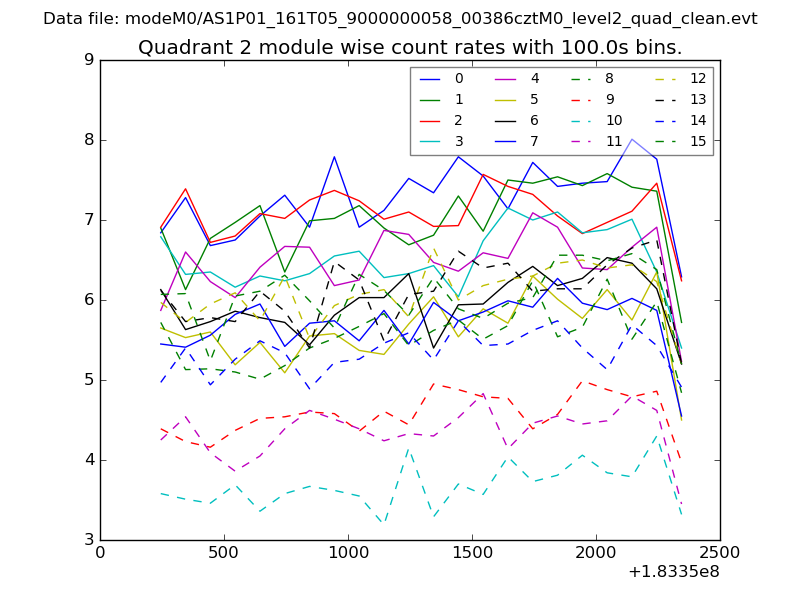
| Module-wise count rates for Quadrant B Data is divided into 100 sec bins |
 |
 |
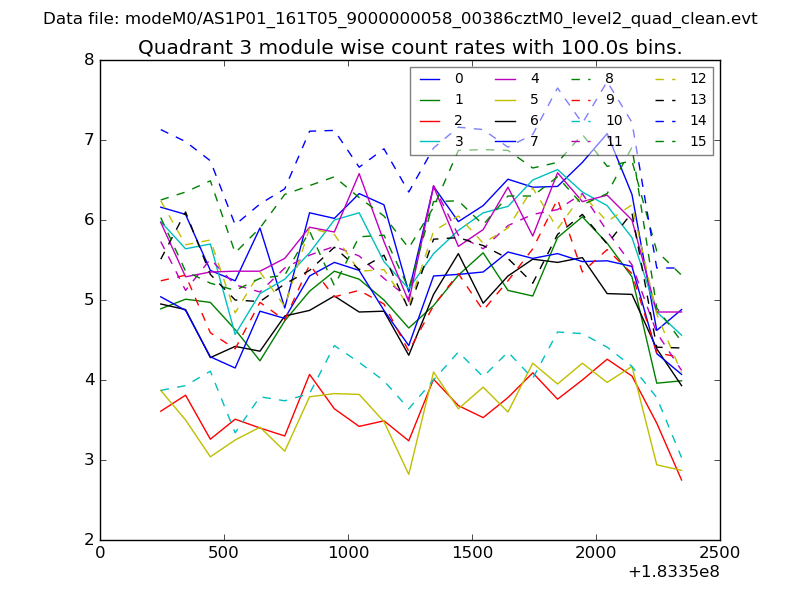
| Module-wise count rates for Quadrant C Data is divided into 100 sec bins |
 |
 |
| Module-wise count rates for Quadrant D Data is divided into 100 sec bins |
 |
 |
| Parameter | Plot |
|---|---|
| CZT HV Monitor | 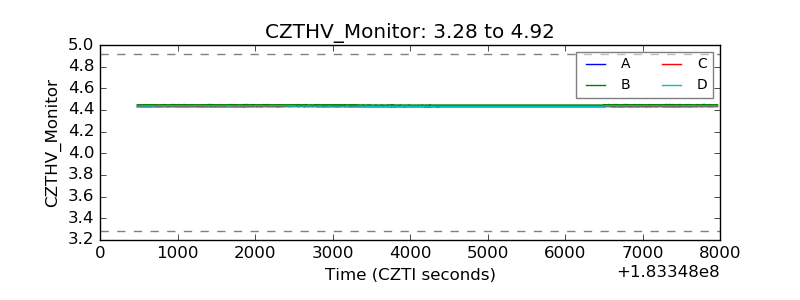 |
| D_VDD | 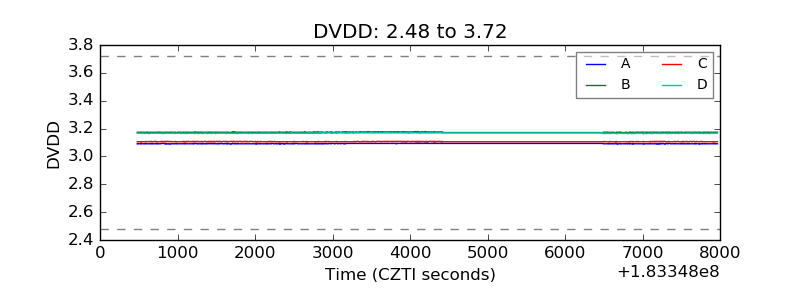 |
| Temperature 1 | 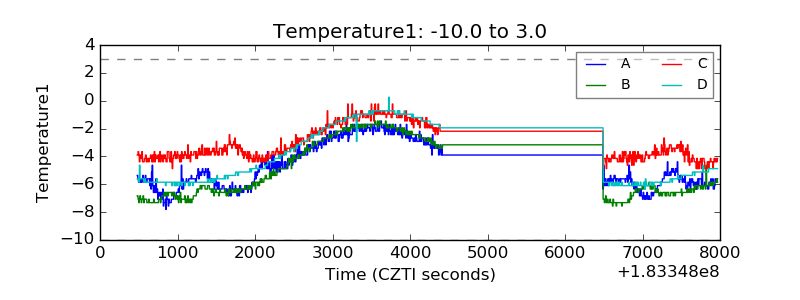 |
| Veto HV Monitor | 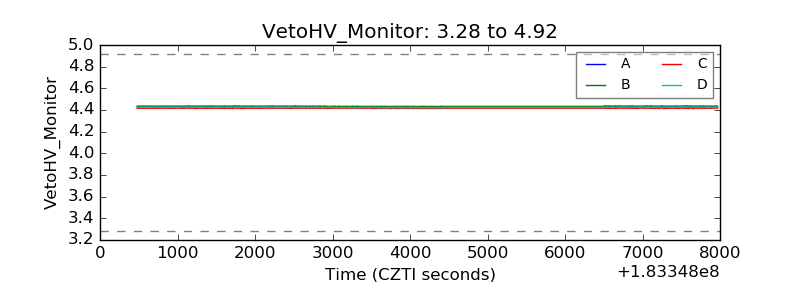 |
| Veto LLD | 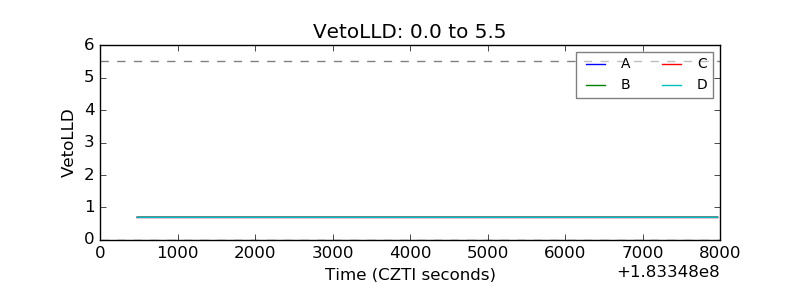 |
| Alpha Counter | 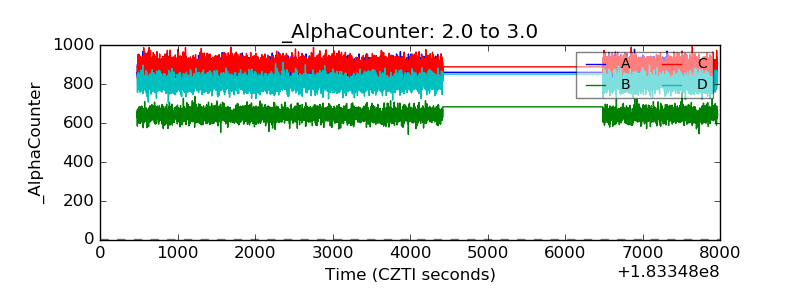 |
| _CPM_Rate | 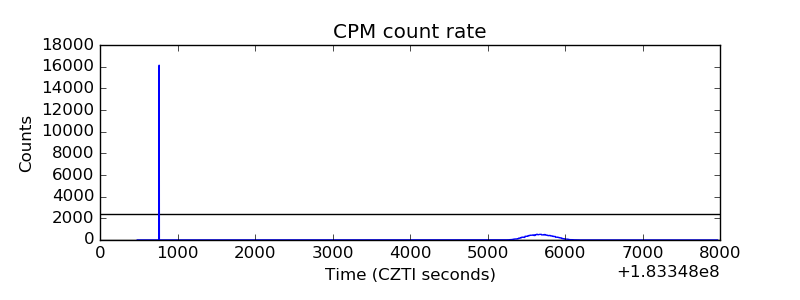 |
| CZT Counter | 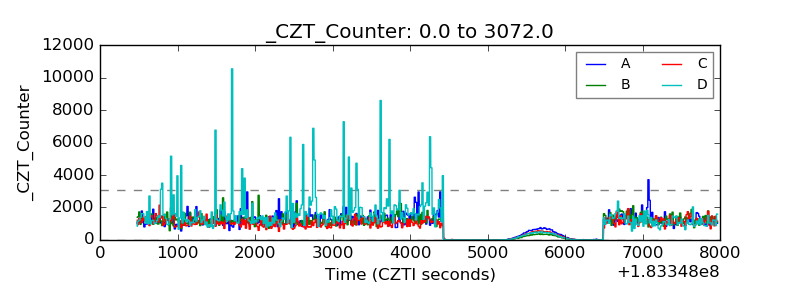 |
| +2.5 Volts monitor |  |
| +5 Volts monitor |  |
| _ROLL_ROT | 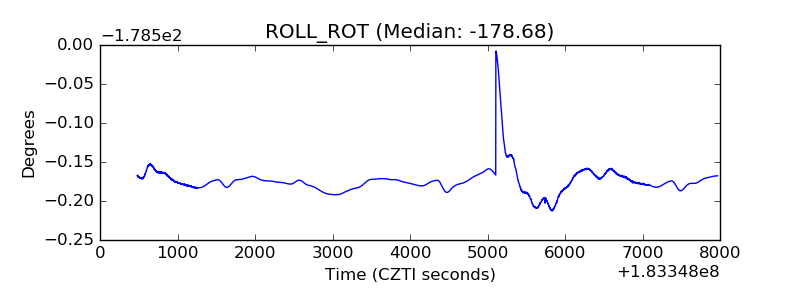 |
| _Roll_DEC | 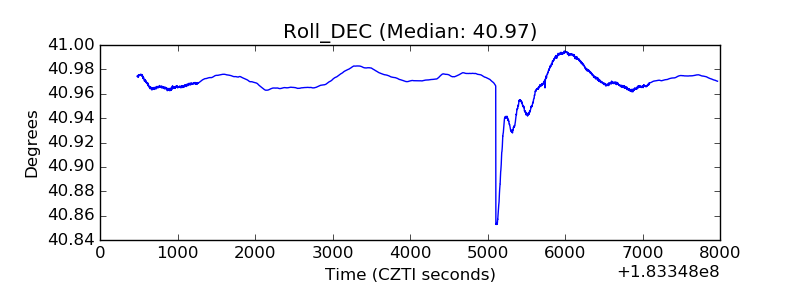 |
| _Roll_RA |  |
| Veto Counter | 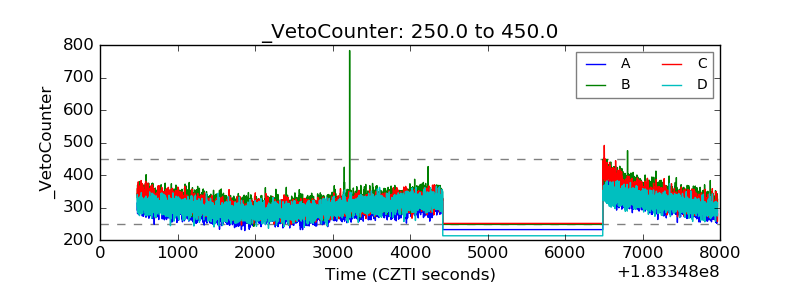 |