| Param | Original file | Final file |
|---|---|---|
| Filename | modeM0/AS1P01_163T03_9000000056cztM0_level2.fits | modeM0/AS1P01_163T03_9000000056cztM0_level2_quad_clean.evt |
| Size (bytes) | 116,533,440 | 114,877,440 |
| Size | 111.1 MB | 109.6 MB |
| Events in quadrant A | 669,328 | 666,739 |
| Events in quadrant B | 663,524 | 603,784 |
| Events in quadrant C | 668,970 | 651,413 |
| Events in quadrant D | 566,714 | 596,328 |
| Mode M9 | |||
|---|---|---|---|
| Quadrant | BADHDUFLAG | Total packets | Discarded packets |
| A | 0 | 83 | 0 |
| B | 0 | 83 | 0 |
| C | 0 | 83 | 0 |
| D | 0 | 83 | 0 |
| Mode M0 | |||
|---|---|---|---|
| Quadrant | BADHDUFLAG | Total packets | Discarded packets |
| A | 0 | 69231 | 0 |
| B | 0 | 67656 | 0 |
| C | 0 | 60806 | 0 |
| D | 0 | 61469 | 0 |
| Mode SS | |||
|---|---|---|---|
| Quadrant | BADHDUFLAG | Total packets | Discarded packets |
| A | 0 | 288 | 0 |
| B | 0 | 288 | 0 |
| C | 0 | 288 | 0 |
| D | 0 | 288 | 0 |
| Quadrant | Total seconds | Saturated seconds | Saturation percentage |
|---|---|---|---|
| A | 13894 | 586 | 4.217648% |
| B | 13894 | 1081 | 7.780337% |
| C | 13894 | 76 | 0.546999% |
| D | 13894 | 157 | 1.129984% |
Noise dominated data is calculated using 1-second bins in cleaned event files. If a bin has >2000 counts, and if more than 50% of those come from <1% of pixels, then it is considered to be noise-dominated and hence unusable.
| Quadrant | # 1 sec bins | Bins with >0 counts | Bins with >2000 counts | High rate bins dominated by noise | Noise dominated (total time) | Noise dominated (detector-on time) | Marked lightcurve |
|---|---|---|---|---|---|---|---|
| A | 20539 | 13894 | 0 | 0 | 0.00% | 0.00% |  |
| B | 20539 | 13894 | 0 | 0 | 0.00% | 0.00% |  |
| C | 20539 | 13894 | 0 | 0 | 0.00% | 0.00% |  |
| D | 20539 | 13891 | 0 | 0 | 0.00% | 0.00% | 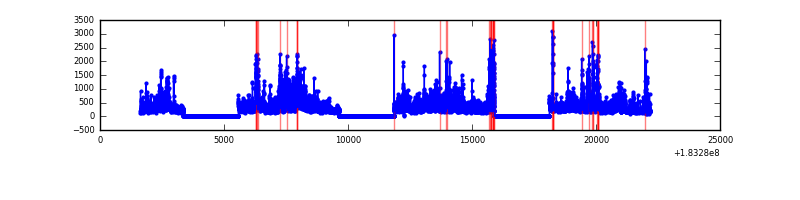 |
Top three noisy pixels from each quadrant. If the there are fewer than three noisy pixels in the level2.evt file, extra rows are filled as -1
| Pixel properties | Quadrant properties | ||||||
|---|---|---|---|---|---|---|---|
| Quadrant | DetID | PixID | Counts | Sigma | Mean | Median | Sigma |
| A | 7 | 110 | 625 | 11.17 | 174 | 164 | 41.3 |
| A | 0 | 29 | 613 | 10.88 | 174 | 164 | 41.3 |
| A | 0 | 30 | 483 | 7.73 | 174 | 164 | 41.3 |
| B | 2 | 9 | 563 | 12.4 | 175 | 169 | 31.8 |
| B | 14 | 254 | 480 | 9.79 | 175 | 169 | 31.8 |
| B | 10 | 225 | 429 | 8.18 | 175 | 169 | 31.8 |
| C | 12 | 241 | 514 | 7.83 | 176 | 164 | 44.7 |
| C | 2 | 191 | 504 | 7.61 | 176 | 164 | 44.7 |
| C | 1 | 81 | 490 | 7.3 | 176 | 164 | 44.7 |
| D | 6 | 44 | 467 | 7.85 | 162 | 149 | 40.5 |
| D | 6 | 231 | 450 | 7.43 | 162 | 149 | 40.5 |
| D | 11 | 82 | 433 | 7.01 | 162 | 149 | 40.5 |
Histogram calculated using DETX and DETY for each event in the final _common_clean file
| Quadrant A |  |
 |
Quadrant B |
|---|---|---|---|
| Quadrant D |  |
 |
Quadrant C |
| Plot type | Count rate plots | Images |
|---|---|---|
| Comparison with Poisson distribution Blue bars denote a histogram of data divided into 1 sec bins. Red curve is a Poisson curve with rate = median count rate of data. |
 |
 |
| Quadrant-wise count rates Data is divided into 100 sec bins |
 |
|
| Module-wise count rates for Quadrant A Data is divided into 100 sec bins |
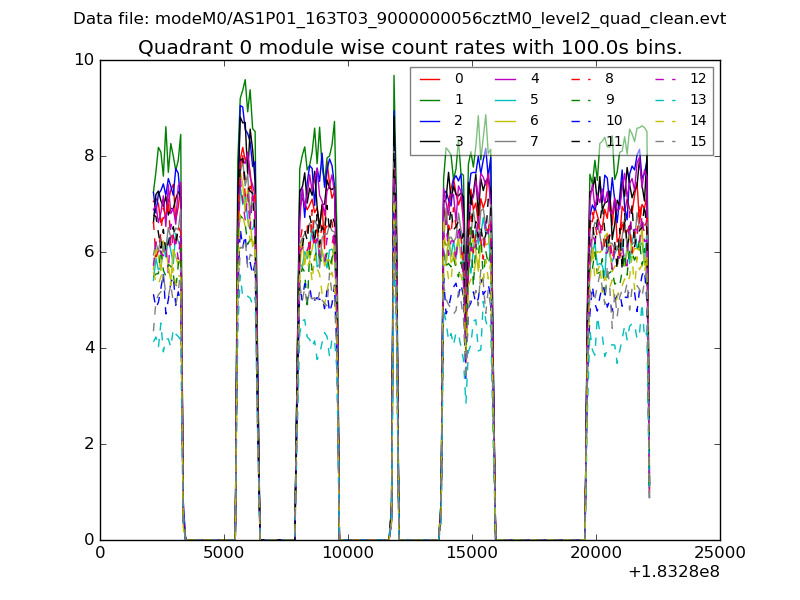 |
 |
| Module-wise count rates for Quadrant B Data is divided into 100 sec bins |
 |
 |
| Module-wise count rates for Quadrant C Data is divided into 100 sec bins |
 |
 |
| Module-wise count rates for Quadrant D Data is divided into 100 sec bins |
 |
 |
| Parameter | Plot |
|---|---|
| CZT HV Monitor |  |
| D_VDD | 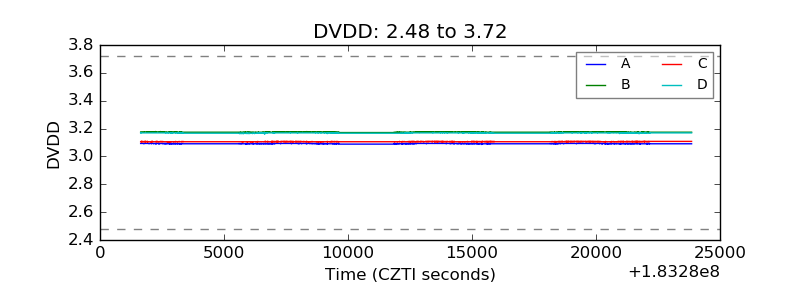 |
| Temperature 1 |  |
| Veto HV Monitor |  |
| Veto LLD | 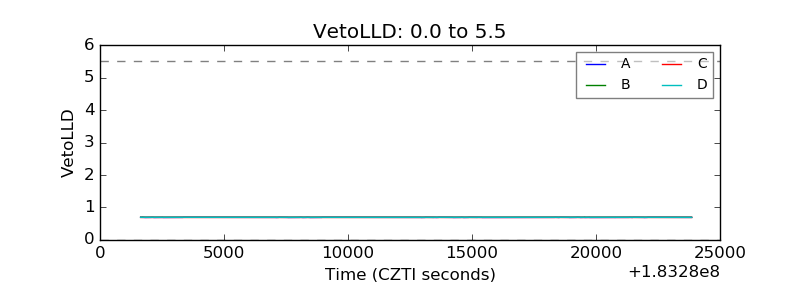 |
| Alpha Counter |  |
| _CPM_Rate | 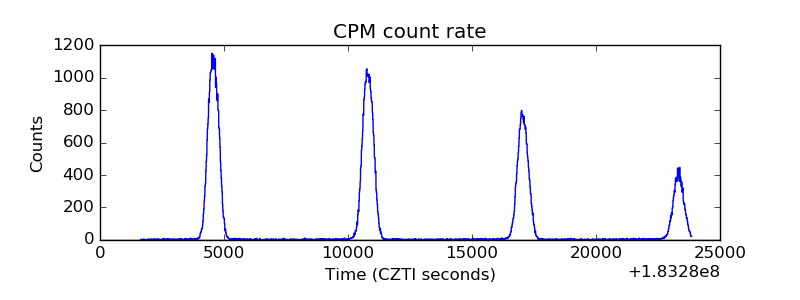 |
| CZT Counter |  |
| +2.5 Volts monitor |  |
| +5 Volts monitor |  |
| _ROLL_ROT |  |
| _Roll_DEC | 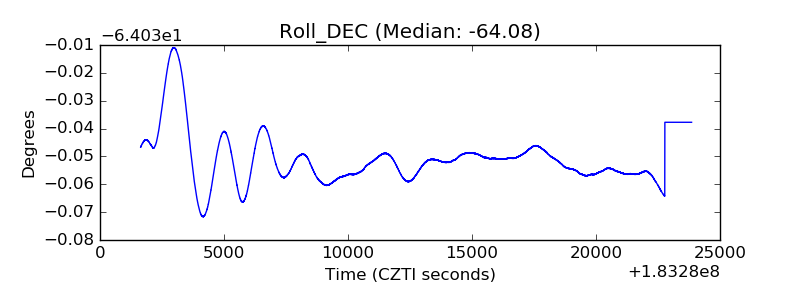 |
| _Roll_RA |  |
| Veto Counter |  |