| Param | Original file | Final file |
|---|---|---|
| Filename | modeM0/AS1P01_163T03_9000000056_00377cztM0_level2.evt | modeM0/AS1P01_163T03_9000000056_00377cztM0_level2_quad_clean.evt |
| Size (bytes) | 749,943,360 | 41,005,440 |
| Size | 715.2 MB | 39.1 MB |
| Events in quadrant A | 6,020,656 | 249,246 |
| Events in quadrant B | 6,804,846 | 217,695 |
| Events in quadrant C | 4,766,632 | 246,708 |
| Events in quadrant D | 4,850,046 | 240,978 |
| Mode M9 | |||
|---|---|---|---|
| Quadrant | BADHDUFLAG | Total packets | Discarded packets |
| A | 0 | 17 | 0 |
| B | 0 | 17 | 0 |
| C | 0 | 17 | 0 |
| D | 0 | 18 | 0 |
| Mode M0 | |||
|---|---|---|---|
| Quadrant | BADHDUFLAG | Total packets | Discarded packets |
| A | 0 | 20794 | 1 |
| B | 0 | 23240 | 1 |
| C | 0 | 17048 | 1 |
| D | 0 | 17293 | 1 |
| Mode SS | |||
|---|---|---|---|
| Quadrant | BADHDUFLAG | Total packets | Discarded packets |
| A | 0 | 84 | 0 |
| B | 0 | 84 | 0 |
| C | 0 | 84 | 0 |
| D | 0 | 84 | 0 |
| Quadrant | Total seconds | Saturated seconds | Saturation percentage |
|---|---|---|---|
| A | 4054 | 369 | 9.102121% |
| B | 4054 | 913 | 22.520967% |
| C | 4054 | 6 | 0.148002% |
| D | 4054 | 39 | 0.962013% |
Noise dominated data is calculated using 1-second bins in cleaned event files. If a bin has >2000 counts, and if more than 50% of those come from <1% of pixels, then it is considered to be noise-dominated and hence unusable.
| Quadrant | # 1 sec bins | Bins with >0 counts | Bins with >2000 counts | High rate bins dominated by noise | Noise dominated (total time) | Noise dominated (detector-on time) | Marked lightcurve |
|---|---|---|---|---|---|---|---|
| A | 4054 | 4054 | 672 | 672 | 16.58% | 16.58% | 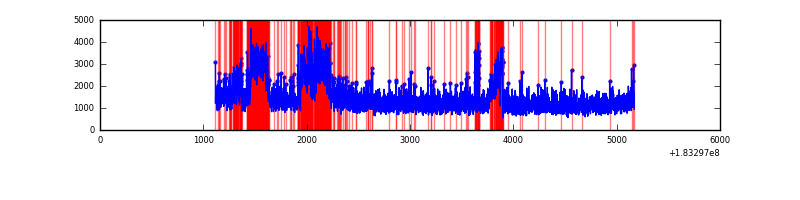 |
| B | 4054 | 4054 | 1029 | 1029 | 25.38% | 25.38% | 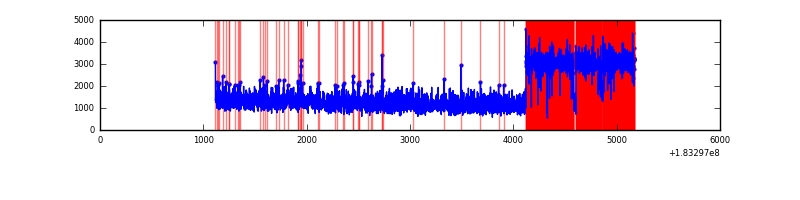 |
| C | 4054 | 4054 | 96 | 96 | 2.37% | 2.37% | 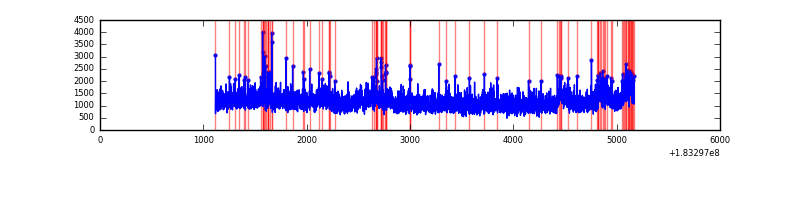 |
| D | 4054 | 4054 | 153 | 153 | 3.77% | 3.77% | 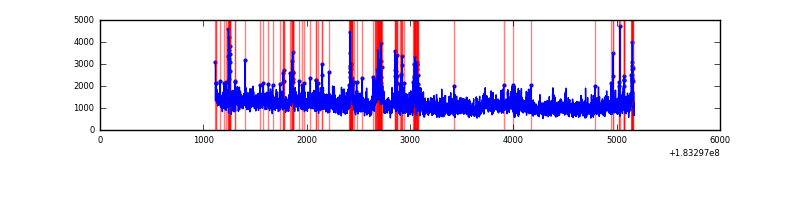 |
Top three noisy pixels from each quadrant. If the there are fewer than three noisy pixels in the level2.evt file, extra rows are filled as -1
| Pixel properties | Quadrant properties | ||||||
|---|---|---|---|---|---|---|---|
| Quadrant | DetID | PixID | Counts | Sigma | Mean | Median | Sigma |
| A | 0 | 69 | 1114470 | 4089.49 | 1206 | 1191 | 272.2 |
| A | 15 | 127 | 81994 | 296.82 | 1206 | 1191 | 272.2 |
| A | 8 | 192 | 71861 | 259.6 | 1206 | 1191 | 272.2 |
| B | 5 | 176 | 2144740 | 7710.82 | 1178 | 1184 | 278.0 |
| B | 0 | 230 | 45857 | 160.7 | 1178 | 1184 | 278.0 |
| B | 7 | 221 | 22735 | 77.52 | 1178 | 1184 | 278.0 |
| C | 10 | 107 | 370865 | 1201.34 | 1101 | 1137 | 307.8 |
| C | 3 | 159 | 47253 | 149.84 | 1101 | 1137 | 307.8 |
| C | 1 | 1 | 12423 | 36.67 | 1101 | 1137 | 307.8 |
| D | 1 | 5 | 220003 | 661.62 | 1060 | 1098 | 330.9 |
| D | 1 | 4 | 130761 | 391.9 | 1060 | 1098 | 330.9 |
| D | 13 | 216 | 63674 | 189.13 | 1060 | 1098 | 330.9 |
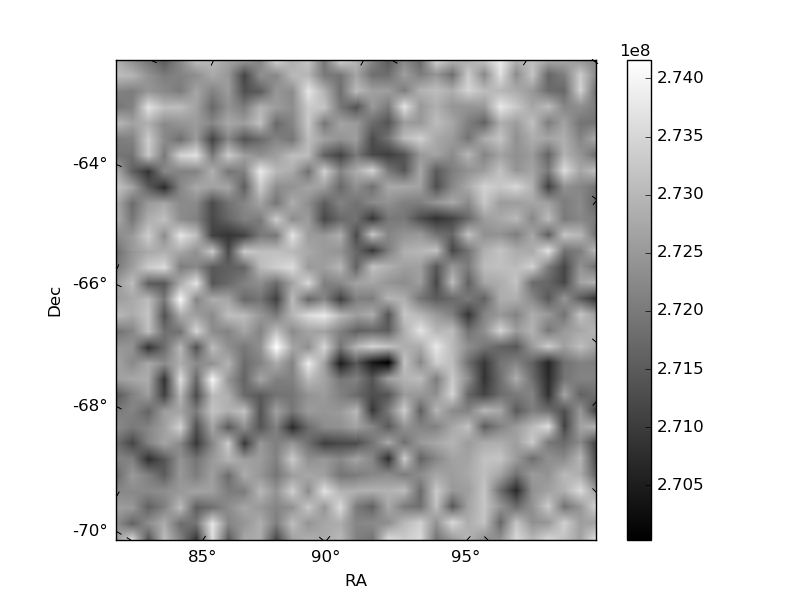
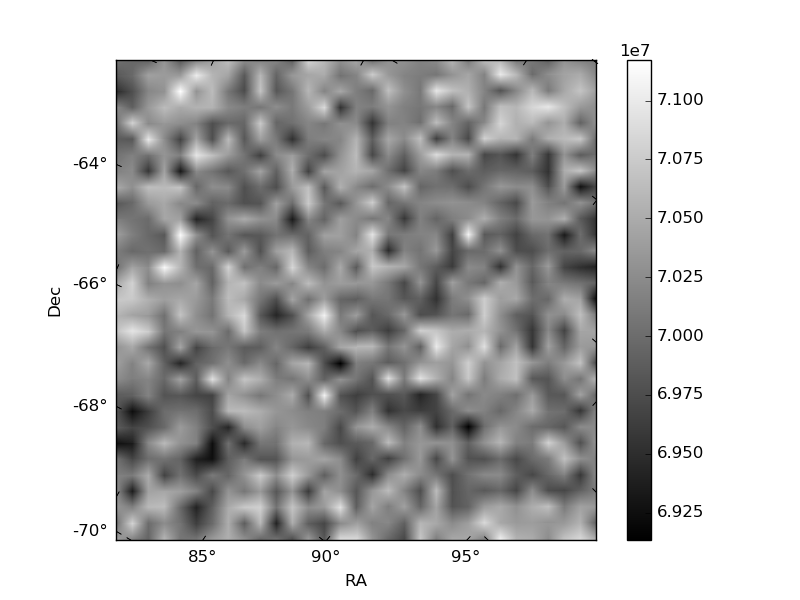
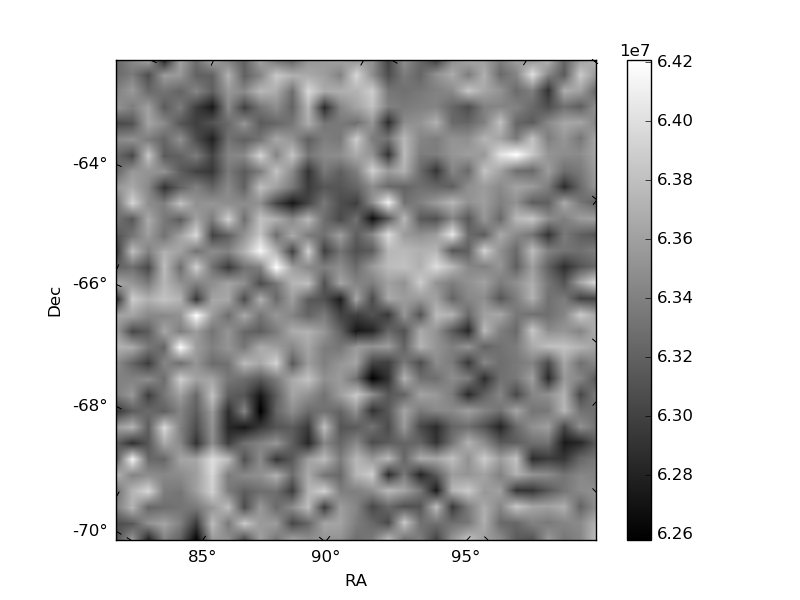
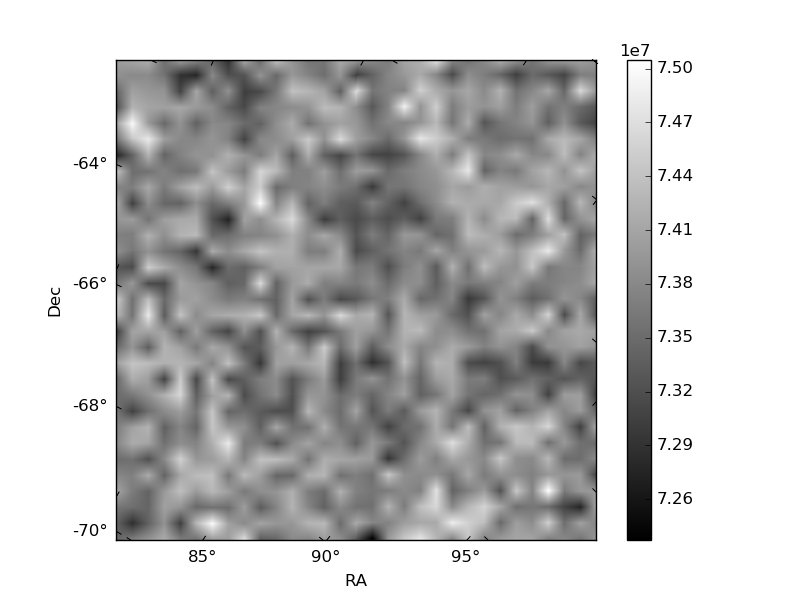
Histogram calculated using DETX and DETY for each event in the final _common_clean file
| Quadrant A | 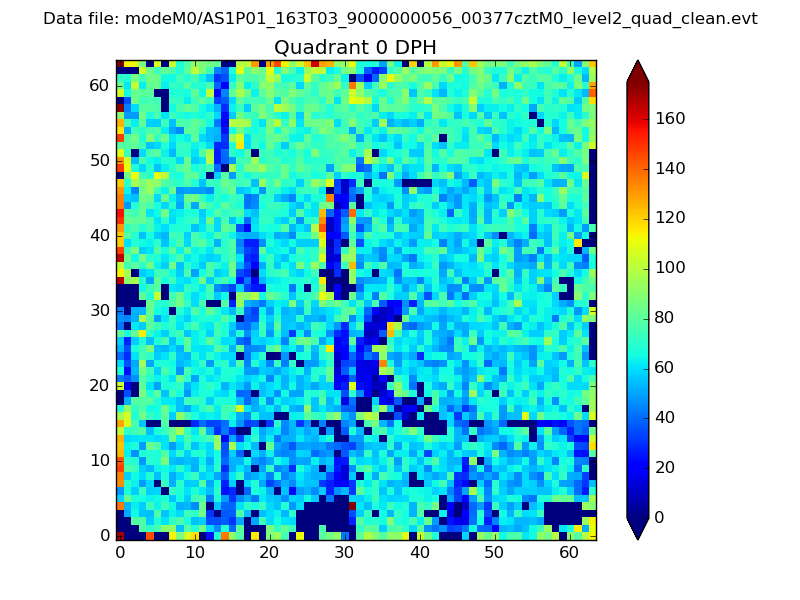 |
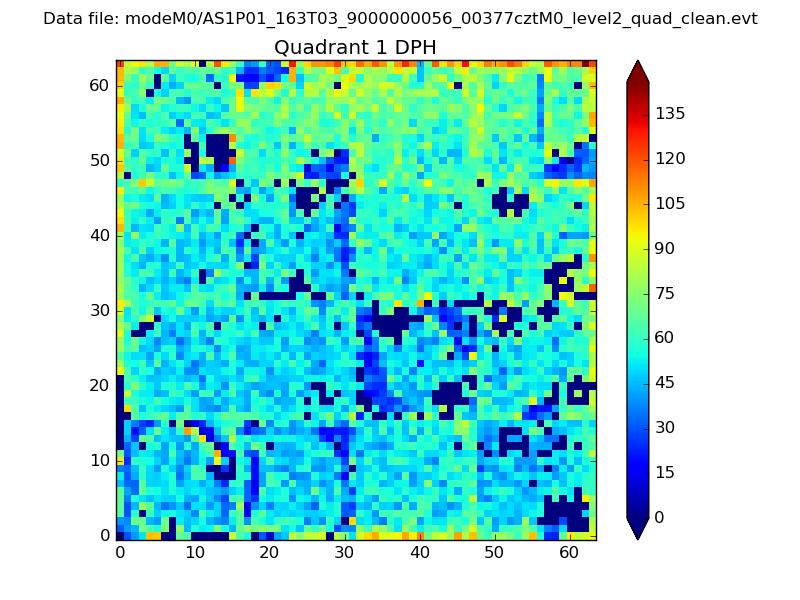 |
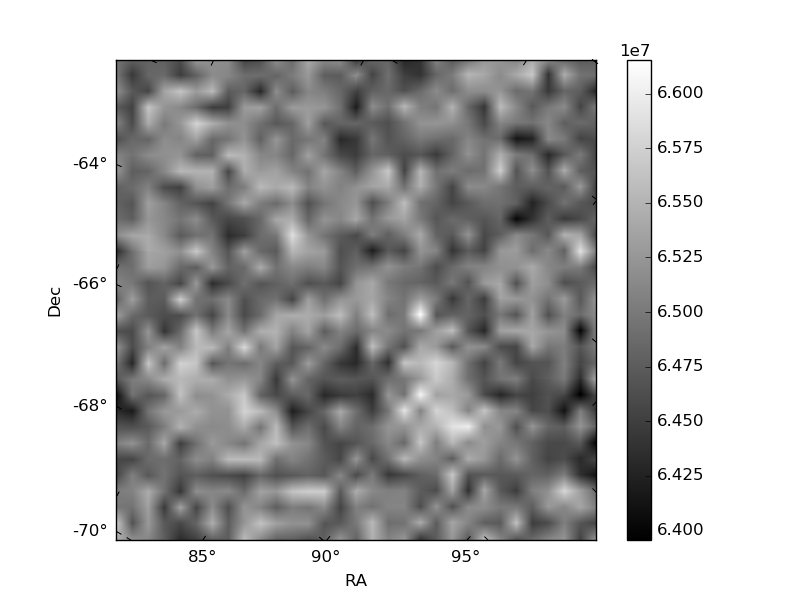
Quadrant B |
|---|---|---|---|
| Quadrant D | 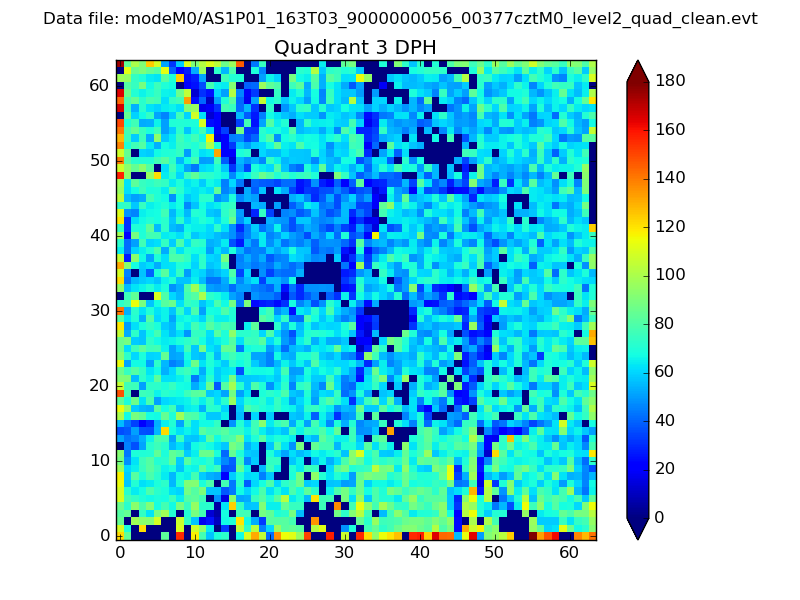 |
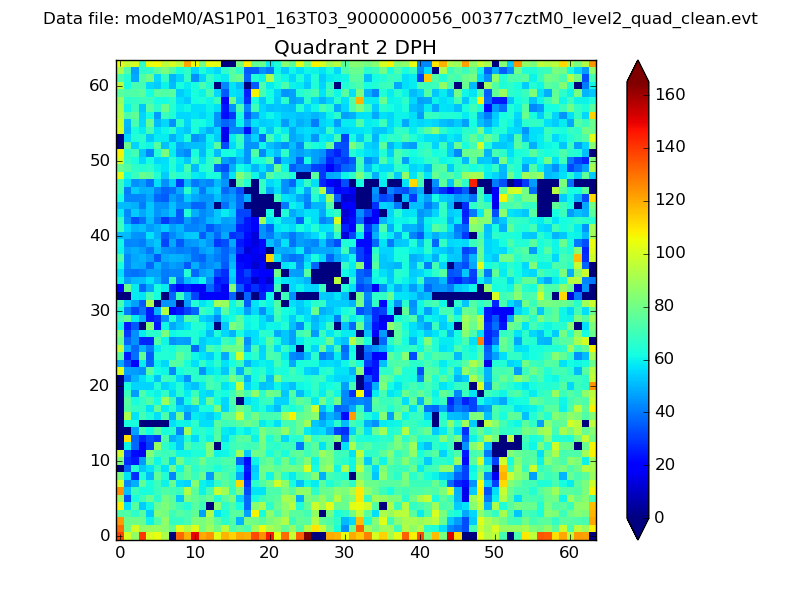 |
Quadrant C |
| Plot type | Count rate plots | Images |
|---|---|---|
| Comparison with Poisson distribution Blue bars denote a histogram of data divided into 1 sec bins. Red curve is a Poisson curve with rate = median count rate of data. |
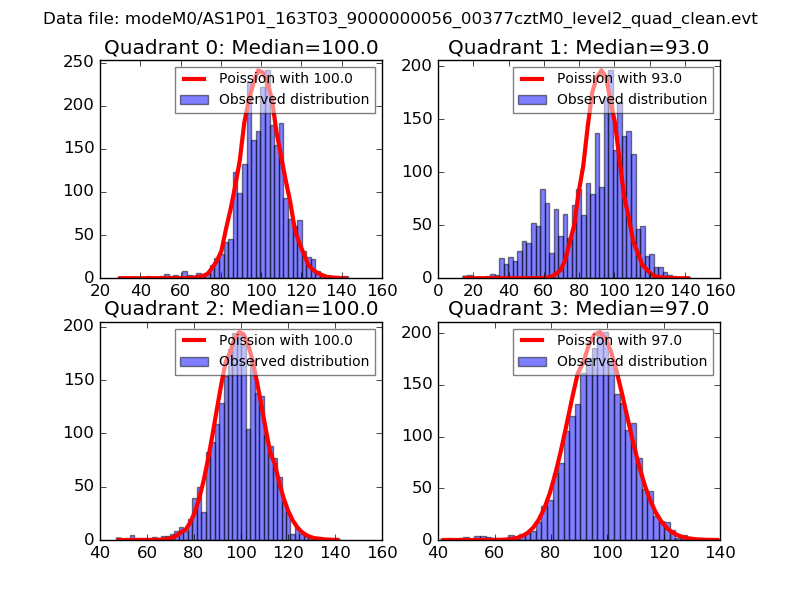 |
 |
| Quadrant-wise count rates Data is divided into 100 sec bins |
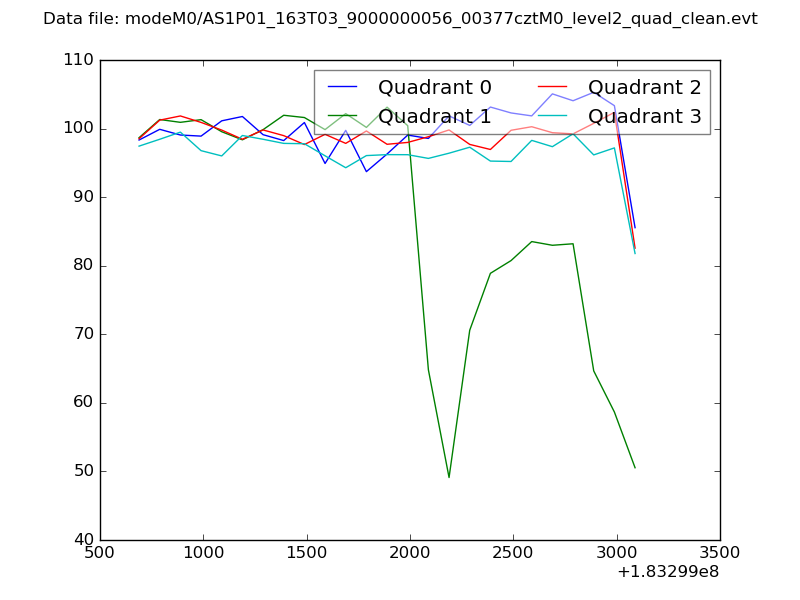 |
|
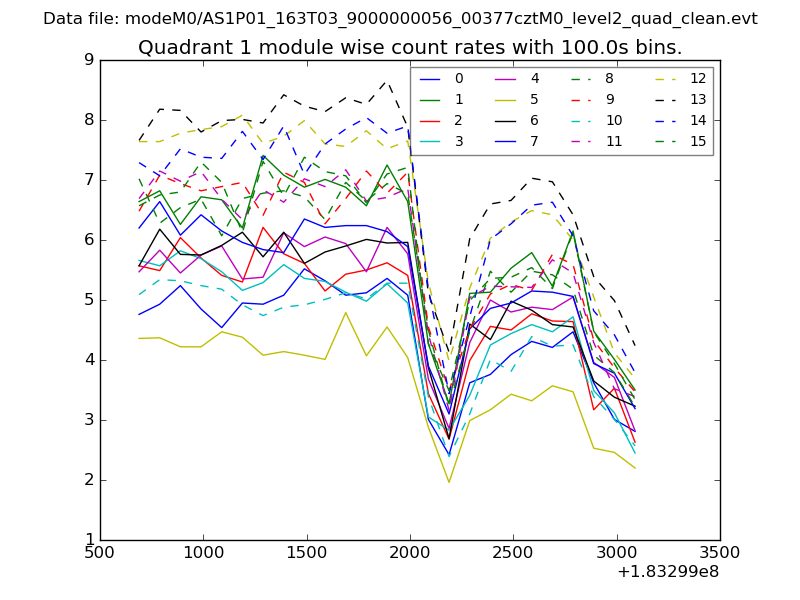
| Module-wise count rates for Quadrant A Data is divided into 100 sec bins |
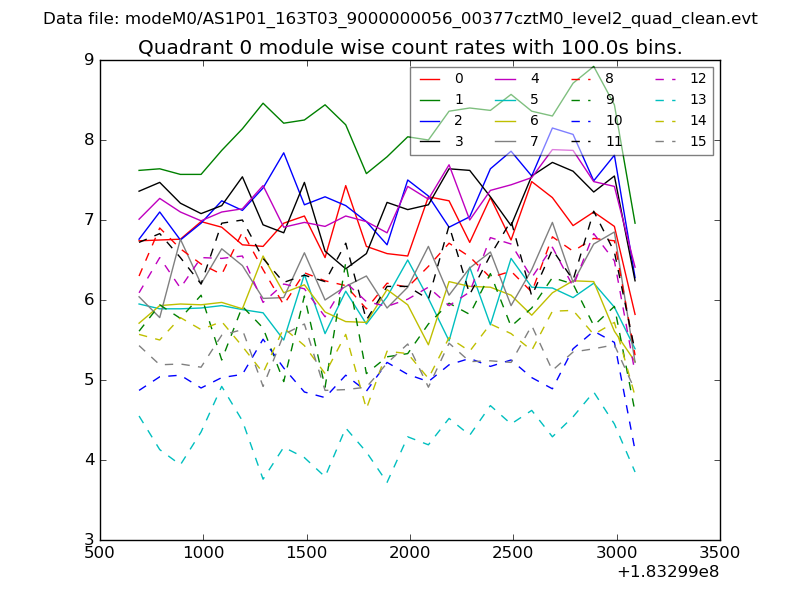 |
 |
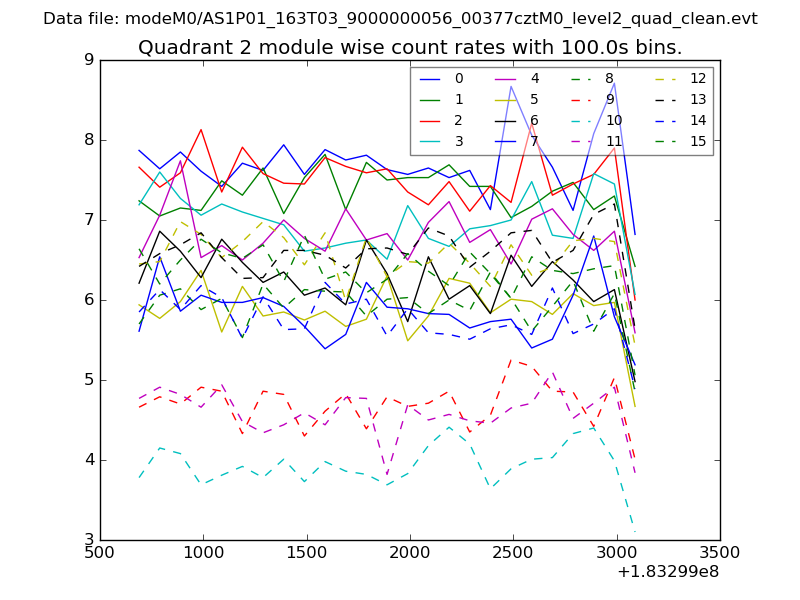
| Module-wise count rates for Quadrant B Data is divided into 100 sec bins |
 |
 |
| Module-wise count rates for Quadrant C Data is divided into 100 sec bins |
 |
 |
| Module-wise count rates for Quadrant D Data is divided into 100 sec bins |
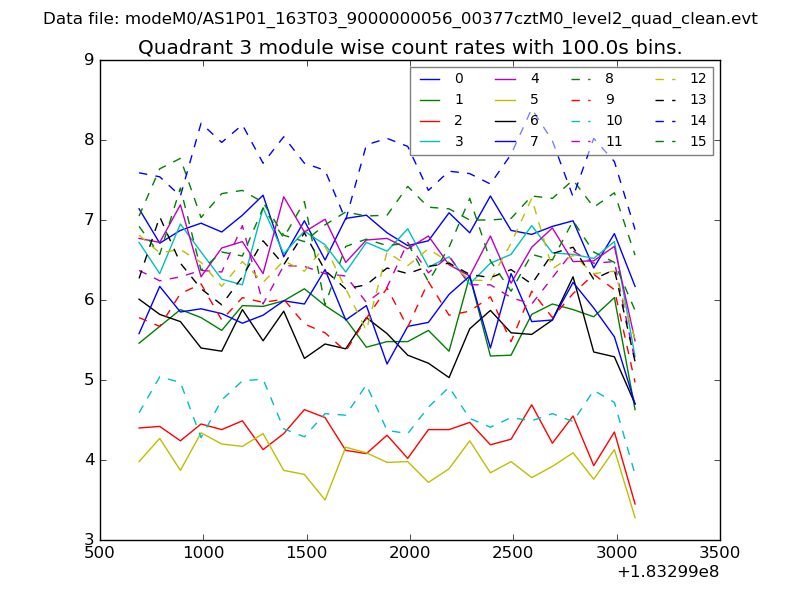 |
 |
| Parameter | Plot |
|---|---|
| CZT HV Monitor | 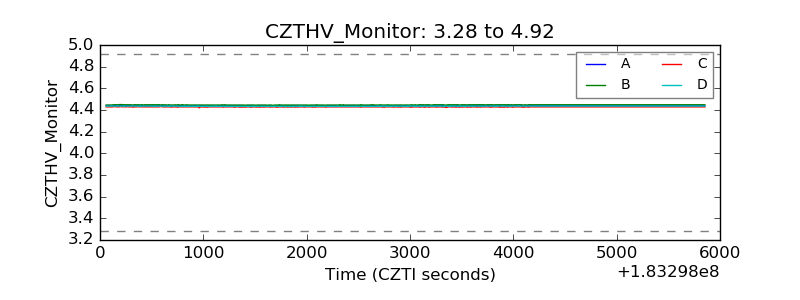 |
| D_VDD | 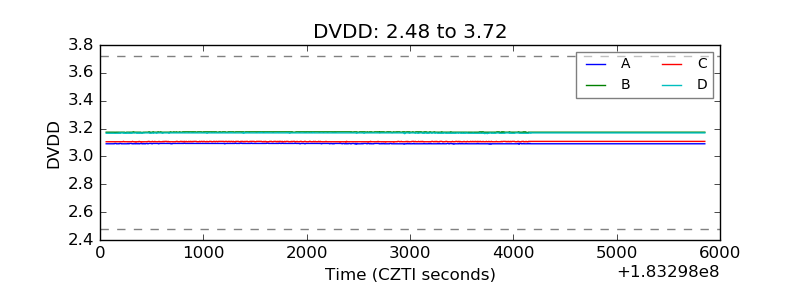 |
| Temperature 1 | 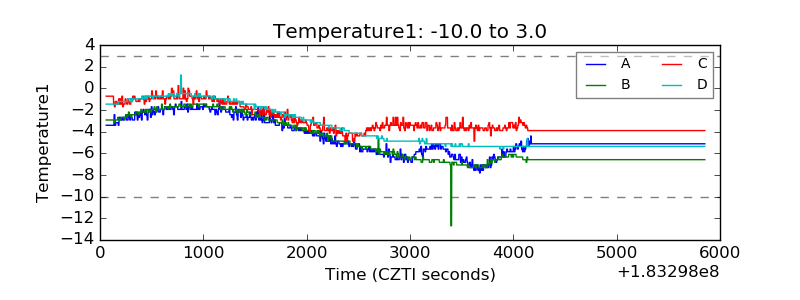 |
| Veto HV Monitor | 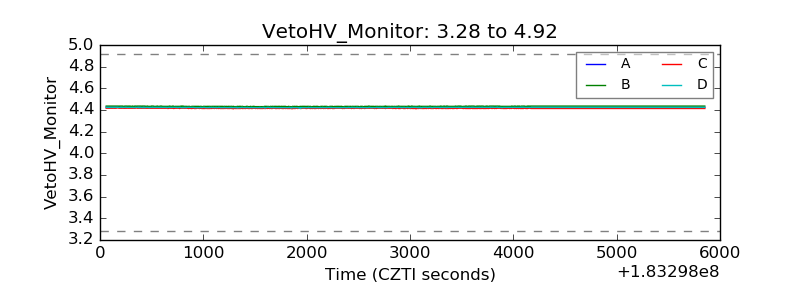 |
| Veto LLD | 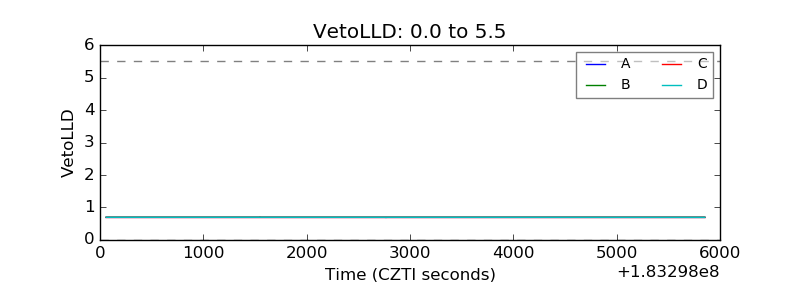 |
| Alpha Counter | 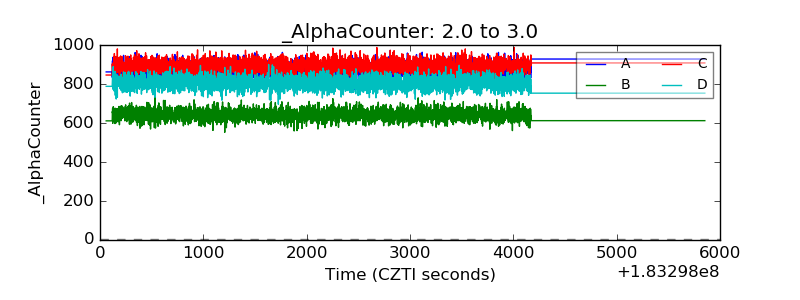 |
| _CPM_Rate | 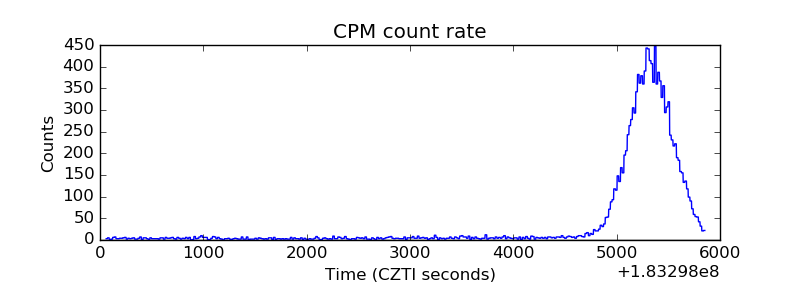 |
| CZT Counter | 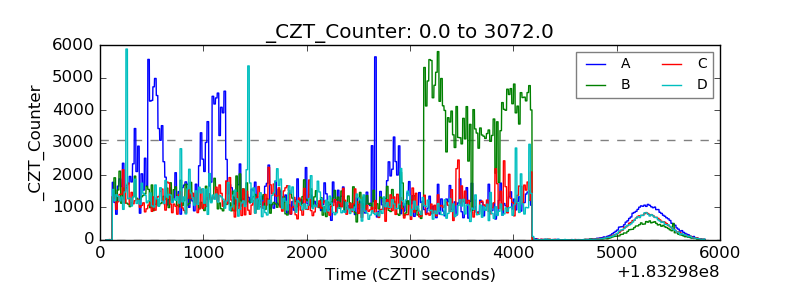 |
| +2.5 Volts monitor |  |
| +5 Volts monitor |  |
| _ROLL_ROT | 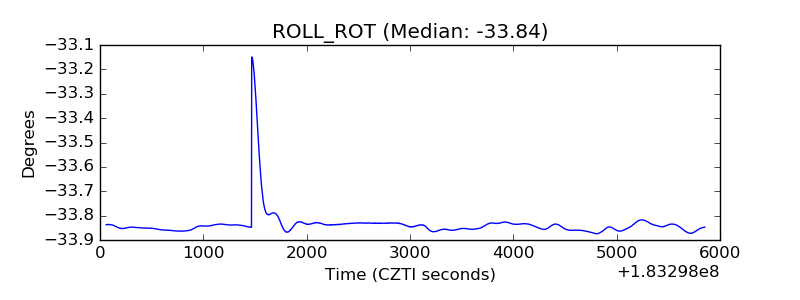 |
| _Roll_DEC | 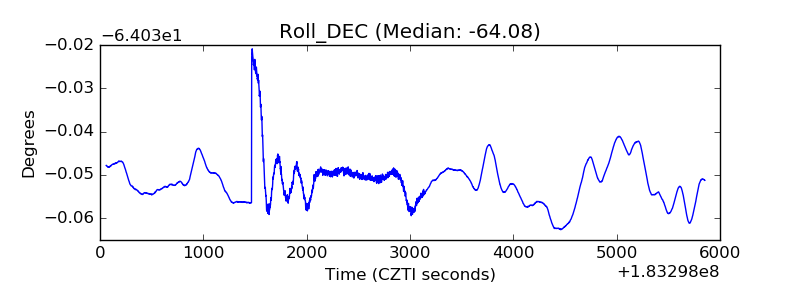 |
| _Roll_RA | 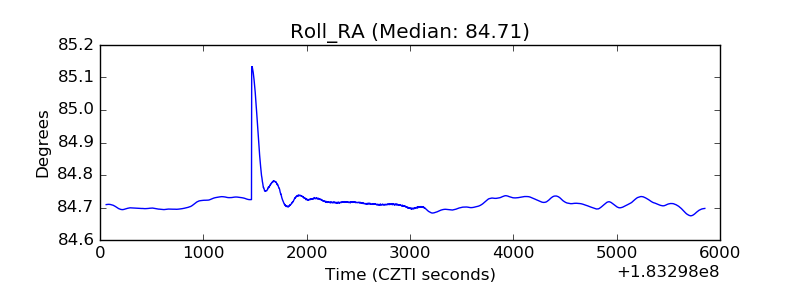 |
| Veto Counter | 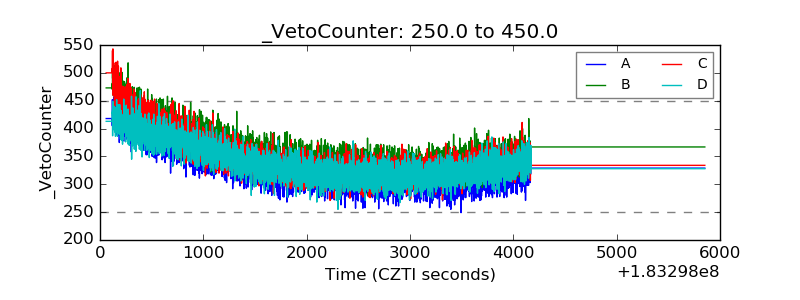 |